RCI3lines
- Göstergeler
- Sürüm: 1.0

Short: Three Rank Correlation Index (RCI) lines of different periods in one oscillator window.
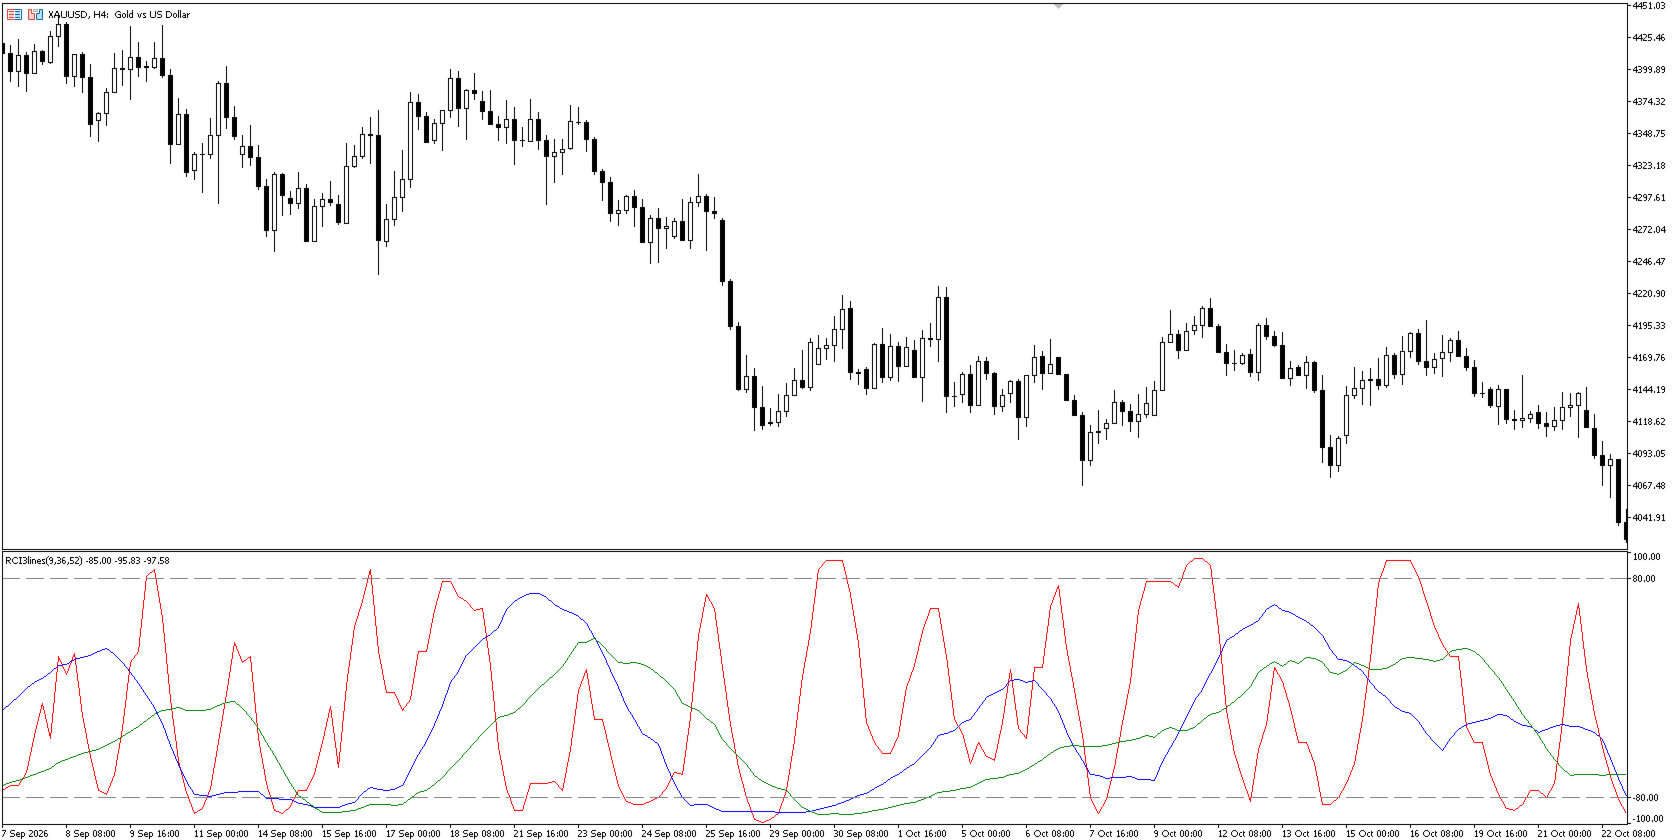
RCI3lines is an oscillator that shows the Rank Correlation Index for three periods at once (short, middle, long). RCI measures how closely the ranking of prices over a period matches the ranking of time, on a scale from -100 to +100.
How it works
- For each period, prices of the last N bars are ranked, and the ranking is compared with the time order (Spearman rank correlation).
- +100 means prices rise steadily across the period, -100 means they fall steadily.
- The last bar is recalculated live; closed bars do not change.
Features
- Three lines: short, middle, long (defaults 9 / 36 / 52)
- Selectable source price
- Adjustable High and Low level lines (defaults +80 / -80)
- Incremental calculation, no DLL, no external requests
Inputs
- Short interval, Middle interval, Long interval (2..1000)
- Source price (Close by default)
- High line [%], Low line [%]
Notes
- Works on any symbol and timeframe, shown in a separate window.
- This is an analysis tool, not a trading signal. It does not guarantee any result.
- Colors and line widths can be changed in the indicator properties.