Helix Volume Profile MT5
- Göstergeler
- Sürüm: 1.0
- Etkinleştirmeler: 10

Helix Volume Profile reads one higher-timeframe session at a time.
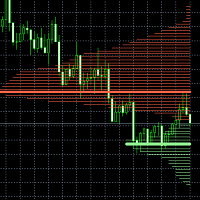
It fits a log-linear regression to that session's closes and draws it as a channel 1.0 standard deviations wide. It then walks every bar of the session, drops each bar's volume into one of 30 bins across the channel, and draws the result as a profile that leans with the regression - so each bin is a parallelogram, not a flat bar. The fullest bin is the Point of Control, and its line takes the bullish or bearish colour according to the way the channel leans. The session's high, low and midpoint are marked and run forward, and a label reports the session's buying volume, its selling volume and the balance between them.
WHAT IT DRAWS
- The regression channel: an upper and a lower edge 1.0 standard deviations from a log-linear fit of the session's closes, in your colour and line style.
- The volume profile across that channel, 30 bins by default and up to 15 bars wide at the fullest bin. The profile is filled with the leaning colour and outlined.
- The Point of Control line, running from the start of the session to the current bar, in the bullish colour when the channel leans up and the bearish colour when it leans down.
- The session high and the session low, and the midpoint between them.
- Forward extensions of the high, the low and the midpoint, 25 bars ahead.
- A four-line label above the session high: the higher timeframe's name, buying volume, selling volume and the balance as a percentage.
- Completed sessions stay on the chart, newest first, up to 10 of them by default and 50 at most.
HOW THE HIGHER TIMEFRAME IS CHOSEN
Auto Higher Timeframe picks one from the chart you are on: a 1-minute chart groups into 4 hours, 2 to 14 minutes into 12 hours, 15 to 59 minutes into 2 days, 1 to 4 hours into a week, and 4 hours to a day into a month. Turn it off and type your own - 240, D, W, 2M and so on. The label tells you which one is in use.
WHAT MOVES AND WHAT DOES NOT
Everything the current session draws is recalculated on every tick while the session is forming. The channel, the bins, the Point of Control, the session high and low and the label all move as the session develops - that is what reading a live session means, and it is said here plainly rather than left to be discovered. Once a session ends, its drawings are fixed on its closed bar and never change again. The completed sessions behind the current one are a record, not a moving picture.
SETTINGS
22 settings settings, grouped: the higher timeframe, the channel width, the colours and line styles, the profile and its label, and the history depth. Bin Count runs 5 to 100; Max Completed Sessions runs 1 to 50. Everything else is open, including the degenerate values - a channel width of zero collapses the band, and a profile width of zero makes the profile a vertical line.
A MetaTrader group adds Bars To Compute, which sets how much chart history is worked through. Left at 0 it uses every bar on the chart. Lowering it makes the first load faster and drops sessions older than the ones on screen.
WHAT IT IS NOT
- It does not place trades. It draws; you place and manage every order.
- It does not promise a result, and it does not see the future. A session's channel and its Point of Control describe where volume has already traded, not where price will go.
- It keeps no record of outcomes and reports none.
Trading leveraged products carries a high level of risk and can result in the loss of all of your capital. Past behaviour of any market is not a guide to its future behaviour.