Smart Trade Analyzer
- Yardımcı programlar
- Sürüm: 1.20
- Güncellendi: 16 Kasım 2026
- Etkinleştirmeler: 5

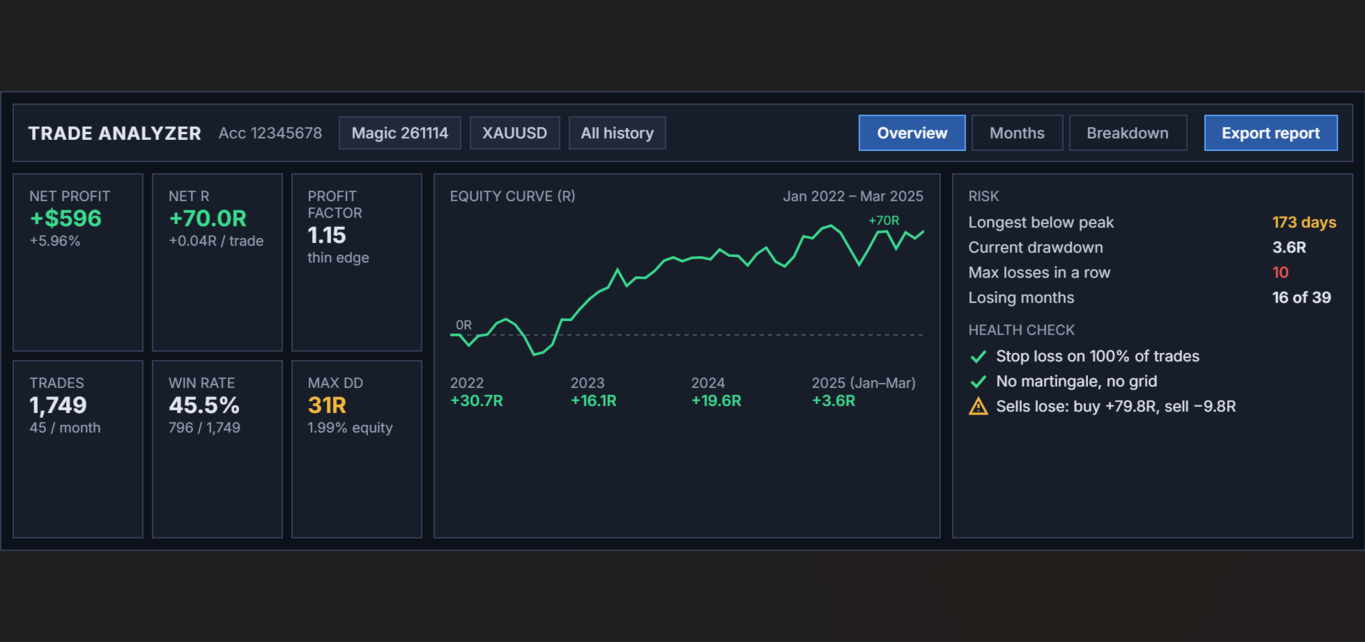
See the real quality of any EA or manual trading: results in R, money and percent, time below peak, monthly heatmap, results per comment, symbol and direction, plus an automatic martingale, grid and no-stop-loss check.
Net profit tells you how much an EA made. It does not tell you how it made it, how long you had to wait through losses, or whether the account is one bad week away from disaster. Smart Trade Analyzer reads your account history inside MetaTrader 5 and answers those questions on one panel.
Attach it to any chart. It works for any EA, for manual trading, and for any account you can log in to, including read-only investor access. Nothing is uploaded anywhere: your data stays in your terminal.
What it answers
- Does this EA really have an edge? Results in R (risk multiple) show the quality of the system, not the size of the lot.
- How bad can it get? Maximum drawdown in R, money and percent, the longest time below the previous peak, and the longest losing streak.
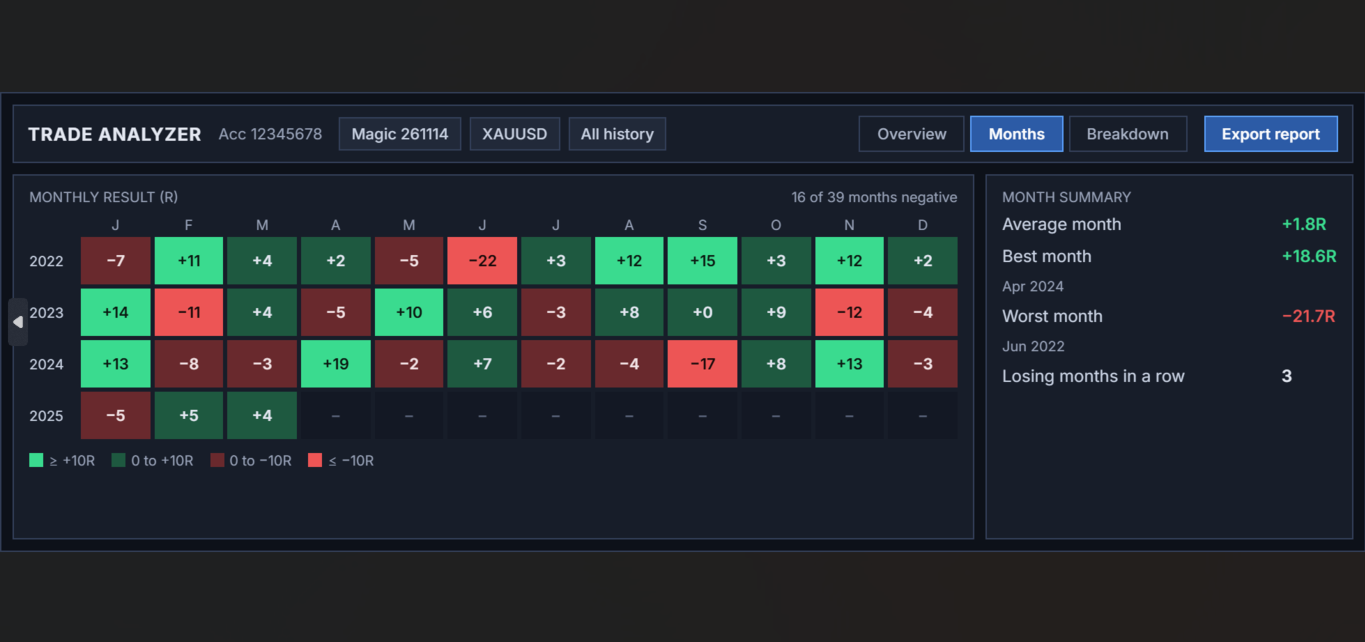
- When does it work? A monthly heatmap and results per year.
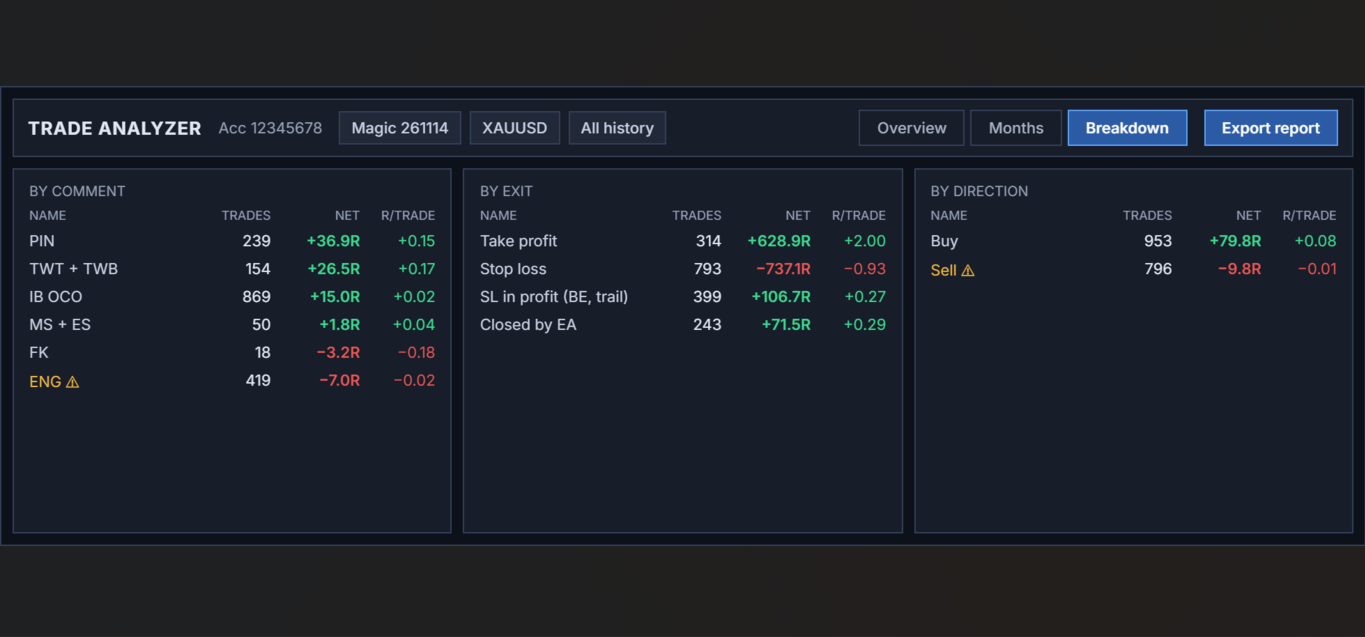
- What actually makes the money? Results per comment (for example per pattern or strategy), per exit type, per direction and per symbol.
- Is it safe? An automatic health check for martingale, grid and trades without a stop loss.
Panel
Choose a portrait layout (360 x 640) or a landscape layout (980 x 330), in any chart corner, with a dark or light theme. The panel can be minimized to one line.
- Overview: net profit, net R, profit factor, trades per month, win rate, maximum drawdown, equity curve and results per year.
- Risk: drawdown, current drawdown, longest time below peak, streaks, losing months, largest loss and the health check.
- Months: a colour heatmap of every month, with the best, worst and average month.
- Breakdown: results per comment, per exit (take profit, stop loss, stop loss in profit, closed by EA, closed manually, stop out), per direction and per symbol. Losing groups with many trades are marked.
In the landscape layout the Risk tab is part of the Overview.
Health check
- Stop loss usage: the share of positions opened with a stop loss.
- Martingale: the lot raised right after a losing trade, again and again.
- Grid: several positions open at the same time.
- Direction: a warning when buys and sells give opposite results.
Grid and martingale EAs: basket mode
For EAs that close many positions together, turn on basket mode. Positions of the same symbol and magic number closed within a few seconds count as one basket, so win rate and drawdown describe whole cycles, not single positions. The health check still looks at every single position.
Filters
Filter by magic number (all trades, manual trades only, or one EA), symbol, period and comment text. Attach several copies on different charts to compare EAs side by side.
Export report
One click writes the full analysis to an HTML file: summary, equity curve, yearly table, monthly heatmap, breakdown tables and health check. Open it in any browser or share it with others.
Updates by itself
The panel checks for new closed trades every few seconds and refreshes on its own.
Input parameters
| Parameter | Default | What it does |
|---|---|---|
| Magic number | -1 | -1 = all trades, 0 = manual trades, any other number = one EA |
| Symbol | empty | Empty = all symbols, "current" = the chart symbol, or a symbol name |
| Period | All history | All history, this year, this month or a custom range |
| Custom period from / to | 2024.01.01 / 2030.12.31 | Used only with the custom period |
| Comment contains | empty | Only trades whose comment contains this text |
| Panel layout | Portrait | Portrait (360 x 640) or landscape (980 x 330) |
| Panel corner, X / Y offset | Left upper, 12 / 28 | Position on the chart |
| Theme | Dark | Dark or light |
| Start minimized | false | Show only the title bar at start |
| Main unit | R | R, money or percent of the start balance |
| Mark a losing group with at least N trades | 100 | Marks losing comments, symbols or directions with many trades |
| Group positions into baskets | false | Count positions closed together as one basket (grid and martingale EAs) |
| Basket: closed within N seconds | 10 | Time window for one basket |
| Check for new trades every N seconds | 5 | Refresh interval |
How the numbers are calculated
- One closed position is one trade. Partial closes are added together until the position is fully closed.
- R is the trade result divided by the money at risk at the initial stop loss. A trade that loses exactly its stop loss is -1R.
- When fewer than 80% of trades have a stop loss, R cannot describe the results, so the panel switches to percent of balance and says so.
- Drawdown is measured on closed trades. Deposits and withdrawals are not counted as profit or loss.
- Martingale is flagged when the lot is raised right after a losing trade at least 3 times and in at least 30% of the trades that follow a loss. Grid is flagged when more than 2 positions were open at the same time.
- For the most complete result, set the History tab of the terminal to All History.
Limitations
- R uses the current tick value of each symbol. For symbols quoted in another currency than the account, older trades in R can be slightly off.
- A position opened before the history your broker keeps cannot be read.
- On netting accounts, a position reversed in one deal counts only as the closing part.
- MetaTrader 5 mobile apps do not run custom indicators. Use the panel on a desktop terminal or VPS, or share the exported report.
Disclaimer
Smart Trade Analyzer reports past results only. Past results do not guarantee future results. Trading involves risk.