Visual ZZ ABC Pivot v2

📊 Visual ZigZag ABC & Pivot Breakout (Indicator for MT5)

Short Description

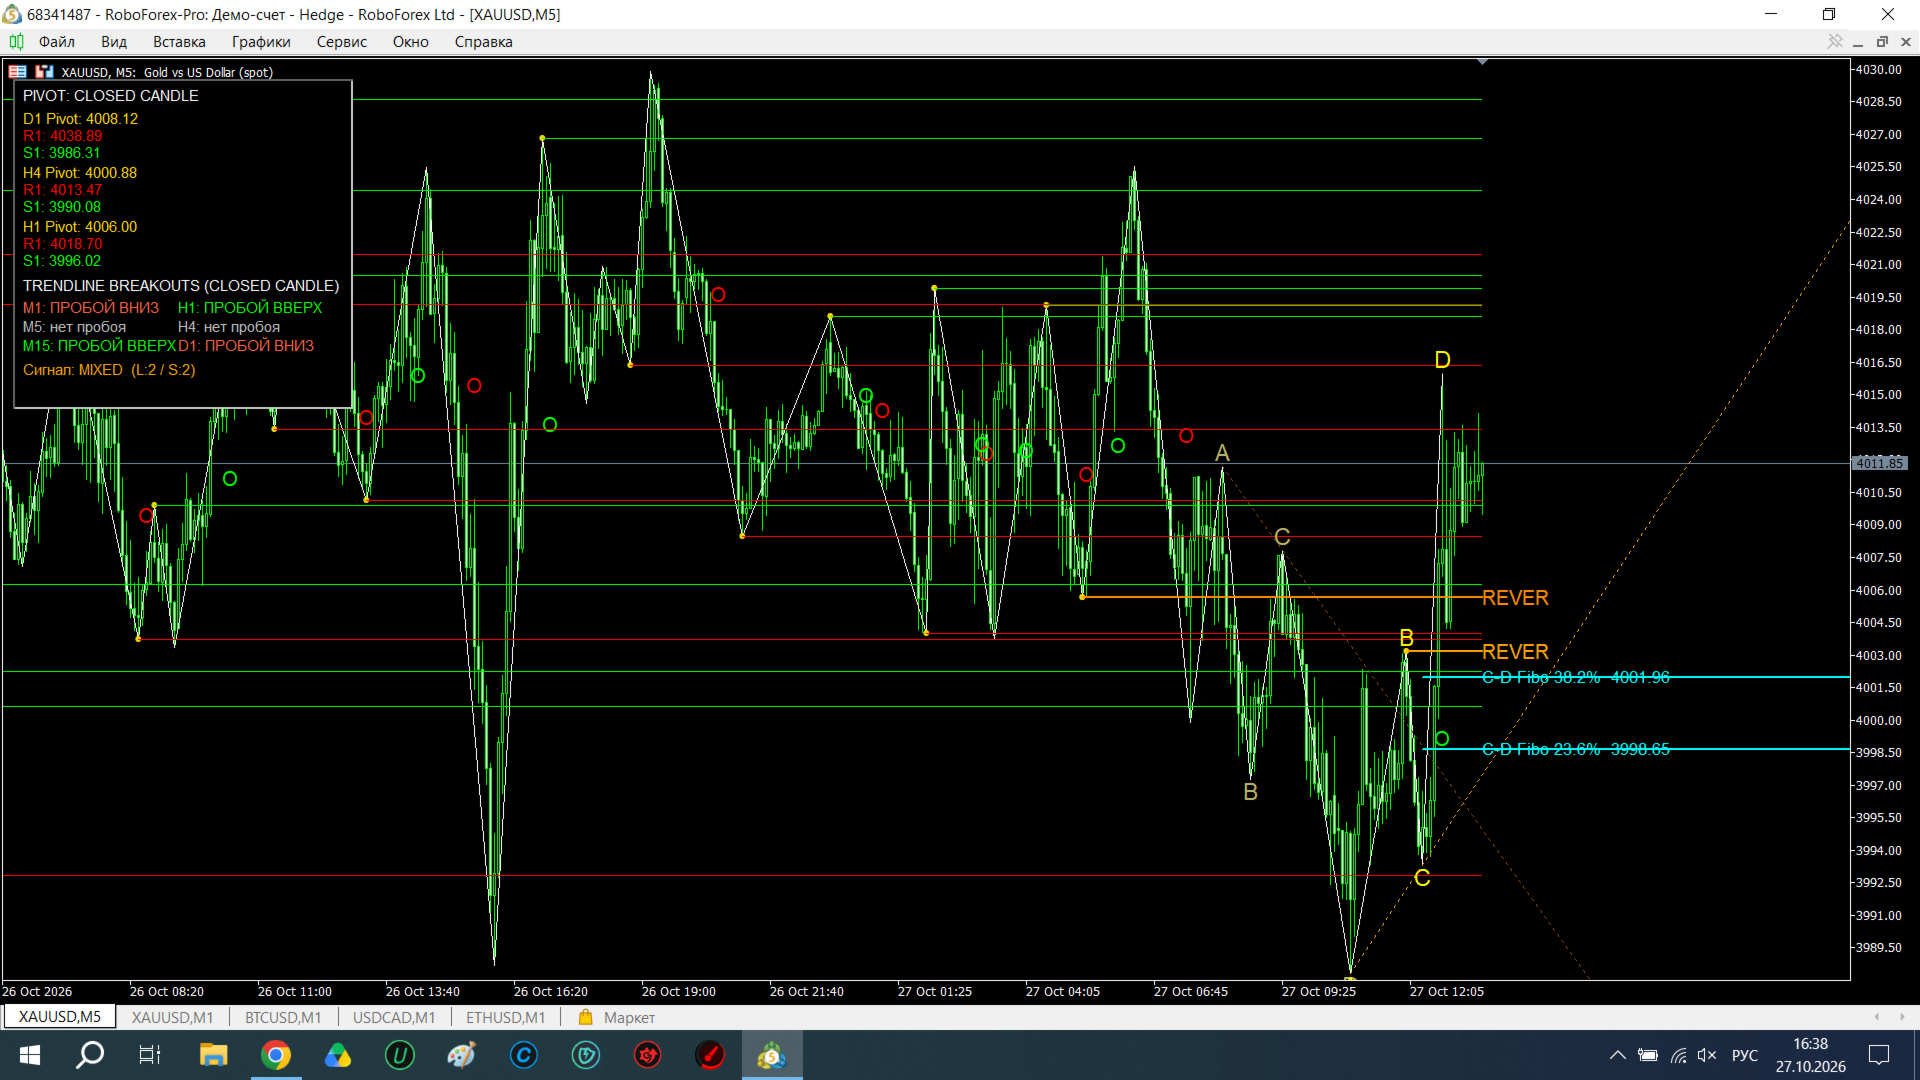
A professional visual indicator for MetaTrader 5 that combines market structure based on ZigZag, ABC(D) patterns, Fibonacci levels, daily Pivots, and automatic trendline breakout detection across 6 timeframes. The indicator does not trade; it provides ready-to-use visual signals for your trading decisions.

🎯 Key Features

1. ZigZag Structure (Depth 7)

The indicator automatically identifies local highs and lows (Depth=7, Deviation=5) and connects them with white lines. This is the foundational market structure upon which all subsequent signals are built.

2. ABC(D) Pattern — Two Formations

The indicator searches for classic wave structures:

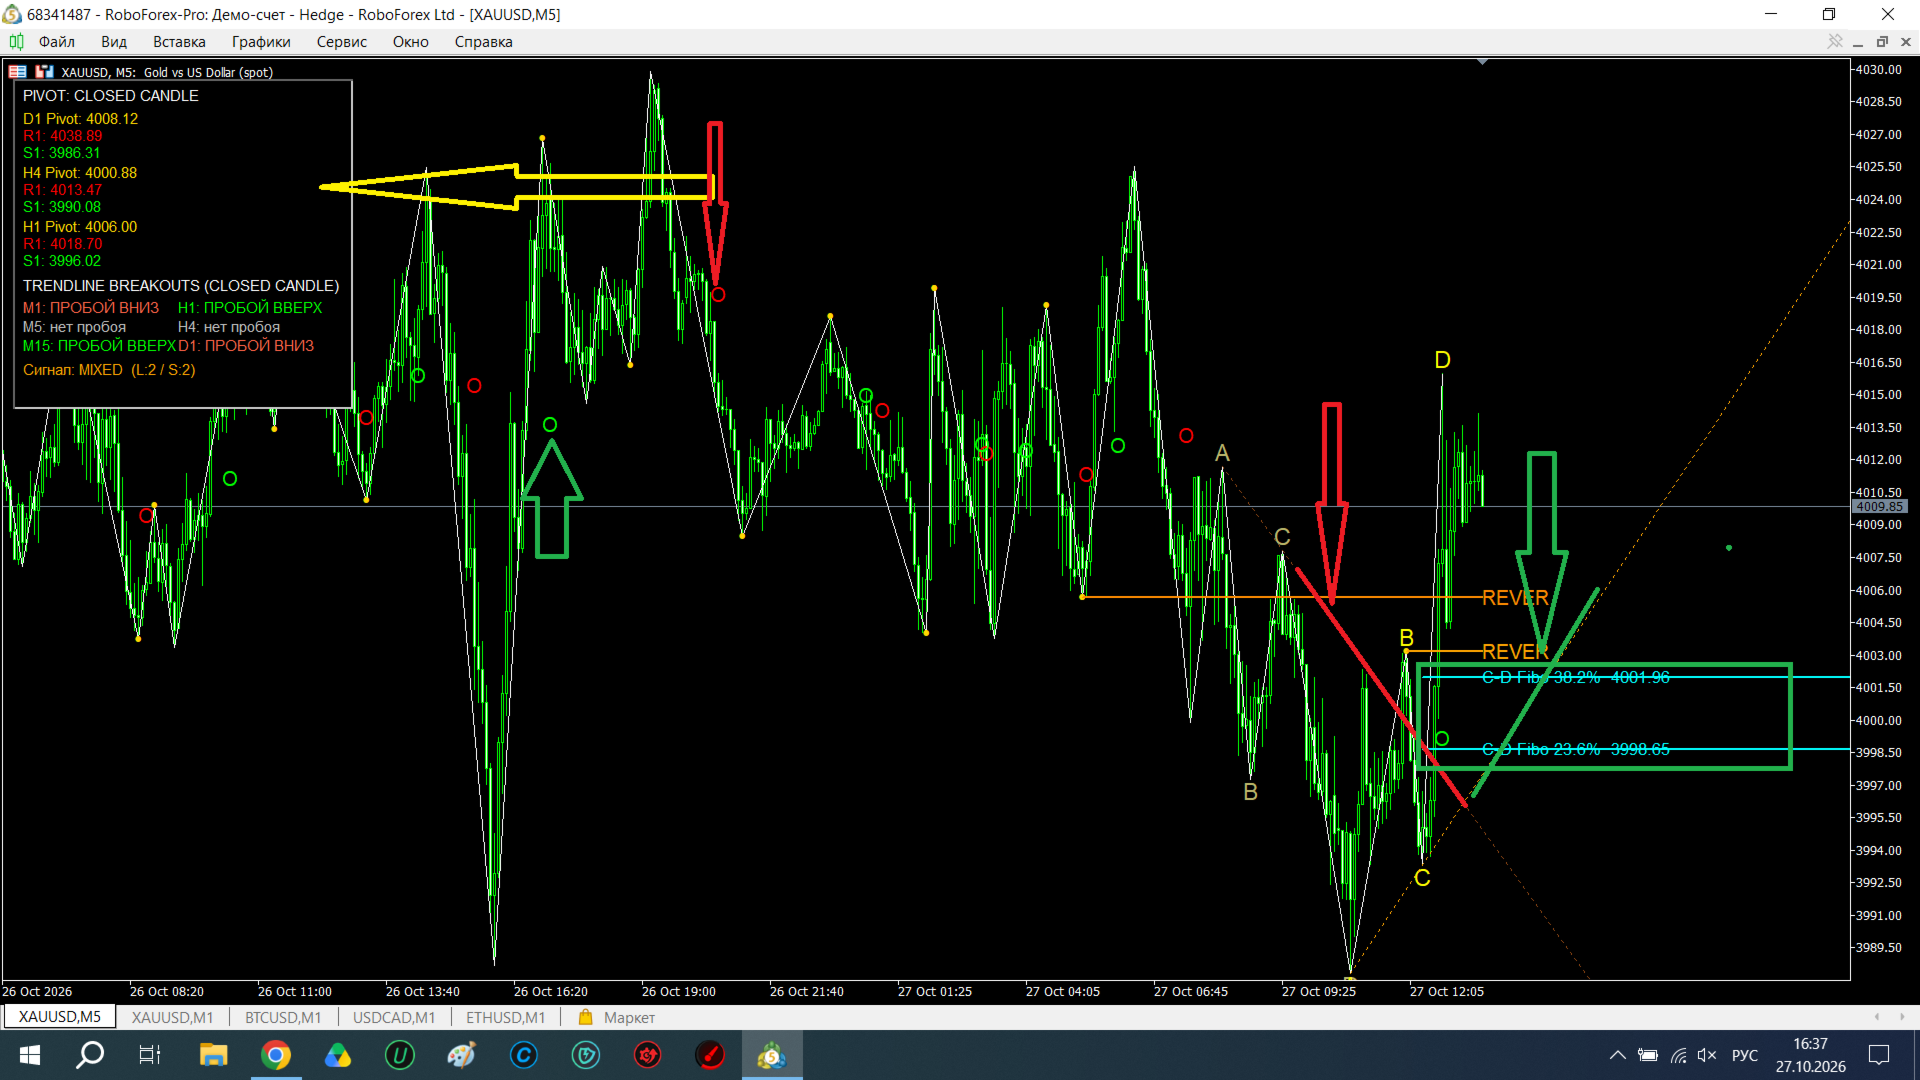
  • Ascending: A(Low) → B(High) → C(Low) → D(High), where C > A and D > B.

  • Descending: A(High) → B(Low) → C(High) → D(Low), where C < A and D < B.

Two most recent formations are displayed on the chart:

  • Current (bright): yellow letters A, B, C, D + orange A-C line.

  • Previous (faded): dark yellow letters + brown A-C line.

3. Fibonacci C-D (23.6% and 38.2% Levels)

Based on the latest ABCD formation, the indicator automatically plots Fibonacci levels from point C (0%) to point D (100%):

  • 23.6% — the first correction level.

  • 38.2% — the second correction level.

These levels (turquoise lines) help identify potential pullback zones after an impulse.

4. REVER Levels (Two Formations)

For each MA14/MA50 crossover, the indicator finds the nearest significant ZigZag extremum and builds a horizontal level from it. The chart displays:

  • Current level (bright orange): dash-dot line labeled "REVER".

  • Previous level (faded): for comparison and history.

5. MA14/MA50 Crossover Signals

  • Red circle ("O") — MA14 crossed MA50 downwards (bearish signal).

  • Green circle ("O") — MA14 crossed MA50 upwards (bullish signal).

6. Pivot Panel (D1, H4, H1)

A panel in the upper right corner displays the following levels:

  • P (Pivot) — yellow.

  • R1 (Resistance) — red.

  • S1 (Support) — green.

Pivots are calculated based on the last closed candle of the respective timeframe (D1, H4, H1), which eliminates repainting and false signals.

7. Trendline Breakouts across 6 Timeframes

The panel automatically analyzes A-C line breakouts across six timeframes (M1, M5, M15, H1, H4, D1):

  • BREAKOUT UP (green) — price closed above the descending A-C line.

  • BREAKOUT DOWN (red) — price closed below the ascending A-C line.

  • no breakout (gray) — no breakout detected.

An overall signal is displayed at the bottom of the panel:

  • LONG — breakouts upward only.

  • SHORT — breakouts downward only.

  • MIXED — conflicting signals.

  • NONE — no breakouts.

⚙️ Settings

Parameter Description
InpFastMA / InpSlowMA Fast (14) and slow (50) MA periods.
LookbackBars Number of bars to analyze (1000).
ZZDepth / ZZDeviation ZigZag parameters (7 / 5).
Colors Full customization of colors for ZigZag, circles, letters, lines, REVER, and Fibonacci.
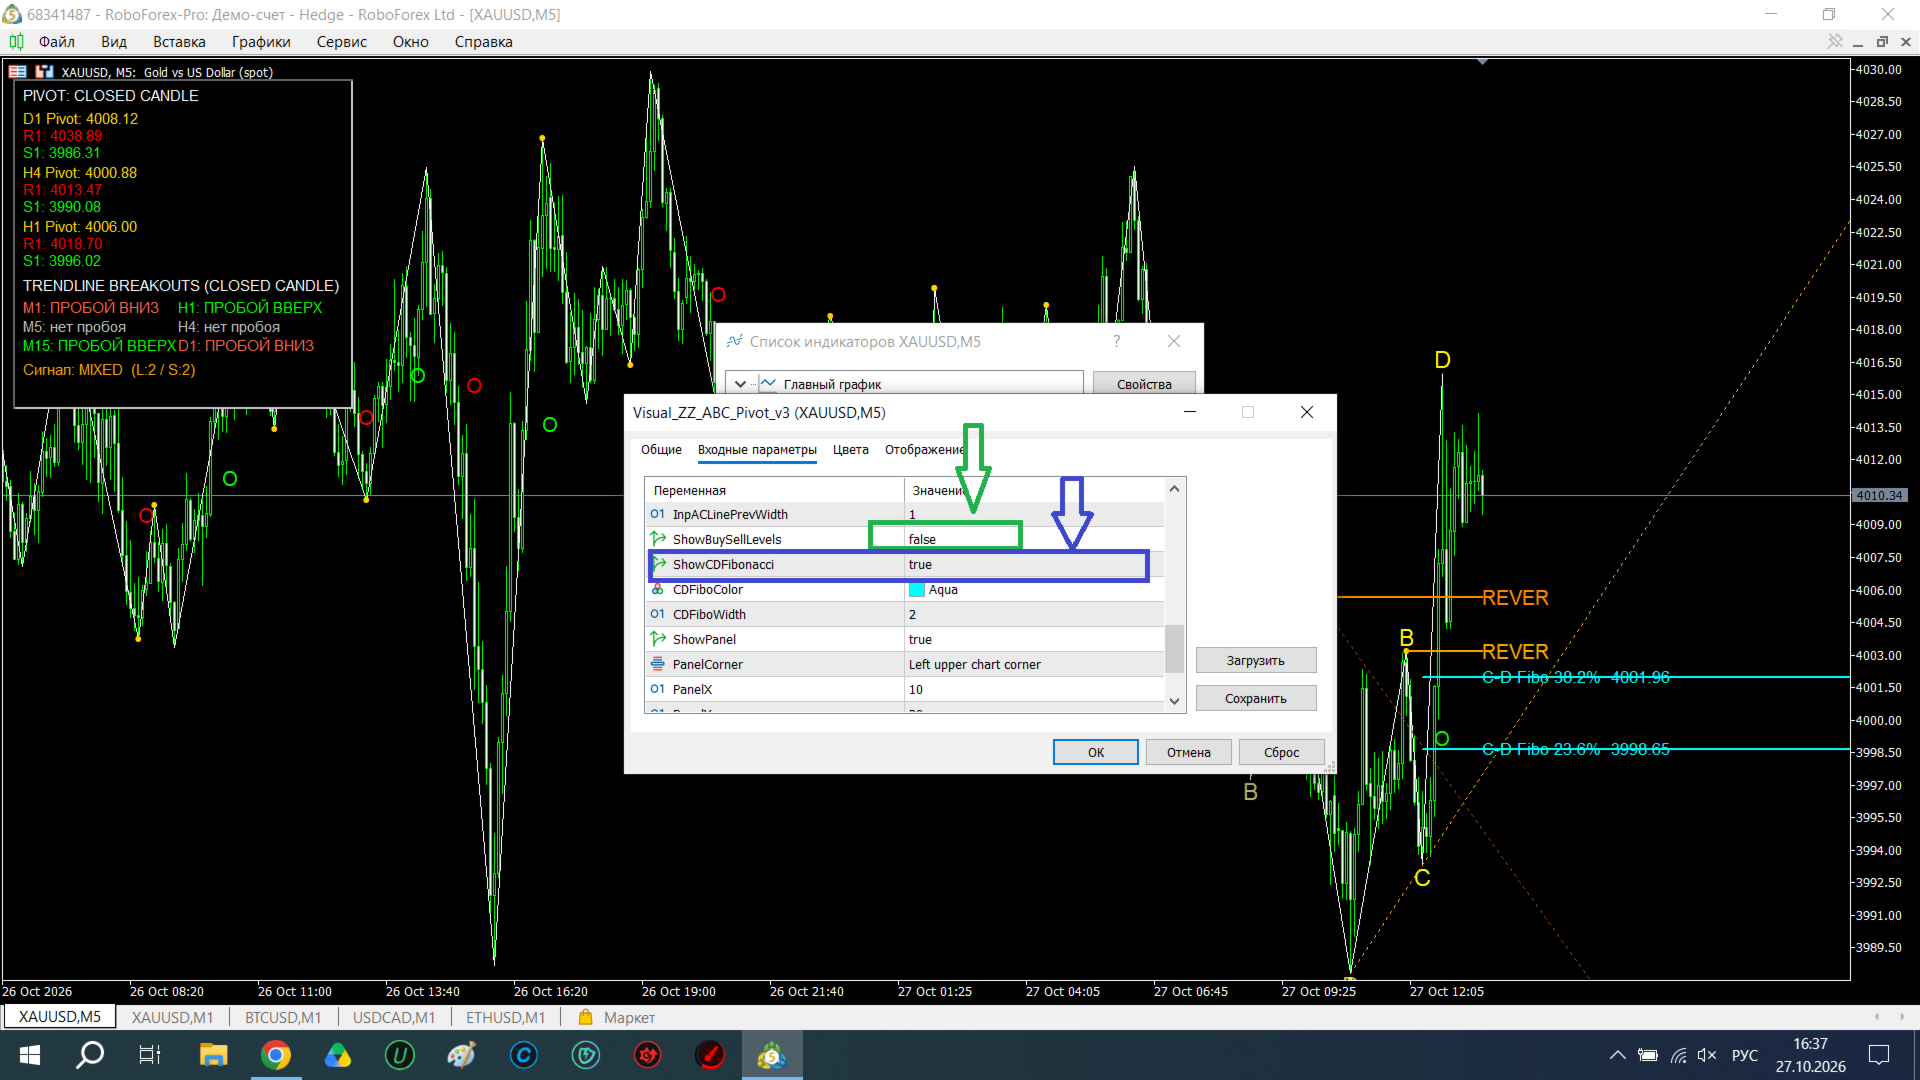
ShowBuySellLevels Enable/disable horizontal Buy/Sell levels.
ShowCDFibonacci Enable/disable C-D Fibonacci levels.
ShowPanel Show/hide the panel.
PanelCorner Panel placement corner (default: upper left).

💡 How to Use

  1. Identify the trend using the Pivot panel and trendline breakouts.

  2. Wait for a signal on the MA14/MA50 crossover (circle).

  3. Check the ABCD structure — is there a current formation?

  4. Use REVER levels as entry points (pullback to the extremum).

  5. Fibonacci C-D — for identifying correction zones.

  6. Breakout panel — for trend confirmation on higher timeframes.

🚀 Advantages

  • Multi-timeframe analysis — 6 timeframes simultaneously.

  • Two formations — see both current and previous structure.

  • Automatic Pivots — based on closed candles, no repainting.

  • Fibonacci C-D — a unique feature not found in standard indicators.

  • Clean visuals — no unnecessary objects, only essential signals.

  • No trading — analysis only; you control every trade.

🎨 Recommended Timeframes

  • M1–M5 — for scalping (use M1/M5 breakouts).

  • M15–H1 — for intraday trading (primary focus).

  • H4–D1 — for medium-term analysis.

⚠️ Important

The indicator does not provide guaranteed signals and is not a trading strategy. Use it as an analysis tool in combination with your own trading system and risk management.
Önerilen ürünler
Liquidity Map
Alex Amuyunzu Raymond
Liquidity Map  Overview The Liquidity Map indicator is an advanced visualization tool based on ICT Smart Money Concepts . It automatically identifies daily Buy Zones , Sell Zones , and Liquidity Levels , showing where price is likely to reverse or continue based on institutional order flow. It calculates key levels from the daily session — such as the previous day’s high, low, and midpoint — then derives a premium (sell bias) and discount (buy bias) structure. When price trades into these mapped
Murrey Math Lines The concept of this technical analysis system was developed by T. Henning Murrey in 1995 and described in The Murrey Math Trading System; For All Markets. The main concept here is that all markets behave in the same manner based upon the observations made by W.D. Gann. To date, the Murrey Math Line X it is one the most popular methods of Forex analysis and trading. Formula The Murrey Math Line X is calculated with the help of price movement segment, which, in accordance to Gan
mql4 version:  https://www.mql5.com/en/market/product/44606   Simple indicator to calculate profit on fibonacci retracement levels with fixed lot size, or calculate lot size on fibonacci levels with fixed profit. Add to chart and move trend line to set the fibonacci retracement levels. Works similar as default fibonacci retracement line study in Metatrader. Inputs Fixed  - select what value will be fix, lot or profit Fixed value  - value that will be fix on all levels Levels  - levels for which
"Manual channel drawing? Not anymore. Let the market structure reveal itself automatically." "Track long-term price zones 24/7, in real-time." Real Trader Pain Points Identifying pivot points manually takes   huge time   and   effort Difficult to adapt to   high volatility   and pinpoint   reliable channels Copy Ideas "Markets never sleep. Why should your analysis stop?" "Dozens of assets a day—how do you keep up?" Core Claim AutoChannels   automatically reads market structure , reducin
Fractal Market Structure CHoCH BOS MT5 Fractal Market Structure CHoCH BOS MT5 is a price-action indicator designed to identify market structure through confirmed fractal formations. Instead of relying only on traditional swing-point calculations, the indicator analyzes structured candle patterns to locate important highs and lows, detect changes in directional behavior, and display relevant market structure events directly on the chart. The indicator can identify bullish and bearish Break of Str
Expert. Automatic and manual trading. Ready-made trading system based on Elliott waves and Fibonacci retracement levels . It is simple and affordable. Display of the marking of Elliott waves (main or alternative option) on the chart. Construction of horizontal levels, support and resistance lines, a channel. Superposition of Fibonacci levels on waves 1, 3, 5, A Alert system (on-screen, E-Mail, Push notifications).    visual panel for opening orders in manual trading. visual panel for setting up
TM Price Stretch Map, bir mumun bant dışında kapanmasını ve sonraki tamamlanmış mumun yeniden bantların içine dönmesini grafikte gösterir. Düz çizgili bantlar, yalnızca ilgili anda mevcut olan fiyatları kullanan nedensel bir Gauss çekirdeği hesabına dayanır. Üst bandın üzerindeki kapanış kırmızı nokta, alt bandın altındaki kapanış turkuaz nokta ile gösterilir. Bir sonraki tamamlanmış mum iki bandın arasında kapanırsa, üst bant taşmasından sonra aşağı ok; alt bant taşmasından sonra yukarı ok görü
FREE
LIGHTHOUSE — piyasa yapısını bir bakışta görün. Yeniden çizim yok. LIGHTHOUSE, fiyat yapısını onaylanmış salınım noktalarından okur ve grafikte sade, anlaşılır biçimde gösterir. Her takdire dayalı yatırımcının girişten önce sorduğu üç soruyu yanıtlar: Üst zaman dilimi hangi yöne gidiyor? Mevcut grafik hangi yöne gidiyor? Önemli fiyat seviyeleri nerede? Karar destek aracıdır. İşlem açmaz ve fiyat tahmini yapmaz. Neden "LIGHTHOUSE" (deniz feneri)? Deniz feneri gemilere yolu gösterir ve kayalıkları
Simple indicator to calculate fibonacci retracement levels on time. Add to chart and move trend line to set the fibonacci retracement levels. Inputs Levels  - levels for which to calculate values, separated by space, default are fibonacci levels Show time  - if true, time will be shown on levels Show date  - if true, date will be shown on levels Show fibonacci level  - if true, value of levels will be shown Fibonacci lines color  - color of levels Trend line color  - color of trend line which de
FREE
Neuro Poseidon MT5
Daria Rezueva
4.75 (52)
Neuro Poseidon is a new indicator by Daria Rezueva. It combines precise trading signals with adaptive TP/SL levels - creating best possible trades as a result! Message me and get  Neuro Poseidon Assistant  as a gift to automize your trading process! What makes it stand out? 1. Proven profitability on all assets and timeframes 2. Only confirmed BUY and SELL signals present on the chart 3. Adaptive TP & SL levels generated by the software for each trade 4. Easy to understand - suitable for al
Manyal trading system, CovEchoTrend Robot, focuses on reliability and flexibility. By employing statistical analysis methods to study the relationships between the base indicator and market patterns, the system enables a deeper understanding of market processes. Intelligent pattern analysis: The application of statistical data processing helps identify key trend reversal points more accurately, signaling significant market shifts. Informed decision-making is based on the intersection of indicato
Trading Vision Ex
Vitalii Zakharuk
Trading Vision — Trading Expert Advisor for MetaTrader 4/5 Overview Trading Vision is an automated trading Expert Advisor (EA) designed for traders who want to monitor not only market entries but also the overall condition of their trading account. Unlike systems focused exclusively on entry signals, Trading Vision also monitors the combined performance of all open positions and includes built-in account protection rules designed to limit excessive drawdown. Key Features Series-level management
Pulsar X
Dmitriq Evgenoeviz Ko
PULSAR X — Gold Market Momentum Monitoring The XAUUSD market doesn't forgive simple decisions. High volatility, false breakouts, and aggressive reactions to news make classic indicator-based strategies vulnerable. PULSAR X is a next-generation algorithmic system designed to accurately operate in market congestion and impulse exhaustion conditions. This is not a trend bot or an averaging mechanism. PULSAR X analyzes the moment when crowd pressure loses its force and the market moves from chaos t
Autorithm AI
Zaha Feiz
3.72 (18)
Autorithm AI Teknik Açıklama AUTORITHM, MetaTrader 5 için tasarlanmış, kapsamlı piyasa analizi amacıyla 10 özel yapay zeka katmanı uygulayan gelişmiş bir yapay zeka destekli alım‐satım sistemidir. Expert Advisor, piyasa verilerini işlemek, alım‐satım fırsatlarını belirlemek ve akıllı risk yönetim protokolleriyle işlemleri yürütmek için uyum içinde çalışan sofistike yapay zeka algoritmalarını kullanır. [guide line]       [SET FILES] Temel Özellikler Sistem, piyasa koşullarını analiz etmek ve işl
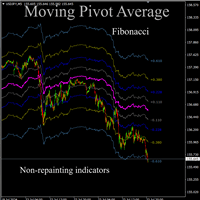
Moving pivot Average Fibonacci The  indicator compares the selected period with its counterpart from the previous period. The indicator determines the moving Fibonacci levels for the day or any time interval to assess the price movement range from the time average. The indicator helps predict the expected high or low for the day based on historical time data. The pivot line can be considered an average trend line and use it in a variety of trading strategies. If you have any question about the
I recommend you to read the   product's blog  (manual) from start to end so that it is clear from the beginning what the indicactor offers. This multi time frame and multi symbol trend indicator sends an alert when a strong trend or trend reversal has been identified. It can do so by selecting to build up the dashboard using Moving average (single or double (both MA:s aligned and price above/below both)), RSI, Bollinger bands, ADX, Composite index (Constance M. Brown), Awesome (Bill Williams), 
Historical Pivot Zones - Fibonacci Indicator MT5 Automatically draws Fibonacci retracement and projection zones based on historical price pivots. This MT5 indicator intelligently selects pivot points from different timeframes (weekly, monthly, or 6-month ranges) and creates visual Fibonacci zones around key levels. Features include: Smart Mode Selection - Auto-adjusts based on your chart timeframe Clean Visual Zones - Highlighted areas instead of just lines Essential Fib Levels - 9 retrace
Displays trends in current chart. You can display trends of multiple timeframes in one chart by inserting this indicator as often as you want. Key features: displays trend line by finding highs and lows counts number of high/low of current trend in different color (long/short) allows you to display multiple timeframe trends in one chart Settings: Indicator Name: if you want to show M5 and H1 on one chart add TITrend twice to your current chart and rename M5 to "TITrendM5" and H1 to "TITrendH1" C
Start with the loss, not the profit. First decide how deep a drawdown you are willing to sit through — 5-10%, 20-30%, or more — and then let the system go after returns inside that limit. That is the order Veteran Army Nasdaq works in. And because no one knows when the index will make its next real move — or in which direction — it stands ready on both sides of one market, with many independent systems instead of one confident bet. At a glance Market: US Tech 100 index, long and short, on the H1
Introduction to Harmonic Pattern Scenario Planner The present state of Forex market can go through many different possible price paths to reach its future destination. Future is dynamic. Therefore, planning your trade with possible future scenario is an important step for your success. To meet such a powerful concept, we introduce the Harmonic Pattern Scenario Planner, the first predictive Harmonic Pattern Tool in the world among its kind. Main Features Predicting future patterns for scenario
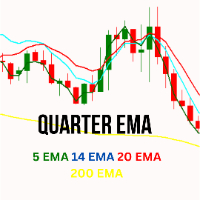
Quarter EMA
Jithin Sajan Sajan
Kindly rate and comment about the product for upgradation & Support The 5 EMA is plotted in green color ( Lime ). The 14 EMA is plotted in red color ( Red ). The 20 EMA is plotted in blue color ( Blue ). The 200 EMA is plotted in yellow color ( Yellow ). The Quarter EMA that provided calculates and plots four Exponential Moving Averages (EMAs) on the chart using different periods: 5, 14, 20, and 200. Each EMA is represented by a different color on the chart. Here's a description of each EMA:
Quintet EMA
Jithin Sajan Sajan
Kindly rate and comment about the product for upgradation & Support The   5 EMA   is plotted in   green   color ( Lime ). The  14 EMA  is plotted in  red  color ( Red ). The   20 EMA   is plotted in   blue   color ( Blue ). The  200 EMA  is plotted in  black  color ( Black ). The   200 EMA   is plotted in   yellow   color ( Yellow ). The Quarter EMA that provided calculates and plots four Exponential Moving Averages (EMAs) on the chart using different periods: 5, 14, 20, and 200. Each EMA is
A Chart-style Long/Short Position tool for MT5. Drag entry, take profit and stop loss directly on the chart, see the risk/reward ratio and the lot size calculated from your risk % instantly. Green TP zone, red SL zone, clean English labels, and a round on-chart button to show or hide the tool. Purely visual - it never opens, modifies or closes orders. Plan trades on MetaTrader 5 visually, directly on the chart. Place the box, drag the levels, and read the price, RR and position size at a glance.
Multi-Strategy Scanner is a technical indicator for MetaTrader 5. It monitors multiple technical analysis methods and displays signal indications based on user-defined configurations. This product does not execute trades or manage positions. Included Analysis MethodsThe indicator evaluates the following methods: Trend Pullback Liquidity Sweep Breakout and Retest Asian Range Breakout VWAP Reversal Opening Range Breakout (ORB) Bollinger Band Squeeze Fibonacci Pullback Supply and Demand Volatility
Gold M3 Doji Breakout H1 Gold M3 Doji Breakout H1 is an automated MetaTrader 5 Expert Advisor designed to identify a fixed M3 compression structure inside a closed H1 candle and evaluate a breakout during the following H1 trading window. This product is designed for Gold symbols. Its default absolute-price distances are not intended for Forex pairs, cryptocurrencies or stock indices. Position management The EA divides the position into three stages: - Stage 1 closes at the configured first
# Volume Divergence Tracker - Price to volume correlation *Category: Volume | Difficulty: intermediate | Window: separate window below the chart | Markets: Universal (Forex, indices, commodities, crypto, stocks) | Suggested timeframes: M15, M30, H1, H4, D1* ## Short description > Measures the rolling correlation between the size of price moves and the change in volume. It recognises when movement loses the support of participation. ### Overview In a healthy market price and volume move tog
Adaptive SR Zones – Breakout Edition Adaptive SR Zones is a next-generation MetaTrader 5 indicator that automatically maps support and resistance zones and tracks breakout activity in real time. Designed for traders who rely on market structure and zone confluence, it combines multi-timeframe analysis , breakout confirmation logic , and customizable alerts into one powerful tool. No repainting. Core Features Dynamic Support & Resistance Mapping Detects zones from swing highs/lows and reaction po
SPECIAL LAUNCH OFFER: $30 (1-Month Rent) Limited time offer to build our community and gather feedback! AmbM GOLD Institutional Scalper A high-precision M5 algorithm for XAUUSD (Gold) , engineered to trade exclusively at Institutional Liquidity Levels ($5/$10 psychological marks). PERFORMANCE DATA (BUY ONLY) • Win Rate: 87.09%. • Safe Growth: +$4,113 profit on $10k (13.75% Max Drawdown). • Extreme Stress Test: Successfully generated +$22,997 in a 5-year stress test (2020-2026), proving
Signal Eskiya, in addition to channel lines, reflects entry signals in the form of arrows. Trading strategies using the channel indicator belong to the classic methods of technical analysis, are easy to execute, and therefore available even to beginners. Price ranges work equally well on any trading assets and timeframes, they can be used both independently and with additional confirmation from oscillators and market volumes. American traders say: “Trend is your friend”, which means “Trend is
MarketMagnet
Kelly Adediran Raymond
Are you ready to take your trading journey to new heights? Look no further than MarketMagnet, this groundbreaking indicator designed to propel your trading success with excitement and accuracy. Powered by the convergence of Momentum and CCI (Commodity Channel Index), MarketMagnet equips traders with the ultimate tool to determine direction and entry prices for a wide range of recommended currency pairs and instruments. It is designed for traders seeking to scalp for a few pips on lower timeframe
Bu ürünün alıcıları ayrıca şunları da satın alıyor
ARIPoint
Temirlan Kdyrkhan
1 (4)
ARIPoint is a powerful trading companion designed to generate high-probability entry signals with dynamic TP/SL/DP levels based on volatility. Built-in performance tracking shows win/loss stats, PP1/PP2 hits, and success rates all updated live. Key Features: Buy/Sell signals with adaptive volatility bands Real-time TP/SL/DP levels based on ATR Built-in MA Filter with optional ATR/StdDev volatility Performance stats panel (Success, Profit/Loss, PP1/PP2) Alerts via popup, sound, push, or email Cu
Boba Analysis Suite
Trade Ready Solutions LLC
5 (2)
Boba Analysis Suite Boba Analysis Suite, MetaTrader 5 için geliştirilmiş bir analiz göstergesidir. Piyasa yapısını, önemli fiyat bölgelerini ve genel piyasa bağlamını tek bir grafik görünümünde bir araya getirir. Trader ve trading eğitmeni olarak edinilen uygulamalı deneyimden yola çıkarak geliştirilmiştir. Piyasanın yönünü değerlendirme, önemli seviyeleri belirleme ve birden fazla zaman dilimini birlikte inceleme gibi adımlardan oluşan sistematik bir analiz sürecini destekler. Piyasa Bağlamını
ARICoins
Temirlan Kdyrkhan
ARICoin is a powerful trading companion designed to generate high-probability entry signals with dynamic TP/SL/DP levels based on volatility. Built-in performance tracking shows win/loss stats, PP1/PP2 hits, and success rates all updated live. Key Features: Buy/Sell signals with adaptive volatility bands Real-time TP/SL/DP levels based on ATR Built-in MA Filter with optional ATR/StdDev volatility Performance stats panel (Success, Profit/Loss, PP1/PP2) Alerts via popup, sound, push, or email Cust
AriFocus
Temirlan Kdyrkhan
AriFocus - Non-Repainting Buy/Sell Signals AriFocus - one clear signal. AriFocus marks buy and sell signals directly on the chart and suggests a stop-loss level for each one. Every signal is confirmed on bar close and never repaints. - Buy/sell arrows, confirmed on bar close - Suggested stop-loss level for every signal - Trend band and candle coloring to show direction at a glance - 10 ready-made presets, or your own settings (14 calculation methods) - Pop-up, push and email alerts with entr
OrderFlow Absorption – MT5 için Profesyonel Delta ve Absorpsiyon Sinyal Göstergesi OrderFlow Absorption ile gerçek emir akışı analizinin gücünü keşfedin – MetaTrader 5 için nihai delta histogramı ve absorpsiyon sinyal göstergesi. Fiyat hareketlerinin arkasında gerçekte neler olduğunu görmek isteyen traderlar için tasarlanan bu araç, piyasayı hareket ettiren gizli alım/satım baskısını ve absorpsiyon olaylarını ortaya çıkarır. Özellikler Delta Histogramı Görselleştirme:   Alım ve satım baskısını a
Meravith Scanner
Ivan Stefanov
5 (3)
MERAVITH SCANNER, MetaTrader 5 için profesyonel bir finansal piyasa göstergesidir ve birden fazla analiz aracını tek bir entegre sistemde birleştirir. Tüm hesaplamaları, özel hacim ağırlıklı ortalama fiyat (VWAP) metodolojisini kullanarak otomatik olarak gerçekleştirir ve subjektif yorumları tamamen ortadan kaldırır. Bu gösterge, tüm varlık sınıflarında (Forex, Hisseler, Endeksler, Emtialar, Kripto Paralar) ve M1’den Aylık’a kadar tüm zaman dilimlerinde çalışır. Temel prensip, fiyatın hacmi taki
TrendMaestro5
Stefano Frisetti
note: this indicator is for METATRADER4, if you want the version for METATRADER5 this is the link:  https://www.mql5.com/it/market/product/108106 TRENDMAESTRO ver 2.5 TRENDMAESTRO recognizes a new TREND from the start, he never makes mistakes. The certainty of identifying a new TREND is priceless. DESCRIPTION TRENDMAESTRO identifies a new TREND in the bud, this indicator examines the volatility, volumes and momentum to identify the moment in which there is an explosion of one or more of these da
Meravith MT5
Ivan Stefanov
5 (3)
MERAVITH, MetaTrader 5 için çok zaman dilimli bir hacim ve likidite göstergesidir; her zaman diliminde trendi, destek ve direnç bölgelerini, girişi, hedefleri ve stop loss seviyesini gösterir. Size piyasanın tam bir likidite haritasını, hedge fon tarzı bir likidite aracını verir ve tüm hesaplamaları kendine özgü bir hacim ağırlıklı ortalama fiyat yöntemiyle otomatik yapar, bu yüzden öznel yorum yoktur. Forex, altın (XAUUSD), endeksler ve kriptoda, her zaman diliminde çalışır. Satın alma sonrası
Cycles Plotter
Edoardo Centorame
Cycles Plotter Hareketli Ortalamalar ve Başlangıç Tarihi ile Özelleştirilebilir Döngüler Göstergesi Cycles Plotter, yalnızca kullanıcının inputuna bağlı olarak tamamen özelleştirilebilir iki sinüzoidal döngü çizen gelişmiş bir teknik göstergedir. Döngüleri otomatik olarak üretmez: tüm döngüler yalnızca kullanıcı tarafından ayarlanan parametrelere göre hesaplanır, traderlara fiyat salınımlarını ve potansiyel trend değişikliklerini incelemek için görsel bir araç sunar, otomatik sinyaller veya tahm
AriX
Temirlan Kdyrkhan
1 (4)
AriX Indicator for MT5 A powerful trend-following and signal-evaluation tool AriX is a custom MT5 indicator that combines Moving Averages and ATR-based risk/reward logic to generate clear buy/sell signals. It visualizes dynamic SL/TP levels, evaluates past trade outcomes, and displays win/loss statistics in a clean on-chart panel. Key features include: Buy/Sell signals based on MA crossovers ATR-based SL/TP1/TP2/TP3 levels with visual lines and labels Signal outcome tracking with real-time stat
Piyasanın Gerçekte Ne Yaptığını Görün.   3 piyasa evresini gözünüzün önünde canlı izleyin (Sıkışma, Genişleme, Trend) ve Trend evresinin erken aşamasında daha iyi   girişler yapın.      Tahmin etmeyi bırakın. Piyasayı kurumların ve akıllı paranın okuduğu gibi okumaya başlayın.   MT5 için Apex Market Structure Pro, gürültüyü ayıklayan ve her mumun altındaki gerçek yapıyı gösteren hassas bir akıllı para   analiz aracıdır: likidite, yapı değişimleri, birikim bölgeleri ve trend eğilimi — hepsi tek
Title:FX-AIEA Supply and Demand Zone Indicator (MT5) — Technical Overview Version: 2.51 | Platform: MetaTrader 5 Introduction Supply and demand zones are considered a core manifestation of institutional order flow, providing a more direct reflection of buying and selling pressure than traditional support/resistance levels. This indicator attempts to automate the identification of high-probability supply and demand zones using an adaptive ZigZag algorithm, reducing the subjectivity and time asso
ORB Seeker MT5
Marcela Goncalves De Oliveira
Ürünün sınırlı sayıda bulunmasını ve kıtlığını korumak için özel fiyat! Sadece 599 dolar! Satın alma işleminden sonra, bonus ORB Seeker EA ve kişisel olarak optimize edilmiş set dosyalarını almak için benimle iletişime geçin. Temiz antrenman seanslarında güvenle mola verin! ORB Seeker MT5, doğruluk, sadelik, esneklik ve net grafik yapısı isteyen yatırımcılar için tasarlanmış profesyonel bir Açılış Aralığı Kırılımı (ORB) göstergesidir. Otomatik olarak herhangi bir enstrüman için piyasa öncesi v
Volume Arrow Signal Product Description Volume Arrow Signal is a smart trading indicator designed to help traders identify potential buy and sell opportunities using price action, volume behavior, and directional arrow signals. The indicator places clear arrows directly on the chart, making it easy to spot possible market reversals, trend continuations, and entry opportunities without spending hours analyzing charts manually. Whether you are trading Gold (XAUUSD) , Forex pairs, Indices, or Crypt
Zain Gold ScalpingV5
Ahmed Gamal Abdel Nasser Mohamed
Zain Gold Scalping V5 is a technical analysis indicator for MetaTrader 5 designed for Forex and Gold markets. It provides chart-based market information, trend analysis, signal conditions, and an on-screen dashboard to help traders analyze price movement across multiple timeframes. Main Features The indicator supports multiple timeframes, including M1, M5, M15, M30, H1 and higher timeframes. It can be used with Gold (XAUUSD), Forex currency pairs, indices and other supported instruments. The in
KenKem Master Volume Profiler - Brief Introduction A Display-only volume-profile cockpit for XAUUSD, BTCUSD and other liquid symbols. Draws profile structure, multi-timeframe flow, EMA trend and study-only setup markers. Places no orders. Not a signal service.  It maps where the market has actually traded and reads recent order flow, so you can see structure and lean at a glance.  What it shows: Master and local volume profiles (POC and value-area high/low) - the price shelves that matter. A liv
VTrende Pro
Andrii Diachenko
5 (1)
VTrende Pro - MTF indicator for trend trading with a display panel for MT5 *** Videos can be translated into any language using subtitles (video language - Russian) Although the signals of the VTrende Pro indicator can be used as signals of a full-fledged trading system, it is recommended to use them in conjunction with the Bill Williams TS. VTrende Pro is an extended version of the VTrende indicator. Difference between Pro version and VTrende: - Time zones - Signal V - signal 1-2 waves -    S
First time on MetaTrader, introducing IQ Star Lines, an original Vedic Astrology Based Intraday Trading Indicator. We don't offer free or bonus indicators in exchange of reviews from you. You won't need any free products with this indicator to make it work. ;) Enjoy! Welcome to the new and updated  IQ Star Lines , the ultimate fusion of ancient planetary cycles and modern quantitative trading, published for the first time on Metatrader. This is an indicator built by the developer, who has spent
Boom & Crash & PainX & GainX Ultimate Spike Detector Trade Spikes With Confidence — Not Guesswork Catching spikes should be one of the most profitable strategies in synthetic markets. But for most traders, it becomes one of the most frustrating. You enter too early… price goes against you. You wait for a spike… it never comes. You finally catch one… but don’t know whether to hold or close. You make profit… then give it all back because there’s no exit plan. This is exactly the problem the Ultim
Historical Similarity Matcher Indicator (HI.SI.MA) Try it free today — demo version now available!   https://www.mql5.com/en/market/product/167114 Overview The Historical Similarity Matcher is a technical analysis indicator for MetaTrader 5. It scans historical price data to find segments that show statistical similarity to a user-selected reference period on the chart.
Kısa ve öz Bu gösterge, iki uzmanı – RSI ve MACD'yi – tek bir sistemde birleştirir . İki ayrı grafiğe bakıp tahmin yürütmek yerine, kararı sizin için verir: Her iki gösterge de aynı fikirde olduğunda bir ok çizer (al veya sat). En önemlisi: Oklar yeniden çizilmez . Bir kere belirdi mi, olduğu yerde kalır. Backtest yapabilir ve canlı işlemlerinize güvenebilirsiniz. "Combo" ne anlama geliyor? Normalde bir trader, RSI'ye (hareketin gücü) ve MACD'ye (trend yönü) ayrı ayrı bakar. Burada ikisi takım h
MasterTrend
Temirlan Kdyrkhan
MasterTrend Indicator for MT5 A powerful trend-following and signal-evaluation tool MasterTrend   is a custom MT5 indicator that combines Moving Averages and ATR-based risk/reward logic to generate clear buy/sell signals. It visualizes dynamic SL/TP levels, evaluates past trade outcomes, and displays win/loss statistics in a clean on-chart panel. Key features include: Buy/Sell signals based on MA crossovers ATR-based SL/TP1/TP2/TP3 levels with visual lines and labels Signal outcome tracking wit
SMC Sweep Fvg MT5
Daniil Sleptsov
5 (1)
SMC Sweep Fvg MT5 — piyasayı smart money gibi görün, doğrudan grafiğinizde O duyguyu bilirsiniz: fiyat stopunuzu alır, döner ve tam beklediğiniz yöne gider. Yön konusunda haklıydınız. Yanıldığınız tek şey girişti. Bu indikatör, bunun daha az yaşanması için var. Analizin en ağır kısmını — grafiği işaretlemeyi — üstlenir ve asıl önemli olanı size bırakır: kararı. Grafikte ne görürsünüz Piyasa yapısı — HH / HL / LH / LL etiketleri ve seviye çizgileriyle gerçek yapısal tepeler ve dipler. Trend a
Gold Xausd Hunter
Metin Erkamoglu
5 (2)
MATADOR GOLD XAUUSD M5 Scalp Signals for MT5 MATADOR GOLD is a decision-support indicator for MetaTrader 5, designed for traders who analyze short-term Gold movement on the M5 timeframe. The indicator does not open, close, or manage trades automatically. It provides buy and sell signal guidance so the user can make their own trading decisions according to their risk plan, broker conditions, and trade management rules. Main purpose MATADOR GOLD is built to help traders avoid noisy signal flow and
==================================================================== SMC Pro v6.1 APEX AI — XAUUSD Gold Empire MetaTrader 5 Göstergesi · Smart Money Concepts · Öngörücü Zekâ Motoru ==================================================================== SMC Pro v6.1 APEX AI, MetaTrader 5 üzerinde yalnızca XAUUSD (altın) için geliştirilmiş profesyonel bir Smart Money Concepts gösterge sistemidir. Tam SMC çerçevesini — Order Blocks, Liquidity sweeps (likidite süpürmeleri), Fair Value Gaps, Break of
PrimeScalping
Temirlan Kdyrkhan
PrimeScalping is a powerful trading companion designed to generate high-probability entry signals with dynamic TP/SL/DP levels based on volatility. Built-in performance tracking shows win/loss stats, PP1/PP2 hits, and success rates — all updated live. Key Features: Buy/Sell signals with adaptive volatility bands Real-time TP/SL/DP levels based on ATR Built-in MA Filter with optional ATR/StdDev volatility Performance stats panel (Success, Profit/Loss, PP1/PP2) Alerts via popup, sound, push, or e
Elliott Wave Engine The Auto Elliott Engine is a tool designed for MetaTrader 5 that automates the identification, decomposition, and projection of price structures based on the Elliott Wave Theory. Powered by a pattern-recognition engine, this indicator processes price action to identify market configurations, translating data into structured scenarios. Key Features Multi-Degree Recognition: Analyzes price action across multiple fractal levels. From higher degrees, such as Supercycle or Cycle,
TraderHUD
Justino Porto Neto
5 (1)
TraderHUD v2 — Profesyonel Trader için Eksiksiz Pano TraderHUD v2 , MetaTrader 5 için en kapsamlı görsel göstergenin gelişmiş halidir. Bir trader'ın daha bilinçli kararlar almak için grafikte görmesi gereken her şeyi tek bir araçta birleştirir: zamansal bağlam, dolar gücü, istatistiksel aralık, pivot seviyeleri, hareket hızı ve makro trend — hepsi entegre, yapılandırılabilir ve grafiği kalabalıklaştırmadan. Bu sürüm, canlı işlemlerdeki gerçek kullanıma dayanarak geliştirildi ve net bir felsefe i
XCalper TFO
Aecio de Feo Flora Neto
This oscillator was developed exclusively by xCalper in 2015 based on moving averages calculations to indicate and try predicting oversold and overbought levels. The fast line (white, by default) oscillates basically between values -0.5 (oversold) and +0.5 (overbought). Whenever this line crosses upward value -0.5, it means an oversold price level. When it crosses downward value +0.5, it means an overbought price level. When fast line crosses value 0.0 and returns, it is a strong pull-back indic
Yazarın diğer ürünleri
is a versatile analytical tool designed for both advanced traders and beginners. It combines classic trend line analysis with automatic Fibonacci level plotting to deliver precise market entries and structural clarity. Built as an intuitive and clean on-screen dashboard, this indicator simplifies multi-timeframe analysis without cluttering your main workspace. Technical Analysis and Entry Points The indicator automates the most critical aspects of price action and structural trading: Trend L
Filtrele:
Değerlendirme yok
Değerlendirmeye yanıt