Visual ZZ ABC Pivot v2
- Indicadores
- Versão: 1.0
- Ativações: 5

Short Description
A professional visual indicator for MetaTrader 5 that combines market structure based on ZigZag, ABC(D) patterns, Fibonacci levels, daily Pivots, and automatic trendline breakout detection across 6 timeframes. The indicator does not trade; it provides ready-to-use visual signals for your trading decisions.
🎯 Key Features
1. ZigZag Structure (Depth 7)
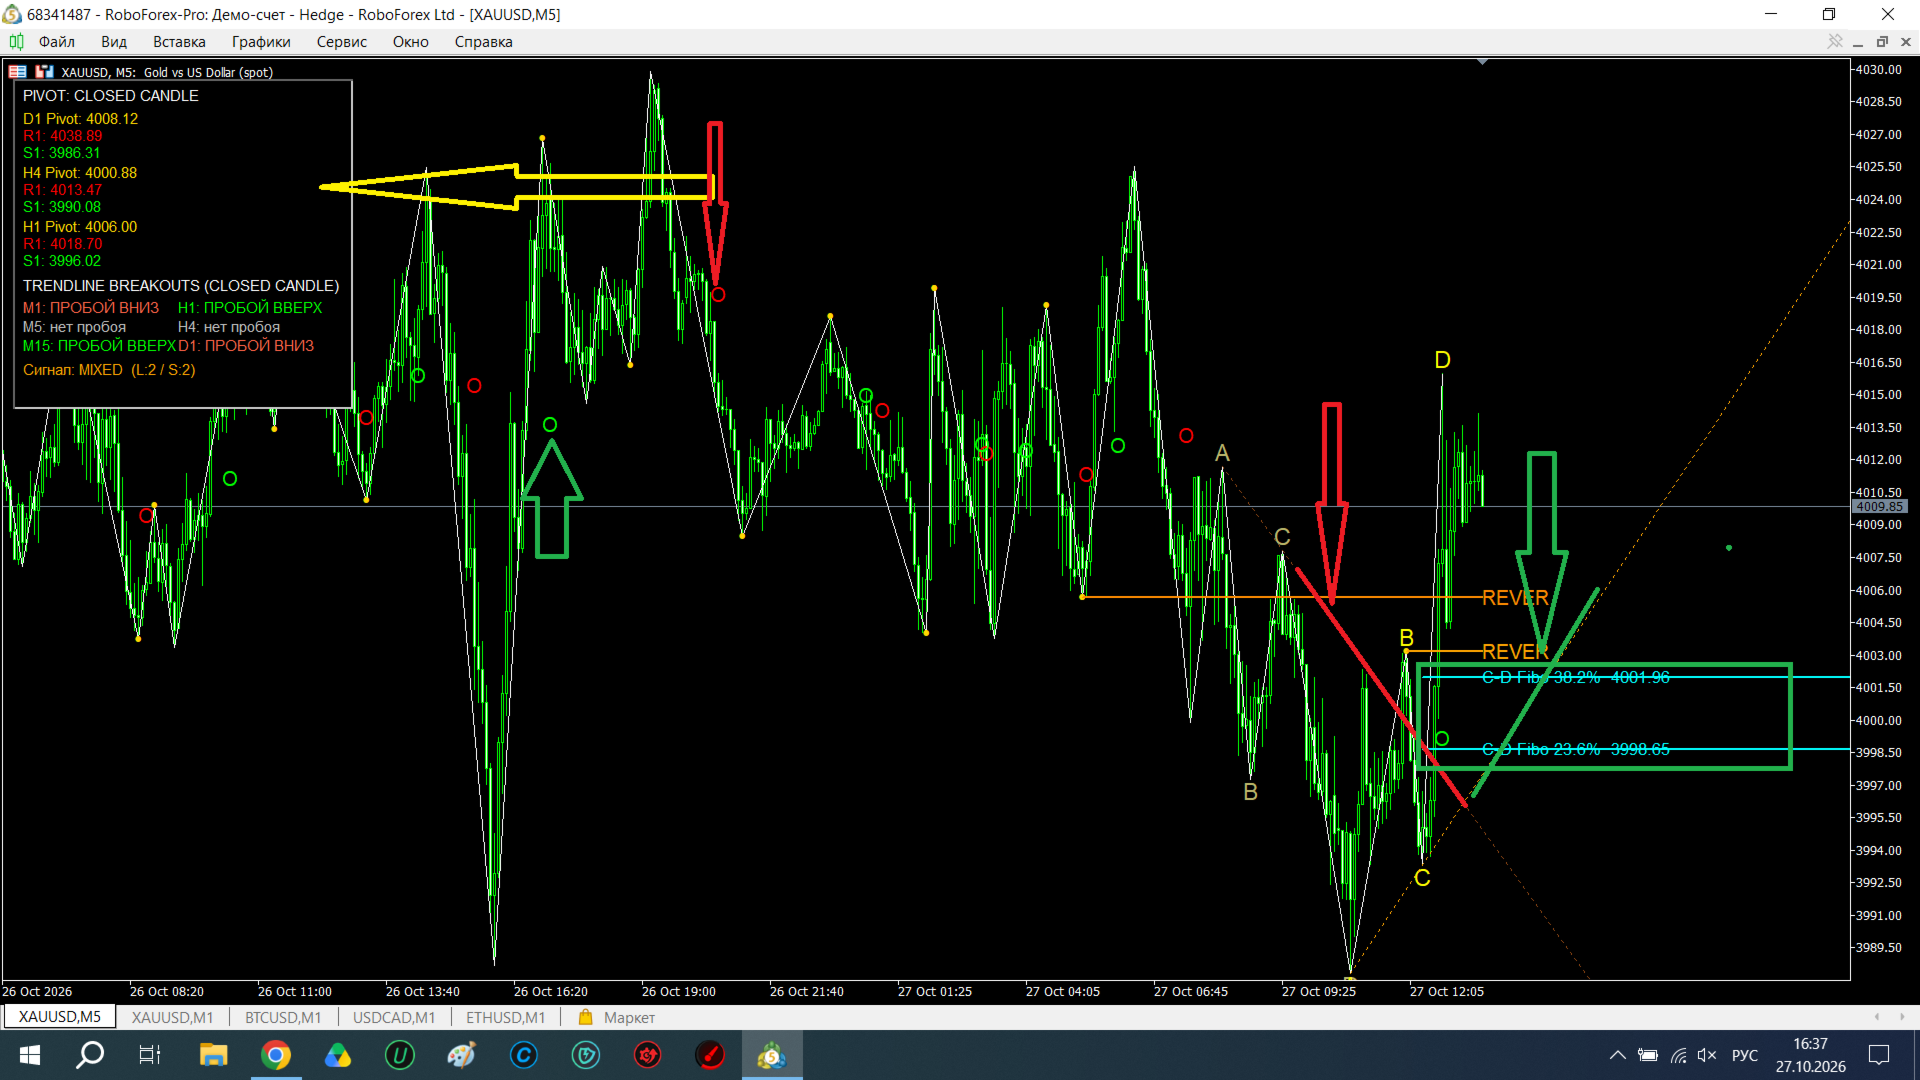
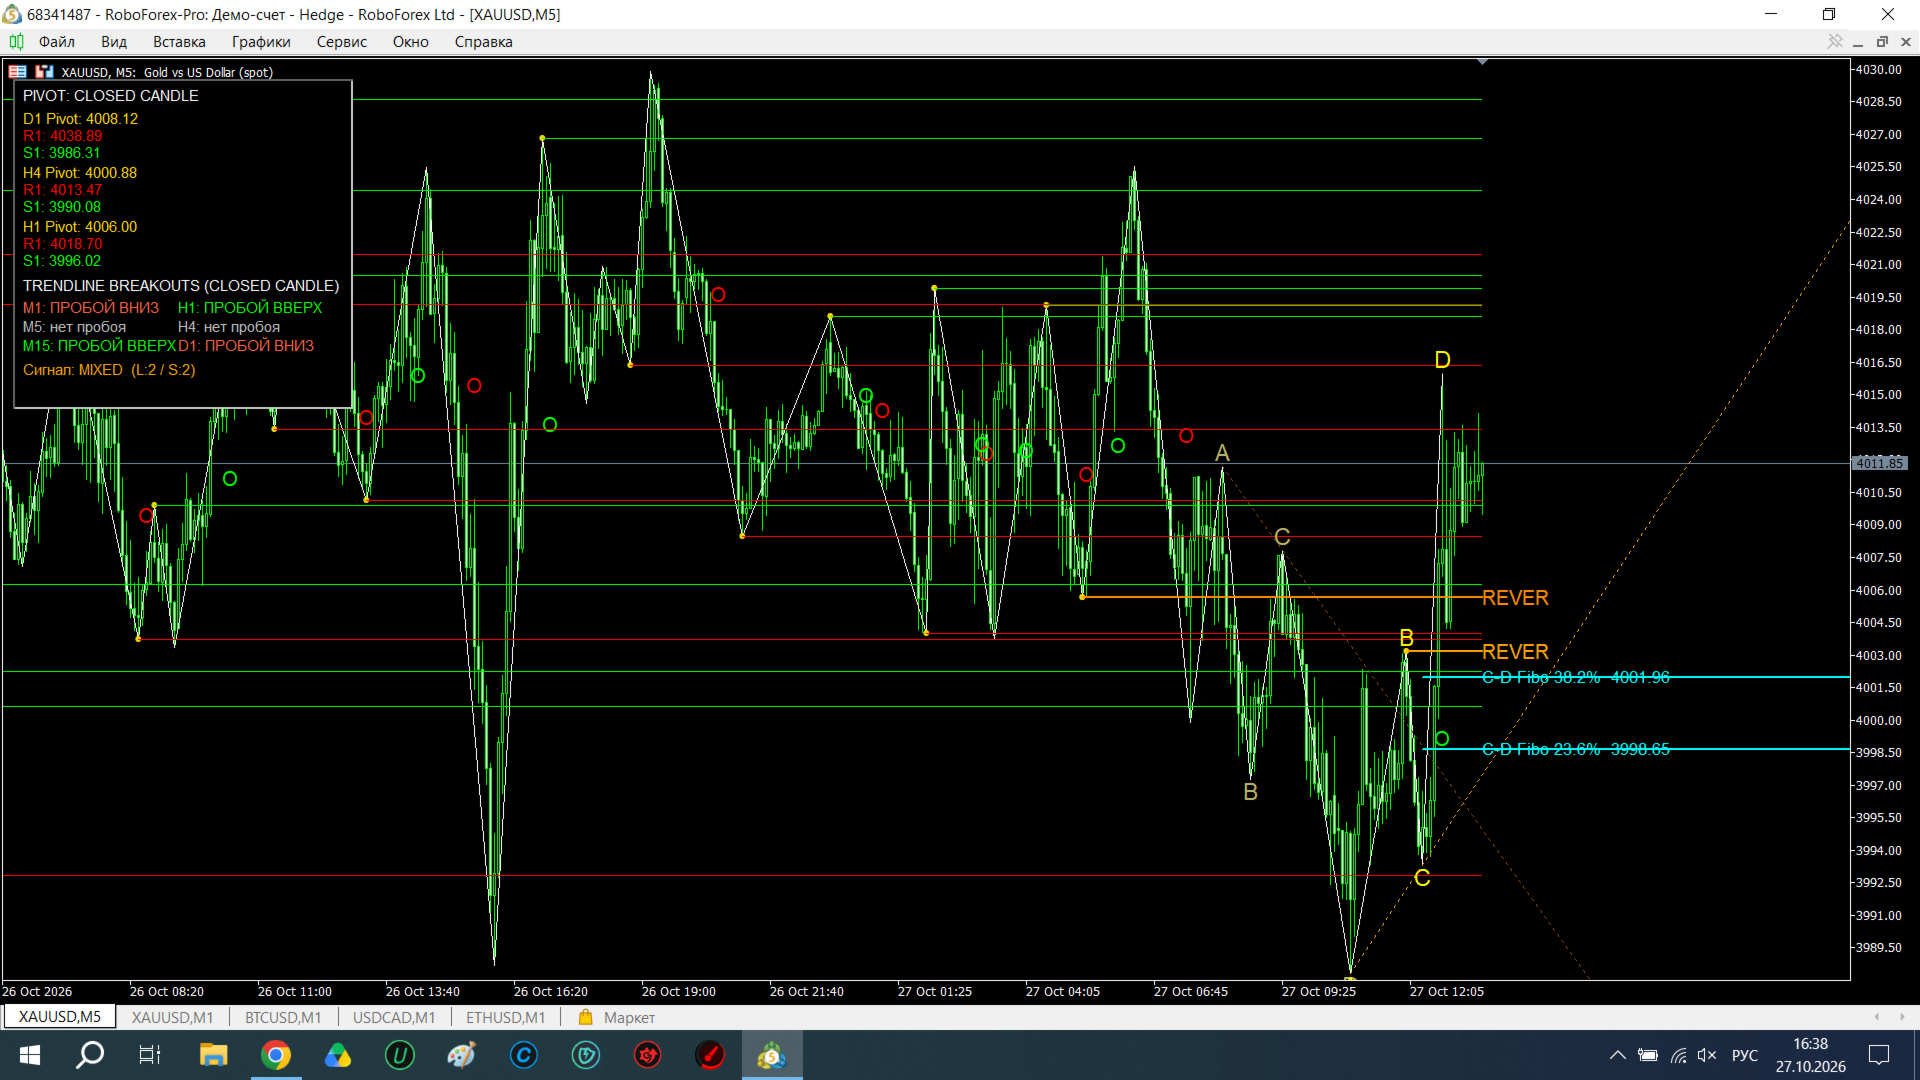
The indicator automatically identifies local highs and lows (Depth=7, Deviation=5) and connects them with white lines. This is the foundational market structure upon which all subsequent signals are built.
2. ABC(D) Pattern — Two Formations
The indicator searches for classic wave structures:
-
Ascending: A(Low) → B(High) → C(Low) → D(High), where C > A and D > B.
-
Descending: A(High) → B(Low) → C(High) → D(Low), where C < A and D < B.
Two most recent formations are displayed on the chart:
-
Current (bright): yellow letters A, B, C, D + orange A-C line.
-
Previous (faded): dark yellow letters + brown A-C line.
3. Fibonacci C-D (23.6% and 38.2% Levels)
Based on the latest ABCD formation, the indicator automatically plots Fibonacci levels from point C (0%) to point D (100%):
-
23.6% — the first correction level.
-
38.2% — the second correction level.
These levels (turquoise lines) help identify potential pullback zones after an impulse.
4. REVER Levels (Two Formations)
For each MA14/MA50 crossover, the indicator finds the nearest significant ZigZag extremum and builds a horizontal level from it. The chart displays:
-
Current level (bright orange): dash-dot line labeled "REVER".
-
Previous level (faded): for comparison and history.
5. MA14/MA50 Crossover Signals
-
Red circle ("O") — MA14 crossed MA50 downwards (bearish signal).
-
Green circle ("O") — MA14 crossed MA50 upwards (bullish signal).
6. Pivot Panel (D1, H4, H1)
A panel in the upper right corner displays the following levels:
-
P (Pivot) — yellow.
-
R1 (Resistance) — red.
-
S1 (Support) — green.
Pivots are calculated based on the last closed candle of the respective timeframe (D1, H4, H1), which eliminates repainting and false signals.
7. Trendline Breakouts across 6 Timeframes
The panel automatically analyzes A-C line breakouts across six timeframes (M1, M5, M15, H1, H4, D1):
-
BREAKOUT UP (green) — price closed above the descending A-C line.
-
BREAKOUT DOWN (red) — price closed below the ascending A-C line.
-
no breakout (gray) — no breakout detected.
An overall signal is displayed at the bottom of the panel:
-
LONG — breakouts upward only.
-
SHORT — breakouts downward only.
-
MIXED — conflicting signals.
-
NONE — no breakouts.
⚙️ Settings
| Parameter | Description |
|---|---|
| InpFastMA / InpSlowMA | Fast (14) and slow (50) MA periods. |
| LookbackBars | Number of bars to analyze (1000). |
| ZZDepth / ZZDeviation | ZigZag parameters (7 / 5). |
| Colors | Full customization of colors for ZigZag, circles, letters, lines, REVER, and Fibonacci. |
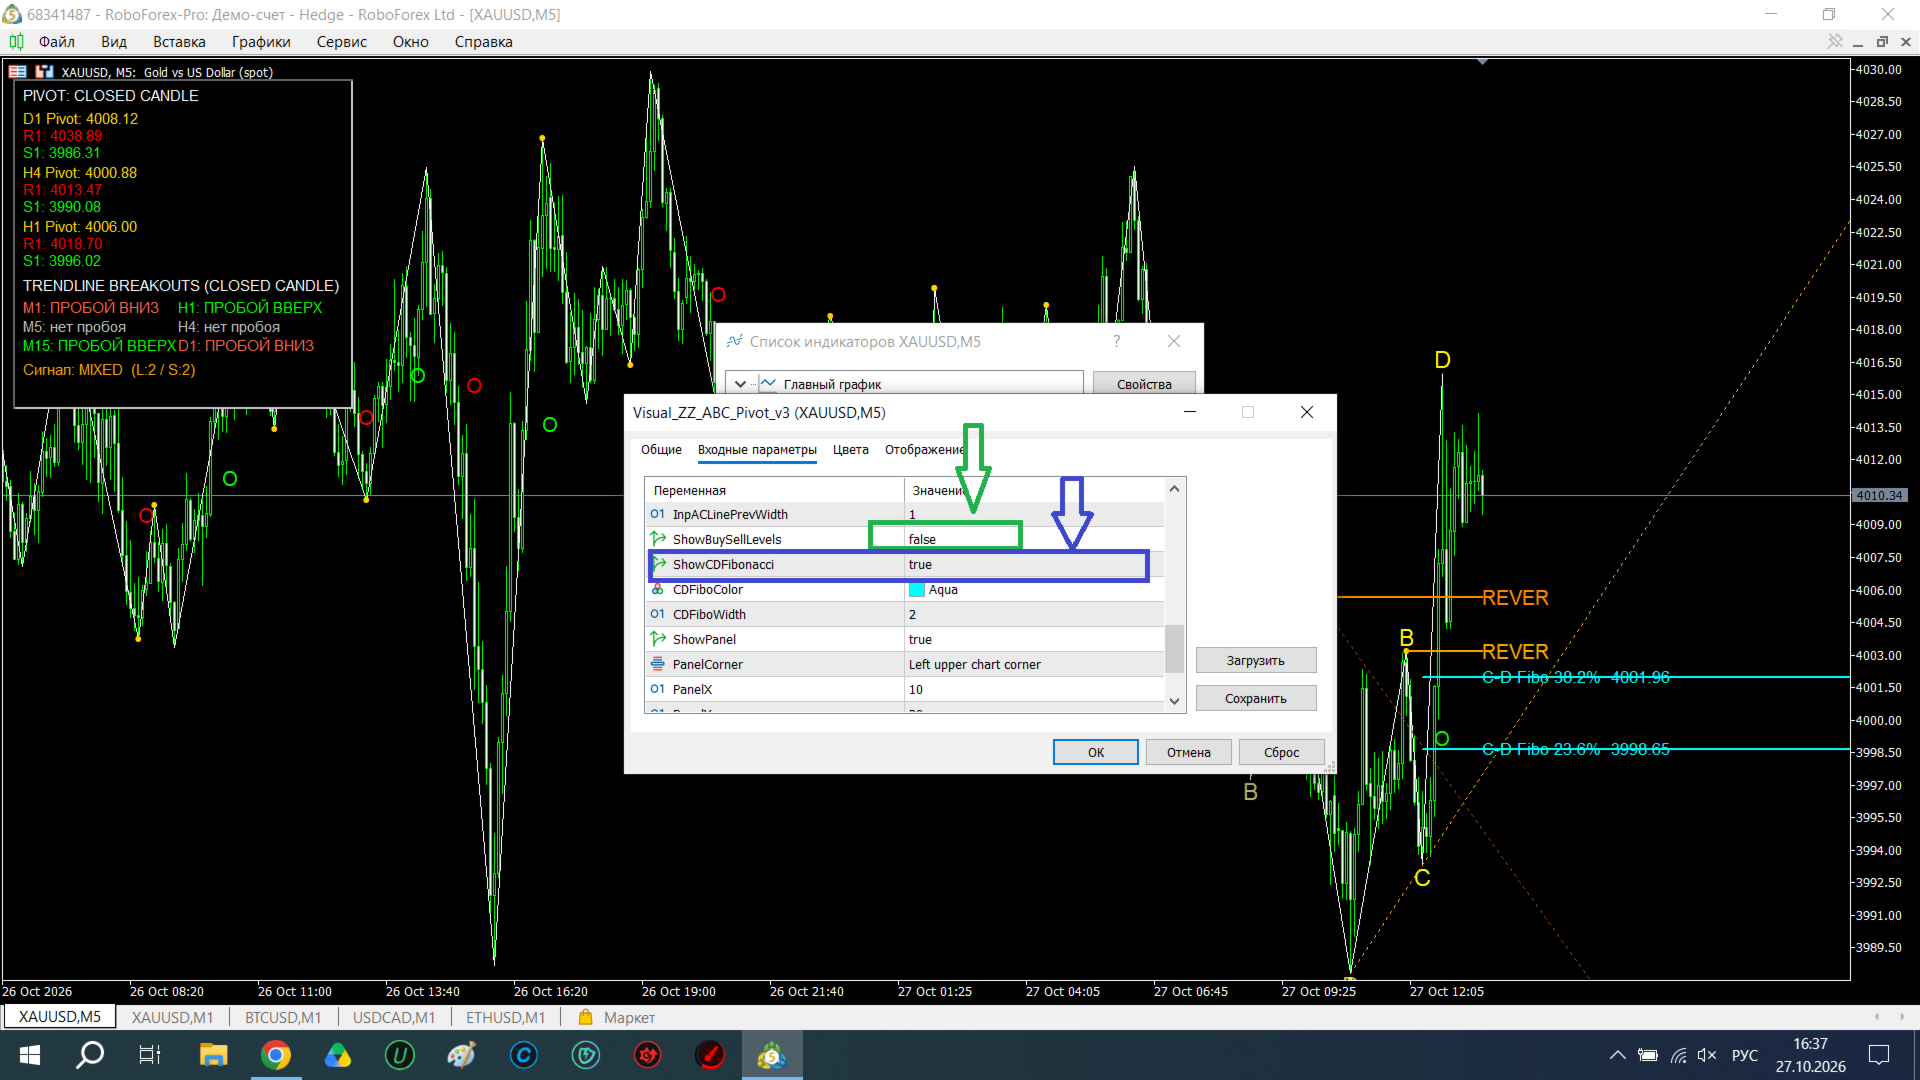
| ShowBuySellLevels | Enable/disable horizontal Buy/Sell levels. |
| ShowCDFibonacci | Enable/disable C-D Fibonacci levels. |
| ShowPanel | Show/hide the panel. |
| PanelCorner | Panel placement corner (default: upper left). |
💡 How to Use
-
Identify the trend using the Pivot panel and trendline breakouts.
-
Wait for a signal on the MA14/MA50 crossover (circle).
-
Check the ABCD structure — is there a current formation?
-
Use REVER levels as entry points (pullback to the extremum).
-
Fibonacci C-D — for identifying correction zones.
-
Breakout panel — for trend confirmation on higher timeframes.
🚀 Advantages
-
Multi-timeframe analysis — 6 timeframes simultaneously.
-
Two formations — see both current and previous structure.
-
Automatic Pivots — based on closed candles, no repainting.
-
Fibonacci C-D — a unique feature not found in standard indicators.
-
Clean visuals — no unnecessary objects, only essential signals.
-
No trading — analysis only; you control every trade.
🎨 Recommended Timeframes
-
M1–M5 — for scalping (use M1/M5 breakouts).
-
M15–H1 — for intraday trading (primary focus).
-
H4–D1 — for medium-term analysis.
⚠️ Important
The indicator does not provide guaranteed signals and is not a trading strategy. Use it as an analysis tool in combination with your own trading system and risk management.