Trend Zone Candles MT5
- Göstergeler
-
Shashikant Jawahar Dhuri
 Shashikant Dhuri — Hindistan
8 yıldır al-sat işlemleri (trading) yapıyorum ve son 5 yıldır bu işi tam zamanlı olarak sürdürüyorum.
Al-sat işlemleri yapmak ve bu alana yönelik araçlar geliştirmek benim tutkumdur. MQL4, MQL5 ve Pine Script dillerinde geliştirme yapıyorum. - Sürüm: 1.1
- Etkinleştirmeler: 18
TREND ZONE CANDLES - MT5
OVERVIEW
Trend Zone Candles colours each candle according to the alignment of a
multi-layer trend model, and marks the points where that alignment changes.
Why colour the candles instead of drawing lines or crossover or oscillators etc ?
Because a lines or oscillators has to be read, and a colour is simply seen. Crossovers or levels require the eye to find them, compare them, and interpret them.
A coloured candle removes that step — the moment the bar closes, the state of the market is already on the screen. Nothing to search for, nothing to second-guess.
The indicator provides four things:
- Colour-coded candles showing the current trend state
- Non-repainting entry and exit text labels
- Re-entry arrows during pullbacks inside an established trend
- A three-timeframe status panel for additional confirmation
All candle colours, labels and arrows are calculated on fully closed bars only.
Once printed, a signal does not move, shift position or change colour. The
higher-timeframe panel is also non-repainting when left on its default Closed
bar setting.
SUGGESTED USE BY TIMEFRAME
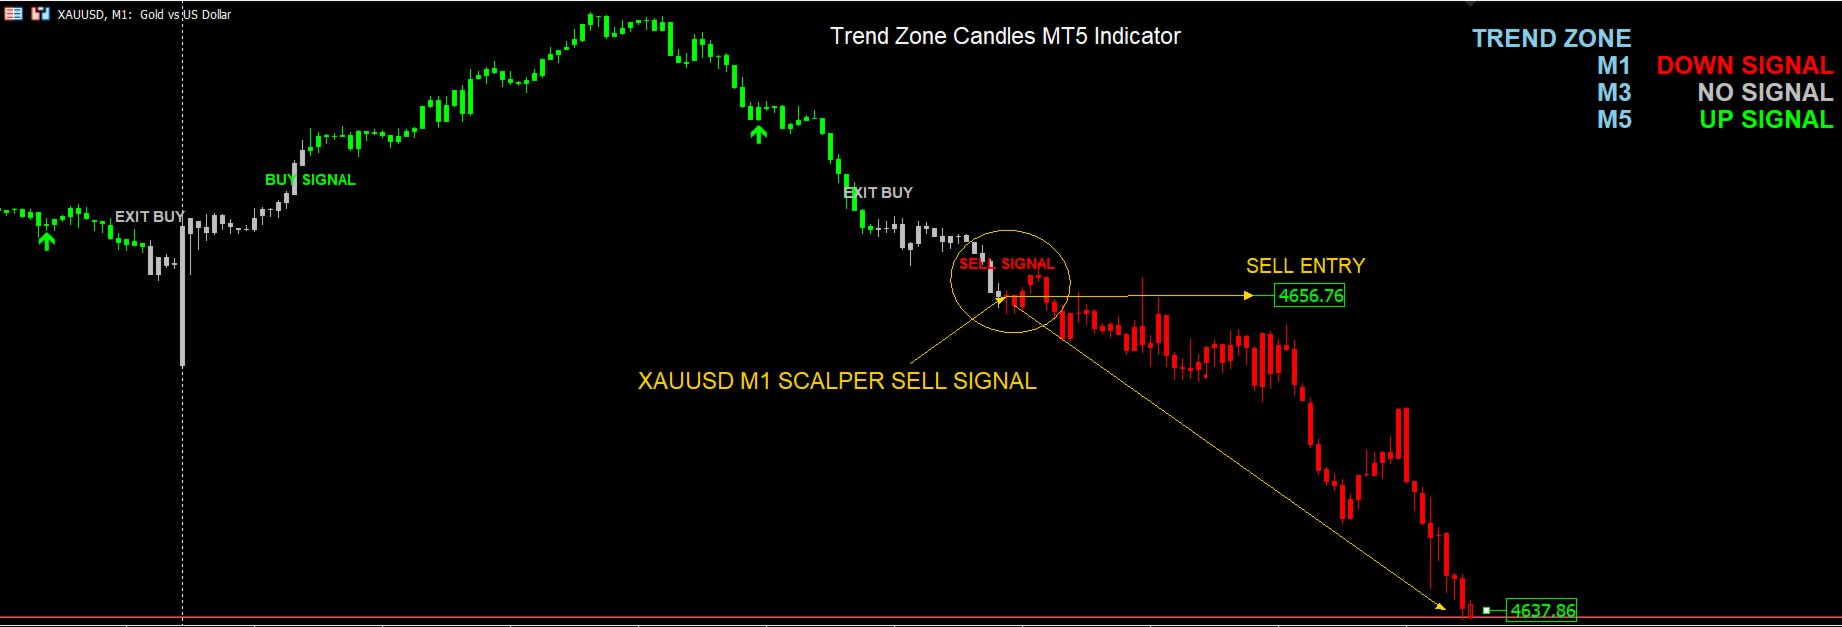
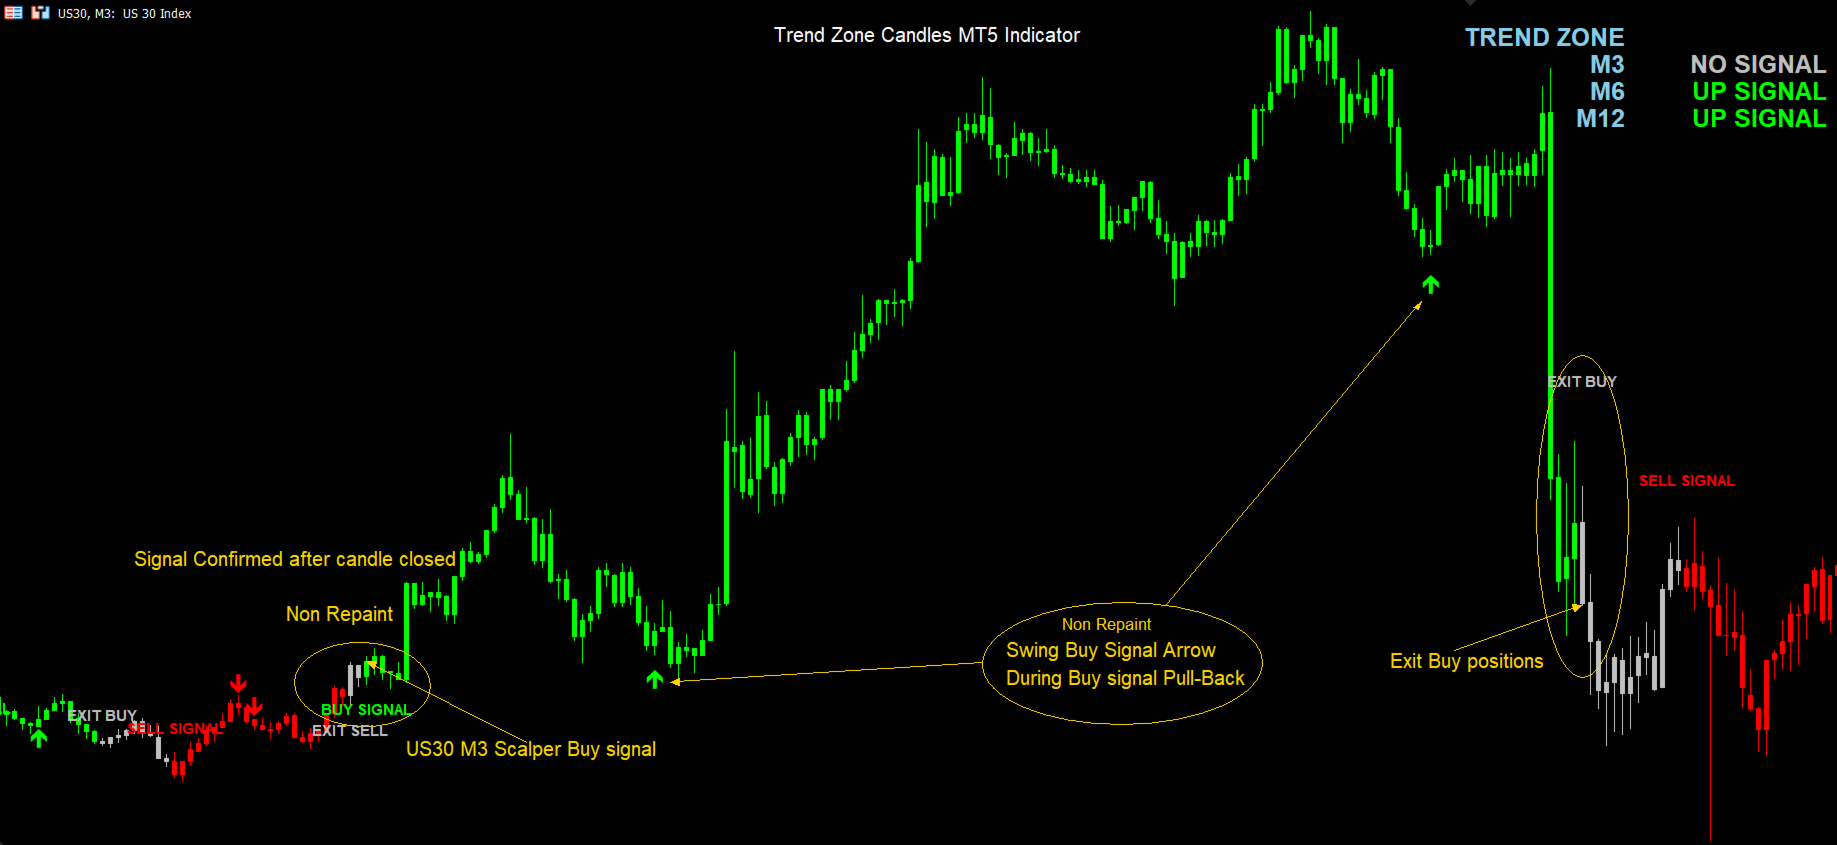
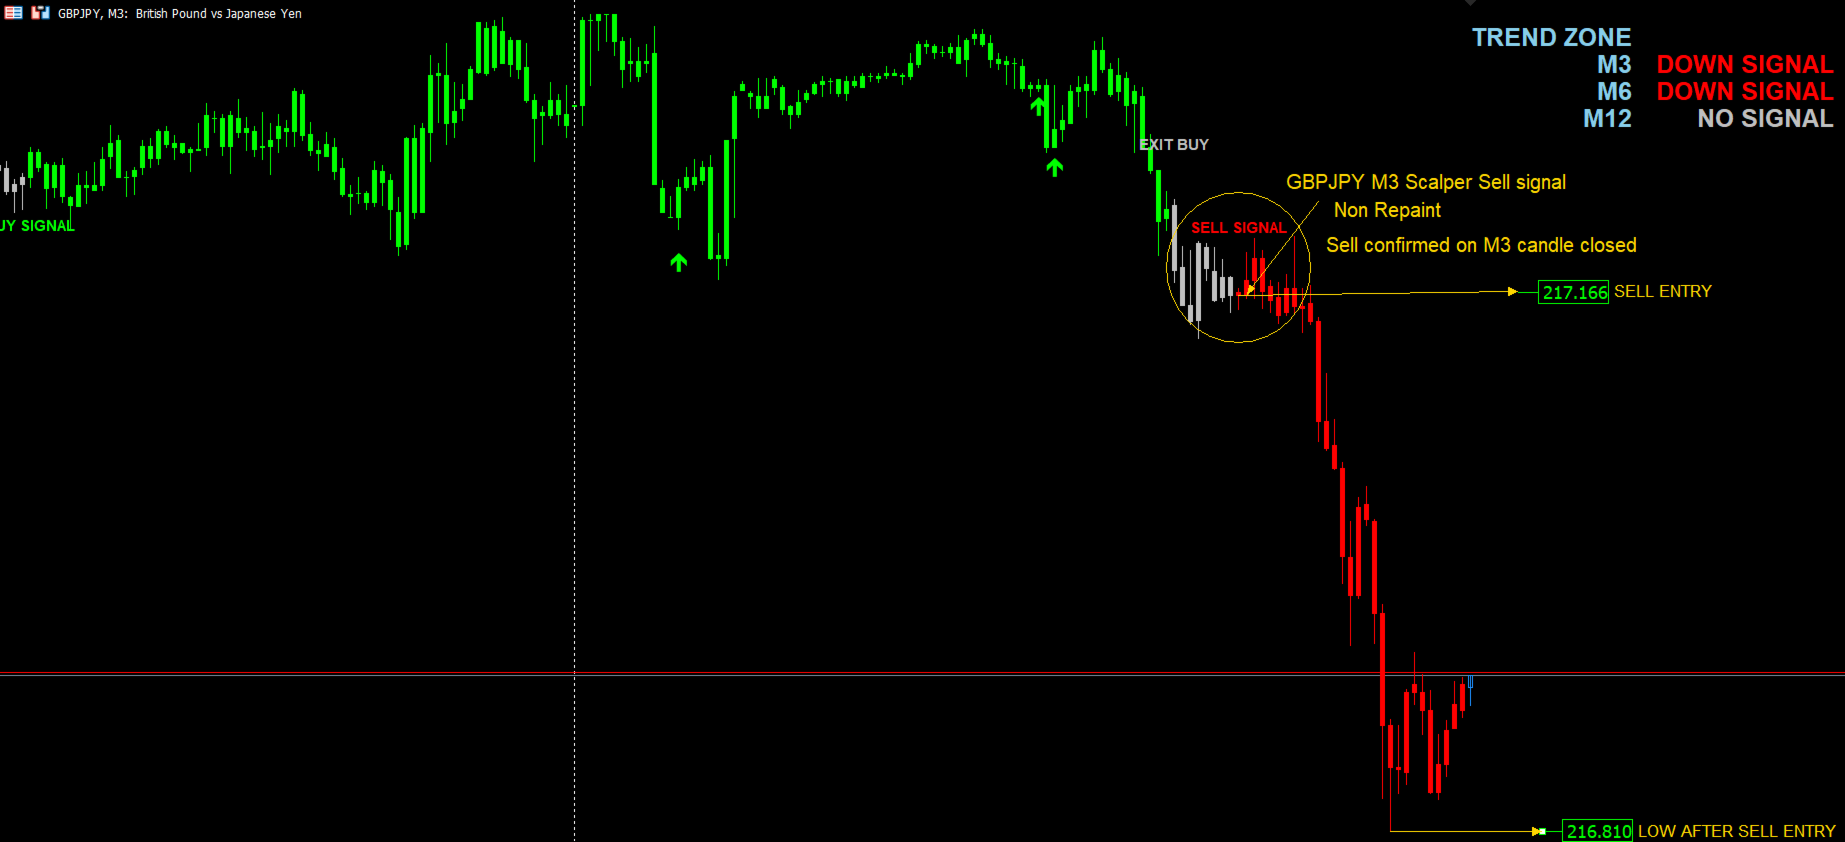
- M1 and M3 - scalping signals
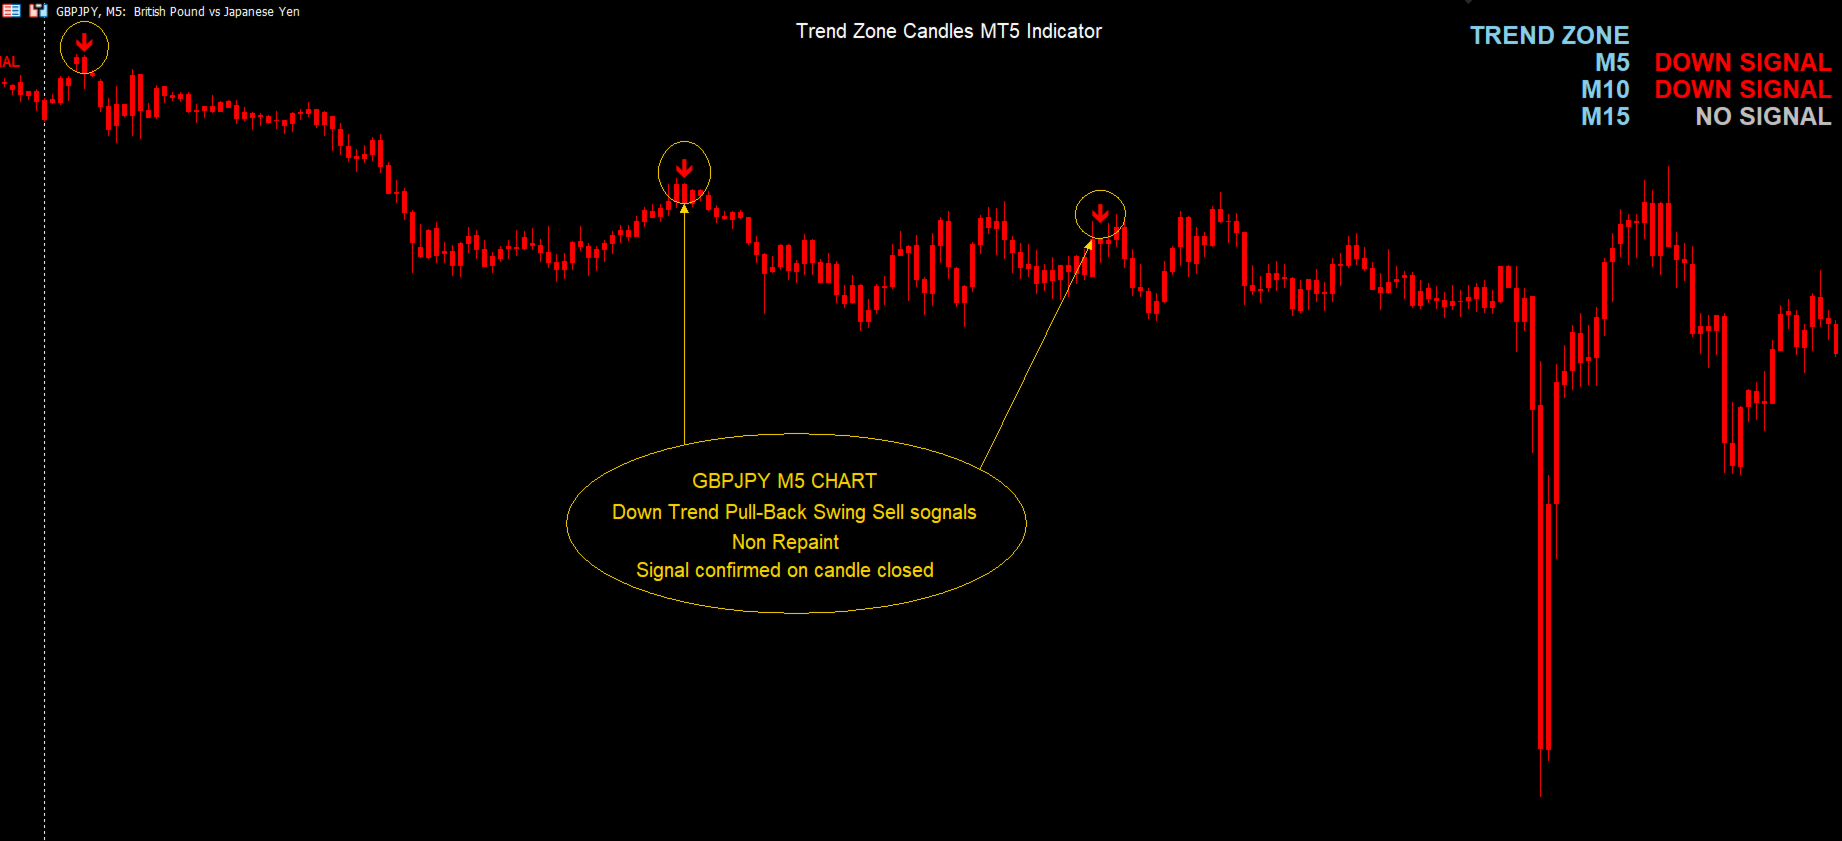
- M5, M10 and M15 - intraday swing signals
- H1 and H4 - broader trend context
The higher-timeframe panel lets you check the state of three other timeframes
without leaving your working chart.
READING THE CHART
Uptrend - candles turn lime. The first lime candle after a red or silver candle
prints a BUY SIGNAL label.
On M1 or M2 OR M3 tf chart this is scalping buy entry
Downtrend - candles turn red. The first red candle after a lime or silver candle
prints a SELL SIGNAL label.
On M1 or M2 OR M3 tf chart this is scalping sell entry
No trend - candles turn silver. The first silver candle after a lime run prints
EXIT BUY and this is SL or Exit of buy positions; and
first silver candle after a red run it prints EXIT SELL and this is SL or Exit of sell positions.
Re-entry arrows - during an current established uptrend, a lime up arrow marks a bar
where price pulled back and then closed back inside the trend zone. A red down
arrow marks the mirror condition in a downtrend. Arrows are spaced apart so that
a single pullback does not produce a cluster of overlapping signals.
Arrows are supplementary markers within an existing trend. They do not start a
new trend and do not replace the entry and exit labels.
RISK NOTE
No indicator predicts future price movement. Trend Zone Candles describes the
current state of the market as calculated from closed price data. Use your own
risk management rules, position sizing and stop placement, and test the
indicator on a demo account before trading it live.
================================================================
INPUT REFERENCE
================================================================
TREND CANDLE COLOURS
Paint trend candles - default true
When true, candles are recoloured lime, red or silver according to the trend
state. When false, candles are left as your broker or chart template draws them,
and only the arrows, labels and panel are shown.
Uptrend candle colour - default Lime
Downtrend candle colour - default Red
Neutral candle colour - default Silver
These three colours are also used for the matching text labels and arrows, so
changing one changes the whole colour scheme for that state.
CHART APPEARANCE
Original bar handling - default "Hollow live bar, solid closed bars"
Hollow live bar, solid closed bars - closed candles are painted solid in the
trend colour, while the current forming candle is shown as a hollow outline in
blue (bullish) or red (bearish). This makes it immediately obvious which bar
has not yet closed and therefore carries no confirmed signal. Once the bar
closes it converts to the solid trend colour.
Do not change the chart - the indicator does not restyle the price bars at
all. Your normal chart candles are shown for every bar, including the forming
one.
This setting only takes effect when Paint trend candles is true. With painting
switched off there is nothing for the hollow bar to contrast against, so the
indicator automatically shows normal bars.
Live bar - bullish outline - default Dodger Blue
Live bar - bearish outline - default Red
Outline colours used for the forming candle in hollow mode.
Override chart background and grid - default true
When true, the indicator applies the background, foreground and grid colours
below. When false, your existing chart colours are left untouched. Either way,
all chart colours are saved on attach and restored when the indicator is
removed.
Background colour - default Black
Foreground / axis colour - default White
Show chart grid - default false
Grid colour - default dark grey
Set these to your preference. Grid visibility is controlled by Show chart grid
independently of the grid colour.
RE-ENTRY ARROWS
Show re-entry arrows - default true
Turns the pullback arrows on or off.
Arrow Sensitivity (1 = most, 10 = fewest) - default 5
Controls how many re-entry arrows are printed within a single trend leg. Lower
values produce more arrows; higher values produce fewer and more widely
separated ones. Values of 5 or 6 suit most instruments. The setting adapts
automatically to each symbol's volatility, so the same value behaves
consistently across currency pairs, metals, indices and crypto.
Arrow Gap From Candle (1-10) - default 5
Distance between the arrow and the candle it refers to. Lower values place the
arrow closer to the candle, higher values move it further away. This affects
appearance only and has no effect on the signals themselves.
Up arrow wingding code - default 233
Down arrow wingding code - default 234
Wingdings character codes used to draw the arrows. Change only if you prefer a
different arrow shape.
SIGNAL LABELS
Show text labels - default true
Turns the BUY SIGNAL, EXIT BUY, SELL SIGNAL and EXIT SELL labels on or off.
Label font size - default 9
Label font name - default Arial Bold
Max labels kept on chart - default 45
The number of most recent labels retained on the chart. Older labels are removed
automatically to limit the number of chart objects and keep the terminal
responsive. Raising this substantially on a long M1 history can slow the chart.
Removing an old label does not affect any signal still visible on screen.
HIGHER TIMEFRAME PANEL
Show HTF panel - default true
Panel source bar - default "Closed bar (non-repaint)"
Closed bar - the panel updates only when the selected higher timeframe candle
closes. On an M1 chart with M5 selected, the M5 row changes at 10:05, 10:10,
10:15 and so on, holding its previous reading in between. Nothing repaints.
Live bar - the panel reflects the higher timeframe's currently forming candle
and can change several times before that candle closes.
Panel timeframe 1 / 2 / 3 - defaults M1, M3, M5
The three timeframes shown in the panel. Any timeframe from M1 to D1 can be
selected, and the panel works from any chart timeframe.
Each row shows UP SIGNAL in the uptrend colour, DOWN SIGNAL in the downtrend
colour, or NO SIGNAL in the neutral colour. "Loading..." appears briefly while
the terminal downloads history for a timeframe that has not been opened before.
Panel font size - default 15
Panel timeframe colour - default Sky Blue
Panel corner - default upper right
Panel X offset / Panel Y offset - defaults 12 and 22
Position the panel wherever it suits your layout. The panel lays itself out
correctly in all four chart corners.
NOTIFICATIONS
Master alert switch - default true
Turns all notifications on or off. When false, none of the settings below have
any effect.
Popup message - default true
Sound - default true
Sound file - default alert.wav
Push notification - default false
Requires your MetaQuotes ID to be entered under Tools - Options - Notifications.
Email notification - default false
Requires SMTP details to be configured under Tools - Options - Email.
Also alert on re-entry arrows - default false
By default, alerts fire only on the four entry and exit labels. Enable this to
receive an alert on every re-entry arrow as well. Suitable for active intraday
trading; leave it off if you only want trend change notifications.
Alerts fire once per closed bar. No alerts are generated while the indicator
loads its initial history.
PERFORMANCE
Max bars to calculate (0 = all) - default 5000
Limits how far back the indicator calculates. The default suits all timeframes
and keeps loading fast. Setting 0 calculates the entire available history and may
slow the chart noticeably on M1.
================================================================
FOR EA DEVELOPERS
================================================================
All signal data is exposed through indicator buffers and can be read from an
Expert Advisor with iCustom and CopyBuffer.
Buffer 0-3 Candle open, high, low, close
Buffer 4 Candle colour index: 0 uptrend, 1 downtrend, 2 neutral
Buffer 5 Buy re-entry arrow price, or EMPTY_VALUE
Buffer 6 Sell re-entry arrow price, or EMPTY_VALUE
Buffer 7 Trend state: +1 up, -1 down, 0 neutral
Buffer 8 Signal event: 1 buy, 2 exit buy, -1 sell, -2 exit sell, 0 none
Buffer 9 Buy arrow grade: 1 shallow pullback, 2 deep pullback, 0 none
Buffer 10 Sell arrow grade: 1 shallow pullback, 2 deep pullback, 0 none
Buffer 8 alone carries the complete entry and exit signal stream, so a single
CopyBuffer call is enough to drive an EA.
Important: read shift 1, not shift 0. The current forming bar carries no
confirmed signal, so at shift 0 the arrow buffers hold EMPTY_VALUE and the trend,
event and grade buffers hold 0. Values become final only once a bar has fully
closed.
Happy trading.