Malik Naveed Volume Multi Timeframe Pro

Malik Naveed Volume — Better Volume Multi Timeframe

Malik Naveed Volume shows you what the volume is really doing. It reads each candle's
volume and price range, splits it into buying vs selling pressure, and colours the bars so
you can instantly see climax moves, absorption (churn), and low-volume exhaustion. It then
draws support/resistance levels from those key bars and alerts you when price breaks and
retests them — across six timeframes at once, on any symbol.

Works on ANY symbol and ANY timeframe. Non-repainting on closed bars.

=====================  WHAT IT DOES  =====================

- Colour-codes every candle by its volume signature:
   Red     = Volume Climax Up  (heavy buying)
   White   = Volume Climax Down (heavy selling)
   Orange  = High Churn at a TOP  (distribution — possible reversal down)
   Green   = High Churn at a BOTTOM (accumulation — possible reversal up)
   Yellow  = Low Volume (no interest / exhaustion)
   Blue    = Neutral
- Splits volume into BUYING and SELLING pressure using the original Better Volume method,
  so climax up/down is accurate (not just "close above midpoint").
- Knows the difference between churn at a TOP and churn at a BOTTOM — the same volume
  signature means opposite things depending on where it happens.

=====================  KEY FEATURES  =====================

- Auto Support/Resistance levels drawn from low-volume and churn bars.
- BREAK detection: alerts when price CLOSES through a level (with a candle-strength filter).
- First-RETEST alert: the highest-quality entry — when price comes back to the broken level.
- 6-timeframe dashboard (M5, M15, H1, H4, D1, W1) showing BUY / SELL / waiting on each.
- Big, colour-coded dashboard that is easy to read at a glance.
- Feed Quality meter: shows average tick volume and history depth so you can compare brokers.
- Loud alerts: pop-up, sound, and phone push notification.
- Fully adjustable colours, fonts, panel size and position.

=====================  HOW TO USE  =====================

1. Attach it to any chart (M5 is a good default).
2. Watch the coloured candles/bars for climax, churn and low-volume signals.
3. Trade the break and retest of the drawn levels, in the direction the dashboard confirms.
4. Turn on alerts to be notified the moment a signal happens.

This is an analysis tool. It does not place trades and does not promise profit.
Use it with your own risk management.

=====================  INPUTS  =====================

CALCULATION
- LookBack (20) — how many bars back to measure climax, churn and low volume.
- SwingLen (8) — bars each side used to decide if a churn bar is at a swing high or low.
- ScanBack (60) — how far back the dashboard looks for the last churn on each timeframe.

DISPLAY
- OnlyChurn (false) — MT5 only: paint ONLY the churn candles, dim the rest.
- ShowDashboard (true) — show the multi-timeframe dashboard panel.
- BrandName ("MALIK NAVEED VOLUME") — title shown on the panel.
- FontSize (14) — dashboard text size (raise for larger text).
- FontName ("Arial Black") — dashboard font.
- PanelX (12) / PanelY (22) — panel position from the top-left corner, in pixels.
- PanelWidth (440) — panel width in pixels.

AUTO LEVELS
- DrawLevels (true) — draw support/resistance lines from key bars.
- UseYellow (true) — low-volume bars create levels.
- UseChurn (true) — churn bars create levels.
- AlertMode (1) — 0 = alert on retest only, 1 = alert on break AND retest.
- BreakBodyPct (0.5) — a break candle's body must be at least this fraction of its range
  (0.5 = 50%). Set 0 to switch the filter off; raise for stronger breaks only.
- MaxLevels (30) — how many active level lines to keep on the chart.
- LevelBars (1500) — how many bars back to scan for levels (MT5).
- ResColor (OrangeRed) — colour of resistance lines.
- SupColor (Lime) — colour of support lines.

ALERTS
- ConfirmAlerts (true) — show a pop-up alert on a confirmed signal.
- IntrabarWarn (true) — early warning the moment price pierces a level (before candle close).
- PlaySoundAlert (true) — play a sound on alerts.
- AlertSound ("alert2.wav") — sound file for confirmed signals.
- WarnSound ("tick.wav") — softer sound for the early pierce warning.
- PushNotify (false) — send a push notification to the MetaTrader mobile app
  (set your MetaQuotes ID in Tools > Options > Notifications).
Önerilen ürünler
VWAP Band Fills with Anchored VWAP MT4, TradingView'ın VWAP'ını MetaTrader 4'e taşır. TradingView'ın yerleşik "VWAP" göstergesini kullanıyorsanız burada aynı girdileri (Anchor Period, Source, Offset, Bands Calculation Mode, Bands Multiplier #1 to #3, Hide VWAP on 1D or Above), aynı formülü (Pine ta.vwap) ve aynı renkleri bulursunuz - ayrıca dikey bir çizgiyi sürüklediğiniz yerden başlayan bir sabitlenmiş VWAP (Anchored VWAP) da vardır. FORMÜL Her sabitleme döneminde, çubuk çubuk: VWAP = sum(ka
FREE
Scalping Edge Pro
Saqr Mohammad Yousef Almasarweh
Scalping Edge Pro Indicator Unleash the Power of Precision Trading: Introducing Scalping Edge Pro Tired of market noise and conflicting signals that cloud your judgment? Are you searching for a tool that delivers the clarity and confidence needed to seize rapid opportunities in volatile markets? Scalping Edge Pro is the engineered solution designed for traders who demand precision and professionalism in every trade. It is meticulously calibrated for peak performance on the 15-minute (M15) timef
FREE
Индикатор реализован для определения классического канала движения цены, который используется на крупных биржевых площадках. Не перерисовывается Синий уровень - это уровень поддержки  Красный уровень - это уровень сопротивления  Белый уровень - является Pivot-уровнем  Настройки Period_SEC  - ввод  значения периода . Примечание:  Индикатор определяет уровни только на пятизначных котировках! Метод торговли:  Открытие позиций осуществляется от уровней , именно на их значениях происходит отскок цены
FREE
Volume By Color RSJ, işlem hacmi kendi hareketli ortalamasının üzerinde olduğunda hacim çubuğunu daha koyu renge boyar; böylece olağan dışı aktiviteye sahip mumlar öne çıkar. İsteğe bağlı dört renkli mod, her mumun hacim gücünü kademeli olarak gösterir. Varsayılan olarak gösterge her çubuğu hacmin 20 periyotluk basit ortalamasıyla karşılaştırır. Ortalama türü ve periyodu girdilerden değiştirilebilir. Nasıl kullanılır Renkli çubuklar, normalin üzerinde hacimle gerçekleşen kırılımları, retleri ve
FREE
FREE for the First 50 Users ================================================================   ShowKillZones v1.0   - Corrected NY AM end time from 11 to 10, and NY PM end time from 17 to 16 (adjusted to Kill Zone hours) [cite: 321, 326]   - Changed NY AM/PM labels to Kill Zone [cite: 321, 326] v1.0  -  User Manual [cite: 321] ================================================================ [Overview] This indicator displays ICT Kill Zones (session hours) on the chart as background zones an
FREE
The selective pin bar is designed to identify reversals. To use the selective pin bar effectively, traders typically look for Strong Rejection: The tail of the pin bar should extend significantly beyond the surrounding price action. It indicates that there was a sharp rejection of higher or lower prices during the trading period. A strong rejection suggests that the market sentiment may be changing.
FREE
MT Supply Demand
Issara Seeboonrueang
4 (4)
We provide indicators tailored to better meet your trading requirements.       >>  MT Magical  << MT Supply Demand : It is an indicator created to find supply and demand, which will be important support and resistance levels for the price.  Supply Zone   is a zone where the price has reached, it is often resisted. In other words, when the price reaches this zone, there will be more selling power to push the price back down. Demand Zone   is a zone where the price has reached, it is ofte
FREE
Reversal 2
Murodil Eminjonov
The "REVERSAL" indicator is a pointer indicator without redrawing and delay. The "REVERSAL" indicator shows the best trend entry points on the chart. It is better to use it in tandem with other trend indicators as a filter. The indicator shows good results on all timeframes. The signal is generated after the candle closes and appears as blue and red arrows. If you reduce the amplitude, then you can trade in the style of scalping
FREE
Pivot Points Classic and Camarilla , Classic pivot seviyelerini (P, R1-R3, S1-S3) ve Camarilla seviyelerini (H1-H4, L1-L4) doğrudan grafik üzerine çizer. Seviyeler, seçtiğiniz zaman diliminin (varsayılan D1) önceki periyodunun High, Low ve Close değerlerinden hesaplanır ve her periyot, geçerli olduğu süre boyunca yatay bir çizgi olarak çizilir; böylece fiyatın önceki günlerde, haftalarda veya aylarda seviyelere nasıl tepki verdiğini görebilirsiniz. Özellikler Classic pivotlar - üç direnç (R1-R3)
FREE
Colored Candle Time
Saeed Hatam Mahmoudi
Candle Time (MT4) The Candle Time indicator shows the remaining time for the current candle on the active chart timeframe. It adapts automatically to the chart period and updates on every tick. This is a charting utility; it does not provide trading signals and does not guarantee any profit. Main functions Display the time remaining for the current candle on any timeframe (M1 to MN). Color-coded state: green when price is above the open (up), gray when unchanged, and red when below the open (do
FREE
VWAP bantları fiyatın nerede olduğunu söyler. Algorex VWAP Odds bunun geçmişte ne anlama geldiğini söyler. Gösterge mevcut çubuk için üç şeyi okur: New York’ta günün saati, seans VWAP’ına sigma cinsinden uzaklık ve tazelik, yani fiyatın VWAP’a son dokunuşundan bu yana geçen dakika. Tam olarak bu durum için panel şunları gösterir: 2 saat içinde VWAP’a dönüş (%) Seans bitmeden dönüş (%) Dönüşe kadar ortalama süre Heat: fiyatın genellikle önce ne kadar daha uzaklaştığı (ortalama ve %80 seviyesi) Ol
FREE
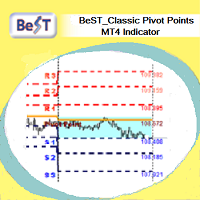
BeST_ Classic Pivot Points is an MT4 Indicator that is based on the widely known and definitely classic Pivot Point of a market prices activity. A pivot point is calculated as an average of significant prices (high,low,close) from the performance of a market in the prior trading period. If the market in the following period trades above the pivot point it is usually evaluated as a bullish sentiment, whereas trading below the pivot point is seen as bearish. A pivot point and the associated suppo
FREE
STRUCTURAL TREND LINES - MT4 Indicator Simple indicator that automatically draws trend lines based on market structure. Features: - 3 degrees of structure detection (short, medium, long term) - Configurable swing strength for each degree - Single color per degree for clean visualization - Adjustable number of lines per degree - Customizable colors and line widths How it works: The indicator identifies swing highs and lows based on the strength parameter, then connects these points to create t
FREE
Strong Hosoda Pro
Alessandro Michele Ventrella
*Strong Hosoda Pro - Versione M15 GRATUITA* Strong Hosoda Pro è un indicatore di tendenza e livelli basato sul metodo originale Ichimoku Hosoda. Questa è la versione GRATUITA, funzionante solo sul timeframe M15. È completamente funzionale per testare la strategia. *Caratteristiche principali:* - Chiare frecce di ACQUISTO/VENDITA con avviso Livelli dinamici di Take Profit  - Grafico pulito, nessuna rielaborazione dopo la chiusura della barra - Basato sulla logica di Tenkan, Kijun, Senkou Spa
FREE
Version History : Date Version Changes 6/20/2022 1.00 Initial release 6/21/2022  1.10 Add global variables for Minimum (SYMBOL_volume_min) and Maximum (SYMBOL_volume_max) History Volumes  Description : RedeeCash Volumes Indicator is the Volumes indicator that you have come to trust for market entry and exit with the added benefit of exposing key metrics as global variables. Including global variables in an indicator permits easier interaction with expert advisors (EA) and scripts. When attaching
FREE
This is Demo Version of PipsFactoryMonthly This indicator depends on High and Low price of Currency in last Month and then i made some secret equations to draw 10 lines. Features You will know what exactly price you should enter the market. You will know when to be out of market. You will know you what should you do in market: Buy Sell Take profit and there are 3 levels to take your profit Support Resistance Risk to buy Risk to Sell Signal Types and Timeframe Used You can use this indicator ju
FREE
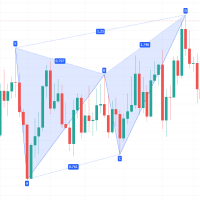
Description: This indicator draw ZigZag Line in multiple time frame also search for Harmonic patterns before completion of the pattern. Features: Five instances of ZigZag indicators can be configured to any desired timeframe and inputs. Draw Harmonic pattern before pattern completion. Display Fibonacci retracement ratios. Configurable Fibonacci retracement ratios. Draw AB=CD based on Fibonacci retracement you define. You can define margin of error allowed in Harmonic or Fibonacci calculations
FREE
After purchasing the Tpx Dash Supply Demand indicator, you must download this indicator which will link and feed market data to the Tpx Dash Supply Demand indicator and will provide all Supply Demand price signals, ATR Stop, VAH and VAL, trend values ​​with the ADX, and POC prices and locations in the market. Just download it and Dash will locate the indicator to retrieve the information!
FREE
Features: 1- Get OB/OS Levels from Golden MA Levels 2- Wait for Buy/Sell Start Level Cross 3- Optional: Should price cross Mid Level in earlier bars 4- Optional: Crossing bar High/Medium Volume 5- Optional: MA Stacked to check up/down trend for current TF 6- Optional: NRTR higher timeframes aligned Check Detailed blog post explained: https://www.mql5.com/en/blogs/post/758457 Levels with Buffers available here: Golden MA Levels Indicator: https://www.mql5.com/en/market/product/119515 Note: Arr
FREE
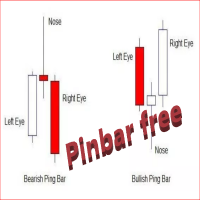
The Free  Pin Bar MT4  indicator  identifies Pin Bars  It will even give you sound or email alerts if want them. If you download it and like it please leave a review! It would be wonderful Pin Bars are purely based on price action as reflected by the candle formations created by Forex price movements. input Parameters are maximum allowed body/length ratio for the Nose bar. Nose body should be position in top (bottom for bearish pattern) part of the Nose bar.  tells the indicator that the Left Ey
FREE
Индикатор  уровней поддержки и сопротивления отлично показывает на графике все силовые уровни от всех таймфреймов. Рекомендую торговать уровни старших таймфреймов. Индикатор на текущем таймфрейме обновляться как только на графике  появится новый сетап  The indicator of support and resistance levels perfectly shows all power levels from all timeframes on the chart. I recommend trading higher timeframe levels. The indicator on the current timeframe is updated as soon as a new setup appears on the
FREE
Awesome Pivot Indicator
Komang Putra Riswanjaya
4 (1)
The Pivot Indicator is a vital tool for technical analysis used by traders in the financial markets. Designed to assist in identifying potential reversal points or trend changes, this indicator provides valuable insights into key levels in the market. Key features of the Pivot Indicator include: Automatic Calculations: The Pivot Indicator automatically calculates Pivot Point, Support, and Resistance levels based on the previous period's high, low, and close prices. This eliminates the complexity
FREE
Multi-Timeframe ATR göstergesi, MetaTrader 4 için standart ATR göstergesinin geliştirilmiş bir versiyonudur; trader’ların   istediği herhangi bir zaman dilimindeki   volatiliteyi mevcut grafikte doğrudan görmesini sağlar. Standart ATR yalnızca aktif grafik zaman diliminin verilerini gösterirken, bu versiyon başka bir zaman dilimini seçme imkânı verir — örneğin M15 veya H1 grafiğinde   Günlük ATR ’yi görüntülemek gibi. Nasıl çalışır: Gösterge, seçtiğiniz zaman diliminden (örneğin H1, H4 veya D1)
FREE
YOU CAN NOW DOWNLOAD FREE VERSIONS OF OUR PAID INDICATORS . IT'S OUR WAY OF GIVING BACK TO THE COMMUNITY ! >>>    GO HERE TO DOWNLOAD This system is an Heiken Ashi system based on RSI calculations . The system is a free open source script originally published on TradingView by JayRogers . We have taken the liberty of converting the pine script to Mq4 indicator . We have also added a new feature which enables to filter signals and reduces noise on the arrow signals. Background HEIKEN ASHI Th
FREE
RelicusRoad Daily Pivots, MetaTrader 4 ve MetaTrader 5 için bir günlük pivot noktası göstergesidir; önceki günün aralığını Fibonacci seviyelerine böler ve eksi yüzde 100'den artı yüzde 200'e kadar bunun üstüne ve altına uzatır. Klasik floor pivotları yerine, önceki tamamlanmış aralık; dibin yüzde 0, tepenin ise yüzde 100 olduğu bir ölçek olarak ele alınır. On dokuz seviye, grafiğin sağ kenarında kompakt renkli işaretler olarak basılır, bu yüzden bugünün hareketinin büyüklüğü dünün aralığının bir
FREE
Trading Sessions 3
Guillermo Pineda
4.92 (12)
Trading Sessions 3: Küresel Piyasa Aktivitesini Görselleştirin Trading Sessions 3 , temel gün içi işlem seanslarını net bir şekilde görüntülemek için tasarlanmış sezgisel bir MQL5 göstergesidir: Asya, Londra ve New York . Küresel piyasa aktivitesi hakkında net bir anlayış kazanın ve stratejik işlem kararları için artan volatilite dönemlerini belirleyin. Temel Özellikler: Küresel Seans Görselleştirmesi: Asya, Londra ve New York seansları için aktif işlem saatlerini doğrudan grafiklerinizde kolayc
FREE
ADR Bands
Navdeep Singh
4.5 (2)
Average daily range, Projection levels, Multi time-frame ADR bands shows levels based on the selected time-frame. Levels can be used as projections for potential targets, breakouts or reversals depending on the context in which the tool is used. Features:- Multi time-frame(default = daily) Two coloring modes(trend based or zone based) Color transparency  
FREE
Smart Flow MT4
Douglas Rodrigues
Smart Flow - Institutional Aggression Tracker Smart Flow   is a powerful and intuitive indicator designed to read the true market order flow and identify zones of strong institutional aggression. Instead of guessing tops and bottoms, Smart Flow directly paints your chart's candles whenever it detects a relevant directional capital injection, making your trading decisions highly objective. Working Principle The indicator performs an advanced mathematical calculation on every candle to estimate th
FREE
VWAP Intraday Free
Joaquin Nicolas Metayer
4.75 (4)
The volume weighted average price (VWAP) is a trading benchmark used by traders that gives the average price a security has traded at throughout the day, based on both volume and price. VWAP is calculated by adding up the dollars traded for every transaction (price multiplied by the number of shares traded) and then dividing by the total shares traded. You can see more of my publications here: https://www.mql5.com/en/users/joaquinmetayer/seller
FREE
We Trade Live Trend Levels
Ian Andrew Nicholson
5 (1)
We Trade Live Trend Levels  This indicator is a fantastic addition to the We Trade Live Trend Max this helps filter out noise and helps with better entries into a trade this add on is a must have and we use it all the time along side We Trade Live Trend Max this is a fantastic tool to help with entering a trade and exiting a trade,  This indicator Calculates  Volume strength  indicating levels of support and resistance for a trade, measures momentum in a market making buying or selling into the
FREE
Bu ürünün alıcıları ayrıca şunları da satın alıyor
Currency Strength Wizard , başarılı ticaret için size hepsi bir arada çözüm sağlayan çok güçlü bir göstergedir. Gösterge, birden çok zaman dilimindeki tüm para birimlerinin verilerini kullanarak şu veya bu forex çiftinin gücünü hesaplar. Bu veriler, şu veya bu para biriminin gücünü görmek için kullanabileceğiniz, kullanımı kolay para birimi endeksi ve para birimi güç hatları biçiminde temsil edilir. İhtiyacınız olan tek şey, işlem yapmak istediğiniz tabloya göstergeyi eklemektir ve gösterge size
Trend SniperX MT4
Sarvarbek Abduvoxobov
5 (6)
Trend Sniper X , işlemcilerin trend yönünü ve olası dönüş noktalarını netlik ve hassasiyetle belirlemelerine yardımcı olan MetaTrader 5 için çoklu zaman dilimli bir trend takip göstergesidir. MT5 İçin: https://www.mql5.com/en/market/product/181101 Fiyat Bilgisi: Mevcut fiyat tanıtım amaçlıdır ve gelecek güncellemeler ile yeni özellikler eklendikçe değişebilir. Code2Profit Kanalı Çoklu Zaman Dilimi Analizi ile Piyasaya Hakim Olun! Trend Sniper X ile Kazanma Oranınızı Nasıl En Üst Düzeye Çıkarırsı
M1 Sniper
Oleg Rodin
4.97 (30)
M1 SNIPER kullanımı kolay bir işlem göstergesi sistemidir. M1 zaman dilimi için tasarlanmış bir ok göstergesidir. Gösterge, M1 zaman diliminde scalping için bağımsız bir sistem olarak kullanılabilir ve mevcut işlem sisteminizin bir parçası olarak kullanılabilir. Bu işlem sistemi özellikle M1'de işlem yapmak için tasarlanmış olsa da, diğer zaman dilimleriyle de kullanılabilir. Başlangıçta bu yöntemi XAUUSD ve BTCUSD ticareti için tasarladım. Ancak bu yöntemi diğer piyasalarda işlem yaparken de ya
Smart Trend Trading System, trend bilgilerini, giriş ve çıkış sinyallerini ve fiyat seviyelerini tek bir grafikte birleştiren bir MetaTrader 4 göstergesidir. Trend tespiti, dönüş bölgeleri, Smart Cloud, trailing stop mantığı, destek ve direnç, mum renklendirme, uyarılar ve çoklu zaman dilimi analizi dahil olmak üzere 10’dan fazla trading aracını tek bir sistemde birleştirir. Sistem, farklı piyasa koşullarında işlem yapmanıza yardımcı olmak için tasarlanmıştır: Trend piyasaları: Ana trendi belir
SIO Oscillator: Kendi Kendini Optimize Eden Yarı Varyans Dengesizlik Osilatörü İndikatörü satın alın, ona dayalı Uzman Danışmanı (EA) ÜCRETSİZ edinin. Çoğu osilatör, tüm fiyat hareketlerini aynı şekilde değerlendirir. SIO ise yükseliş ve düşüş baskısını birbirinden ayırır ve aralarındaki dengesizliği ölçerek piyasayı gerçekte kimin kontrol ettiğini gösterir: alıcılar mı, satıcılar mı. Dengesizlik bir uç noktaya ulaştığında SIO, giriş, Stop Loss ve Take Profit seviyeleriyle birlikte net bir sinya
Liquidity Scalper System: gösterge formatında likiditeye dayalı bir işlem sistemi. Çoğu gösterge yalnızca bir ok gösterir; sonrasında stopun nereye konacağına, hedefin nerede olduğuna ve sinyale güvenilip güvenilmeyeceğine trader kendisi karar verir. Liquidity Scalper System işlemin tüm döngüsünü kapsar: likidite havuzlarını bulur, kırılımlarında sinyal verir, Entry, Stop Loss ve üç hedefi anında hesaplar, panelde ise istatistikleri ve yeni veriler üzerindeki doğrulama sonuçlarını gösterir. Sis
Gann Made Easy
Oleg Rodin
4.84 (174)
Gann Made Easy , bay teorisini kullanarak ticaretin en iyi ilkelerine dayanan, profesyonel ve kullanımı kolay bir Forex ticaret sistemidir. WD Gann. Gösterge, Zararı Durdur ve Kâr Al Seviyeleri dahil olmak üzere doğru SATIN AL ve SAT sinyalleri sağlar. PUSH bildirimlerini kullanarak hareket halindeyken bile işlem yapabilirsiniz. Satın alma işleminden sonra, alım satım talimatlarını ve harika ek göstergeleri ücretsiz olarak almak için lütfen benimle iletişime geçin! Muhtemelen Gann ticaret yöntem
Advanced Supply Demand
Bernhard Schweigert
4.91 (302)
Özel Ticaret –%30 İndirim Yeni Başlayanlar veya Uzman Yatırımcılar İçin En İyi Çözüm! Bu gösterge, bir dizi özel özellik ve yeni bir formül içerdiği için benzersiz, yüksek kaliteli ve uygun fiyatlı bir işlem aracıdır. Bu güncelleme ile çift zaman dilimi bölgeleri gösterebileceksiniz. Sadece daha yüksek bir zaman dilimini değil, hem grafik zaman dilimini hem de daha yüksek zaman dilimini gösterebileceksiniz: İÇ İÇE GEÇMİŞ BÖLGELER GÖSTERİYOR. Tüm Arz Talep yatırımcıları buna bayılacak. :) Önem
Bu gösterge, pratik ticaret için mükemmel olan otomatik dalga analizine yönelik bir göstergedir! Dava... Not:   Dalga sınıflandırması için Batılı isimleri kullanmaya alışkın değilim. Tang Lun'un (Tang Zhong Shuo Zen) adlandırma kuralının etkisiyle, temel dalgayı   kalem   , ikincil dalga bandını ise   segment   olarak adlandırdım. aynı zamanda segmentin trend yönü vardır. Adlandırma   esas olarak trend segmentidir   (bu adlandırma yöntemi gelecekteki notlarda kullanılacaktır, öncelikle söyleyey
Şu anda %30 İNDİRİMLİ! Herhangi bir Acemi veya Uzman Tüccar için En İyi Çözüm! Bu gösterge paneli yazılımı 28 döviz çifti üzerinde çalışıyor. Ana göstergelerimizden 2'sine (Gelişmiş Para Birimi Gücü 28 ve Gelişmiş Para Birimi Dürtüsü) dayanmaktadır. Tüm Forex piyasasına harika bir genel bakış sağlar. Gelişmiş Para Birimi Gücü değerlerini, para birimi hareket hızını ve tüm (9) zaman dilimlerinde 28 Forex çifti için sinyalleri gösterir. Trendleri ve / veya scalping fırsatlarını belirlemek için
This is a professional chart indicator designed for traders focused on stability and clear price action. It helps filter market noise and provides clear visual entry and exit zones for your trading decisions. Price Information: The current price is promotional and is subject to change as upcoming updates and new features are released. MQL5 public channel:  CLICK HERE for MT5:  Non-repainting MT5 version Core Features: Strictly Non-Repainting: The system is built with strict non-repaint logic. W
Scalper Vault
Oleg Rodin
4.9 (41)
Scalper Vault, gün içi işlemlerde istikrar yakalamak isteyen yatırımcılar için tasarlanmış, güçlü ve tam donanımlı bir alım satım sistemidir. Bu yüksek hassasiyetli gösterge; hem Forex hem de İkili Opsiyon yatırımcıları için kurumsal düzeyde analizler sunan, bağımsız ve eksiksiz bir alım satım sistemi işlevi görür. SATIN ALIM İŞLEMİNDEN SONRA BENİMLE İLETİŞİME GEÇİN; ALIM SATIM İPUÇLARIMI VE HARİKA BİR BONUSU ALIN! Tahmin yürütme zorunluluğunu ve karmaşık manuel analiz süreçlerini ortadan kaldır
Sizlere ON Trade Waves Patterns Harmonic Elliot Wolfe'u tanıtmaktan mutluluk duyarız. Bu, manuel ve otomatik yöntemleri kullanarak piyasada çeşitli desenleri tespit etmek için tasarlanmış gelişmiş bir göstergedir. İşte nasıl çalıştığı: Harmonik Desenler: Bu gösterge, grafiğinizde görünen harmonik desenleri tanımlayabilir. Bu desenler, Scott Carney'in "Harmonic Trading vol 1 & 2" adlı kitabında açıklandığı gibi harmonik ticaret teorisini uygulayan tüccarlar için önemlidir. Onları manuel olarak ç
RFI levels PRO
Roman Podpora
5 (2)
Bu gösterge, fiyat dönüş noktalarını ve fiyat geri dönüş bölgelerini doğru bir şekilde gösterir.       Başlıca oyuncular   . Yeni trendlerin nerede oluştuğunu görüyorsunuz ve her işlem üzerinde kontrolü elinizde tutarak, azami hassasiyetle kararlar alıyorsunuz. TREND LINES PRO   göstergesiyle birlikte kullanıldığında maksimum potansiyelini ortaya koyar.  VERSION MT5 Göstergenin gösterdiği şey: Yeni bir trendin başlangıcında aktivasyonla birlikte tersine dönüş yapıları ve tersine dönüş seviyeler
Zoryk Gold mt4
Reda El Koutbane
5 (4)
ZORYK — MetaTrader 4 için gelişmiş XAUUSD sinyal ve işlem planlama sistemi Bu durumu muhtemelen daha önce yaşadınız. Altını analiz edersiniz, giriş için beklersiniz ve sonunda işlemi açarsınız. Fiyat hemen ters yönde hareket eder. Çok erken kapatırsınız, Stop Loss seviyesini değiştirirsiniz veya birkaç saniye tereddüt edersiniz. Kısa süre sonra piyasa, siz işlemde değilken başlangıçta beklediğiniz yöne ve hedefe ulaşır. Sorun her zaman yön değildi. Asıl sorun belirsizlikti. Tam olarak nere
ShapeRadar - klasik grafik formasyonu göstergesi ShapeRadar, teknik analizin klasik formasyonlarını grafik üzerinde otomatik olarak bulur: çift ve üçlü tepe ve dipler, Omuz-Baş-Omuz ve ters versiyonu, yükselen ve alçalan kamalar, dikdörtgenler, üçgenler, bayraklar ve flamalar. Fiyat bir formasyonun sınırının ötesinde kapandığında gösterge formasyonu, giriş noktasını, zarar durdur seviyesini ve hedefi çizer; bilgi paneli de tespit edilen tüm formasyonları özetler. MetaTrader 5 sürümü:  https://ww
PRO Renko Sistemi, RENKO grafikleri ticareti için özel olarak tasarlanmış son derece hassas bir ticaret sistemidir. Bu, çeşitli ticaret araçlarına uygulanabilen evrensel bir sistemdir. Sistemi etkin piyasa sana doğru ters sinyallerine erişim hakkı denilen ses nötralize eder. Göstergenin kullanımı çok kolaydır ve sinyal üretiminden sorumlu tek bir parametreye sahiptir. Aracı, seçtiğiniz herhangi bir ticaret aracına ve renko çubuğunun boyutuna kolayca uyarlayabilirsiniz. Yazılımımla karlı bir
SR Liquidity
Oleg Rodin
5 (3)
SR Liquidity , piyasa likiditesinin yoğunlaştığı ve fiyatın en güçlü tepkiyi verdiği gizli bölgeleri ortaya çıkarmak için tasarlanmış bir alım-satım göstergesidir. Bu özel likidite alanları güçlü destek ve direnç seviyeleri işlevi görerek, piyasanın yön değiştirme ihtimalinin en yüksek olduğu yerlere dair size net bir harita sunar. SR Liquidity, sıradan Destek/Direnç çizgileri çizmek yerine, alım ve satım baskısının yoğunlaştığı bölgeleri tespit etmek için gerçek fiyat hareketlerini analiz eder.
Auto Optimized SpeedAngle , sürekli İleriye Dönük Optimizasyon (Walk-Forward Optimization, WFO) yoluyla eğri uydurmayı (curve-fitting) ortadan kaldıran kurumsal düzeyde bir momentum vektörleme sistemidir. Piyasa rejimleri değiştiğinde etkinliğini yitiren statik girdilere güvenmek yerine, gösterge, örneklem dışı (Out-of-Sample, OOS) doğrulama kullanarak parametrelerini dinamik olarak yeniden kalibre eder ve böylece gösterilen sinyallerin geçmişteki rastgele anomalileri değil, gerçek bir istatisti
Professional Volume Profile An indicator for MetaTrader 4 that builds a horizontal Volume Profile directly on the price chart. It shows the levels where traders executed the most trades, helping to identify support/resistance zones and assess the balance of power in the market. What the Indicator Displays POC (Point of Control) — the level with the maximum trading volume (red line). VAH / VAL (Value Area High / Low) — the upper and lower boundaries of the value area, where 70% of the volume was
Italo Volume Indicator
Italo Santana Gomes
4.92 (79)
BUY INDICATOR AND GET EA FOR FREE AS A BONUS + SOME OTHER GIFTS! ITALO VOLUME INDICATOR  is the best volume indicator ever created, and why is that? The Indicator works on all time-frames and assets, indicator built after 7 years of experience on forex and many other markets. You know many volume indicators around the internet are not complete, does not help, and it's difficult to trade, but the Italo Volume Indicator is different , the Italo Volume Indicator shows the wave volume, when market
Gelişmiş matematiksel hesaplamalara dayanarak en olası kısa vadeli fiyat hareketini tahmin eder. Özellikler Grafiğin zaman diliminde ve tüm üst zaman dilimlerinde yakın fiyat hareketinin tahmini; Piyasanın gerçek trendinin hesaplanması; En önemli destek ve direnç seviyelerinin hesaplanması; Sıkışma bölgeleri, seviye kesişimleri ve trend değişimleri için uyarılar; Sistem kaynaklarını az kullanır: çizgiler ve panel yalnızca bir değer değiştiğinde güncellenir; Kendi kendini ayarlar: her sembolde v
Atomic Analyst
Issam Kassas
5 (14)
Atomic Analyst — MetaTrader 4 Ürün soruları, kurulum rehberliği veya teknik destek için bana doğrudan MQL5 üzerinden mesaj gönderin. İndikatör, karmaşık piyasa hesaplamalarını basit görsel sinyallere, renk kodlu mumlara, trend okumalarına, stop-loss seviyelerine ve traderların hızlıca anlayıp gerçek piyasa koşullarında kullanabileceği çoklu take-profit bölgelerine dönüştürür. Ana trading kullanım alanları: Scalping ve gün içi işlem: Hızlı karar alma, net oklar, uyarılar, mum renkleri ve yapılan
Scalping Entry Points - fiyat hareketlerine uyum sağlayabilen ve yeniden çizmeden alım satımları açmak için sinyaller verebilen manuel bir alım satım sistemidir. Gösterge, merkezi destek ve direnç seviyesine göre trendin yönünü belirler. Nokta göstergesi, girişler ve çıkışlar için sinyaller sağlar. Manuel gün içi ticaret, ölçeklendirme ve ikili opsiyonlar için uygundur. Tüm zaman dilimlerinde ve ticaret enstrümanlarında çalışır. Gösterge birkaç türde uyarı verir. ürün nasıl kullanılır Mavi çiz
All in One package includes the  Oscillator Predictor ,  MACD Predictor ,  Thrust Scanner  and  Advanced Fibonacci  indicators which are mandatory for applying  Dinapoli  trade plans.  Please visit below links for detailed explanations of indicators. Advanced Fibonacci Indicator =>  https://www.mql5.com/en/market/product/52834 Thrust Scanner Indicator => https://www.mql5.com/en/market/product/52830 Overbought /Oversold Predictor indicator => https://www.mql5.com/en/market/product/52621 Macd P
True Direction Oscillator
Muhammad Elbermawi
4.85 (364)
Veya "Saf Momentum " ilkesini kullanarak fiyat değişim oranını ölçen bir endeks olan (TDO). Bir menkul kıymet fiyatı 10'dan 15'e yükseldiğinde, fiyat değişim oranı %150'dir, ancak 15'ten 10'a düştüğünde, fiyat değişim oranı sadece %33.3'tür. Bu nedenle, "Fiyat Değişim Oranı" (ROC) veya "Momentum" gibi teknik analiz göstergeleri, artan fiyat hareketleri için azalan hareketlere göre daha yüksek değerler verir. TDO, yatırımcıların momentumu doğru okumalarına yardımcı olmak için bu sorunu düzeltir.
Quantum Imbalance Profiles , denge ve dengesizlik evrelerini gösteren bir göstergedir. Piyasanın hangi fiyatlarda hacim işlem gördüğünü, bu bölgede hangi tarafın baskın olduğunu ve fiyatın ardından hangi seviyeler üzerinden impulsla genişlediğini gösterir. Klasik hacim profili tek bir soruyu yanıtlar: işlemler nerede gerçekleşti. Her fiyatta hangi tarafın baskın olduğunu, yatay seyrin nasıl sonuçlandığını ve piyasanın hangi yöne çıktığını göstermez. Quantum Imbalance Profiles profili Volume Bid/
Forex için manuel ticaret ve teknik analiz göstergesi. İşlem gününün açılış seviyesini gösteren bir trend göstergesi ve giriş noktalarını belirlemek için bir ok göstergesinden oluşur. Gösterge yeniden renklenmez; mum kapandığında çalışır. Sinyal okları için çeşitli uyarı türleri içerir. Herhangi bir grafikte, alım satım aracında veya zaman diliminde çalışacak şekilde yapılandırılabilir. Çalışma stratejisi trend boyunca fiyat hareketlerini aramaya dayanmaktadır.  " Buy " işlemleri yapabilmek
Currency Strength Matrix
Raymond Gilmour
4.5 (26)
THE ONLY CURRENCY STRENGTH INDICATOR BUILT ON PRICE ACTION Most currency strength meters average an oscillator, or measure how far price has travelled. But these are not accurate measures of trend, Currency Strength Matrix measures trend strength, not just if a currency price has gone up or down. Currency Strength Matrix reads market structure . For each of the 28 major pairs it finds the confirmed cycle highs and lows, and decides whether that pair is in an uptrend, a downtrend, or neither. A
Dark Support Resistance  is an Indicator for intraday trading. This Indicator is programmed to identify  Support and Resistance Lines , providing a high level of accuracy and reliability. Key benefits Easily visible lines Only the most important levels will be displayed Automated adjustment for each timeframe and instrument Easy to use even for beginners Never repaints, never backpaints, Not Lag 100% compatible with Expert Advisor development All types of alerts available: Pop-up, Email, Push
Yazarın diğer ürünleri
OFX Ict
Malik Muhammad Naveed
======================================================== OFX ICT — MQL5 MARKET PRODUCT DESCRIPTION (formatting notes: **bold** = editor Bold button;  lines starting with "•" = bullet-list button;  UPPERCASE lines = section headings) ======================================================== SHORT TITLE (product name field): OFX ICT — FVG, CE, Hangman, CRT & Top-Down Bias for XAUUSD (Gold) ------------------------------------------------------- OVERVIEW -----------------------------------------
FREE
OFX Liquidity2
Malik Muhammad Naveed
4.5 (2)
======================================================== OFX LIQUIDITY 2 - MQL5 MARKET PRODUCT DESCRIPTION (formatting notes: **bold** = editor Bold button;  lines starting with "•" = bullet-list button;  UPPERCASE lines = section headings) ======================================================== SHORT TITLE (product name field): OFX Liquidity 2 - Liquidity Pools + Multi-Timeframe Strength for XAUUSD (Gold) ------------------------------------------------------- OVERVIEW --------------------
FREE
OFX Book
Malik Muhammad Naveed
======================================================== OFX BOOK — MQL5 MARKET PRODUCT DESCRIPTION (formatting notes: text in **bold** = use the editor's Bold button;  lines starting with "•" = use the bullet-list button;  UPPERCASE lines = section headings) ======================================================== SHORT TITLE (for the product name field): OFX Book — Order Book Imbalance for XAUUSD (Gold) ------------------------------------------------------- OVERVIEW ----------------------
FREE
Malik Naveed Volume — Better Volume Multi Timeframe Malik Naveed Volume shows you what the volume is really doing. It reads each candle's volume and price range, splits it into buying vs selling pressure, and colours the bars so you can instantly see climax moves, absorption (churn), and low-volume exhaustion. It then draws support/resistance levels from those key bars and alerts you when price breaks and retests them — across six timeframes at once, on any symbol. Works on ANY symbol and ANY
FREE
Ofx oderflow
Malik Muhammad Naveed
======================================================== OFX orderflow — MQL5 MARKET PRODUCT DESCRIPTION (formatting notes: **bold** = editor Bold button;  lines starting with "•" = bullet-list button;  UPPERCASE lines = section headings) ======================================================== SHORT TITLE (product name field): OFX orderFlow — CMF + MFI Money-Flow & Divergence for XAUUSD (Gold) ------------------------------------------------------- OVERVIEW ---------------------------------
FREE
OFX Heatmap
Malik Muhammad Naveed
======================================================== OFX HEATMAP — MQL5 MARKET PRODUCT DESCRIPTION (formatting notes: **bold** = editor Bold button;  lines starting with "•" = bullet-list button;  UPPERCASE lines = section headings) ======================================================== SHORT TITLE (product name field): OFX Heatmap — Volume-at-Price Heatmap + POC for XAUUSD (Gold) ------------------------------------------------------- OVERVIEW -----------------------------------------
FREE
BrokerStyle Momentum Hedge
Malik Muhammad Naveed
5 (1)
BrokerStyle Momentum Hedge BrokerStyle Momentum Hedge is a MetaTrader 4 Expert Advisor that manages directional price-step entries and opposite-side trade pairs. It combines a configurable momentum filter with basket equity profit controls and an on-chart dashboard. Entry logic The EA tracks a rolling price anchor. Upward price steps can trigger buy entries, while downward steps can trigger sell entries. The momentum filter supports level and slope conditions, configurable timeframes, and curren
FREE
PRODUCT NAME MN Volume Body Break SHORT DESCRIPTION (one line) Buy/sell volume candles with H4 + H1 key areas, candle-body break and retest signals, entry body, stop loss and alerts on one dashboard. CATEGORY Indicators ------------------------------------------------------------ FULL DESCRIPTION ------------------------------------------------------------ MN Volume Body Break paints every candle by what its volume is doing, then turns the important candles into clear trade triggers. The ru
FREE
Ofx Cvd
Malik Muhammad Naveed
======================================================== OFX CVD — MQL5 MARKET PRODUCT DESCRIPTION (formatting notes: **bold** = editor Bold button;  lines starting with "•" = bullet-list button;  UPPERCASE lines = section headings) ======================================================== SHORT TITLE (product name field): OFX CVD — Cumulative Volume Delta + Divergence for XAUUSD (Gold) ------------------------------------------------------- OVERVIEW ------------------------------------------
FREE
OFX Liquidity1
Malik Muhammad Naveed
======================================================== OFX LIQUIDITY 1 - MQL5 MARKET PRODUCT DESCRIPTION (formatting notes: **bold** = editor Bold button;  lines starting with "•" = bullet-list button;  UPPERCASE lines = section headings) ======================================================== SHORT TITLE (product name field): OFX Liquidity - Buy-Side / Sell-Side Liquidity Pools for XAUUSD (Gold) ------------------------------------------------------- OVERVIEW ----------------------------
FREE
OFX Delta
Malik Muhammad Naveed
======================================================== OFX DELTA — MQL5 MARKET PRODUCT DESCRIPTION (formatting notes: **bold** = editor Bold button;  lines starting with "•" = bullet-list button;  UPPERCASE lines = section headings) ======================================================== SHORT TITLE (product name field): OFX Delta — Per-Bar Volume Delta / Order-Flow Imbalance for XAUUSD (Gold) ------------------------------------------------------- OVERVIEW -------------------------------
FREE
OFX StrengthMeter
Malik Muhammad Naveed
5 (2)
======================================================== OFX STRENGTH METER - MQL5 MARKET PRODUCT DESCRIPTION (formatting notes: **bold** = editor Bold button;  lines starting with "•" = bullet-list button;  UPPERCASE lines = section headings) ======================================================== SHORT TITLE (product name field): OFX Strength Meter - Real-Time Buy/Sell Strength for XAUUSD (Gold) ------------------------------------------------------- OVERVIEW -----------------------------
FREE
OFX Ea
Malik Muhammad Naveed
5 (1)
======================================================== OFX EA — MQL5 MARKET PRODUCT DESCRIPTION (formatting notes: **bold** = editor Bold button;  lines starting with "•" = bullet-list button;  UPPERCASE lines = section headings) ======================================================== SHORT TITLE (product name field): OFX EA — OrderFlow Conviction Meter & Signals for XAUUSD (Gold) ------------------------------------------------------- OVERVIEW --------------------------------------------
FREE
OFX Dashboard
Malik Muhammad Naveed
5 (1)
======================================================== OFX DASHBOARD — MQL5 MARKET PRODUCT DESCRIPTION (formatting notes: **bold** = editor Bold button;  lines starting with "•" = bullet-list button;  UPPERCASE lines = section headings) ======================================================== SHORT TITLE (product name field): OFX Dashboard — All-Engine OrderFlow Cockpit for XAUUSD (Gold) ------------------------------------------------------- OVERVIEW --------------------------------------
FREE
======================================================== GANN CONFLUENCE SYSTEM PRO (XAU) - MQL5/MT5 MARKET DESCRIPTION (formatting: **bold** = Bold button; lines with • = bullet list; UPPERCASE = heading) ======================================================== OVERVIEW ------------------------------------------------------- **Gann Confluence System PRO** is a professional multi-module Gann engine for gold (XAUUSD). It combines seven independent Gann techniques into one weighted confluence sc
FREE
======================================================== PURE GANN LAW OF VIBRATION - MQL5/MT5 MARKET DESCRIPTION (formatting: **bold** = Bold button; lines with • = bullet list; UPPERCASE = heading) ======================================================== OVERVIEW ------------------------------------------------------- **Pure Gann Law of Vibration** projects the classic Gann geometry on your chart from a chosen major pivot: the 1x1 angle fan, Square of Nine levels, range divisions and time cy
FREE
======================================================== XAUUSD ELLIOTT WAVE + REAL YIELD (MTF LEVELS/TARGETS) - MQL5/MT4 MARKET DESCRIPTION (formatting: **bold** = Bold button; lines with • = bullet list; UPPERCASE = heading) ======================================================== OVERVIEW ------------------------------------------------------- **XAUUSD Elliott Wave + Real Yield** maps Elliott structure with ZigZag pivots and motive/corrective checks, then filters signals with a **real-yield
FREE
======================================================== XAUUSD ELLIOTT WAVE + REAL YIELD (MTF LEVELS/TARGETS) - MQL5/MT5 MARKET DESCRIPTION (formatting: **bold** = Bold button; lines with • = bullet list; UPPERCASE = heading) ======================================================== OVERVIEW ------------------------------------------------------- **XAUUSD Elliott Wave + Real Yield** maps Elliott structure with ZigZag pivots and motive/corrective checks, then filters signals with a **real-yield
FREE
======================================================== XAUUSD ELLIOTT WAVE + REAL YIELD (BIG DASHBOARD) - MQL5/MT4 MARKET DESCRIPTION (formatting: **bold** = Bold button; lines with • = bullet list; UPPERCASE = heading) ======================================================== OVERVIEW ------------------------------------------------------- **XAUUSD Elliott Wave + Real Yield (Big Dashboard)** is the dashboard edition of the Elliott + real-yield engine: the same ZigZag/Elliott structure and ma
FREE
OFX KillZones
Malik Muhammad Naveed
======================================================== OFX KILLZONES — MQL5 MARKET PRODUCT DESCRIPTION (formatting notes: **bold** = editor Bold button;  lines starting with "•" = bullet-list button;  UPPERCASE lines = section headings) ======================================================== SHORT TITLE (product name field): OFX KillZones — ICT Kill Zones & Macros (NY time) for XAUUSD (Gold) ------------------------------------------------------- OVERVIEW ---------------------------------
FREE
======================================================== GOLD WAVE LEVELS (ELLIOTT-ALIGNED) - MQL5/MT4 MARKET DESCRIPTION (formatting: **bold** = Bold button; lines with • = bullet list; UPPERCASE = heading) ======================================================== OVERVIEW ------------------------------------------------------- **Gold Wave Levels** draws a tested wave backbone for gold and validates signals against **Elliott theory hard-rules**, with higher-timeframe context and per-timeframe
FREE
======================================================== GANN CLUSTERS - INSTITUTIONAL SIGNAL PANEL - MQL5/MT4 MARKET DESCRIPTION (formatting: **bold** = Bold button; lines with • = bullet list; UPPERCASE = heading) ======================================================== OVERVIEW ------------------------------------------------------- **Gann Clusters** finds where three independent Gann systems agree and draws those **confluence clusters** across multiple timeframes, with a signal panel that
FREE
======================================================== GOLD WAVE LEVELS (ELLIOTT-ALIGNED) - MQL5/MT5 MARKET DESCRIPTION (formatting: **bold** = Bold button; lines with • = bullet list; UPPERCASE = heading) ======================================================== OVERVIEW ------------------------------------------------------- **Gold Wave Levels** draws a tested wave backbone for gold and validates signals against **Elliott theory hard-rules**, with higher-timeframe context and per-timeframe
FREE
======================================================== XAUUSD ELLIOTT WAVE + REAL YIELD (BIG DASHBOARD) - MQL5/MT5 MARKET DESCRIPTION (formatting: **bold** = Bold button; lines with • = bullet list; UPPERCASE = heading) ======================================================== OVERVIEW ------------------------------------------------------- **XAUUSD Elliott Wave + Real Yield (Big Dashboard)** is the dashboard edition of the Elliott + real-yield engine: the same ZigZag/Elliott structure and ma
FREE
======================================================== GOLD WAVE MONSTER - MQL5/MT4 MARKET DESCRIPTION (formatting: **bold** = Bold button; lines with • = bullet list; UPPERCASE = heading) ======================================================== OVERVIEW ------------------------------------------------------- **Gold Wave Monster** shows the current chart's **Wave-3 start lines** and live **wave count**. When an H1/M15 Wave-3 line is broken upward it flags a BUY; broken downward, a SELL - vis
FREE
======================================================== GANN CONFLUENCE SYSTEM PRO (XAU) - MQL5/MT4 MARKET DESCRIPTION (formatting: **bold** = Bold button; lines with • = bullet list; UPPERCASE = heading) ======================================================== OVERVIEW ------------------------------------------------------- **Gann Confluence System PRO** is a professional multi-module Gann engine for gold (XAUUSD). It combines seven independent Gann techniques into one weighted confluence sc
FREE
Double Yellow H1 Setup Pro MT4 Professional H1 Buy & Sell Signal Indicator Double Yellow H1 Setup Pro MT4 is a professional price action indicator developed to identify high-probability BUY and SELL trading opportunities on the H1 (1 Hour) timeframe. It is designed for traders who prefer clear, rule-based setups without cluttering their charts with unnecessary indicators. The indicator scans the market continuously and highlights potential reversal or continuation setups based on the proprietary
FREE
======================================================== PURE GANN LAW OF VIBRATION - MQL5/MT4 MARKET DESCRIPTION (formatting: **bold** = Bold button; lines with • = bullet list; UPPERCASE = heading) ======================================================== OVERVIEW ------------------------------------------------------- **Pure Gann Law of Vibration** projects the classic Gann geometry on your chart from a chosen major pivot: the 1x1 angle fan, Square of Nine levels, range divisions and time cy
FREE
Volumebymalik2
Malik Muhammad Naveed
======================================================== BUY/SELL VOLUME MOMENTUM DASHBOARD - MQL5/MT4 MARKET DESCRIPTION (formatting: **bold** = Bold button; lines with • = bullet list; UPPERCASE = heading) ======================================================== OVERVIEW ------------------------------------------------------- **Buy/Sell Volume Momentum Dashboard** reads buying vs selling volume momentum and presents it as a clear on-chart dashboard, so you can see which side is driving the m
FREE
======================================================== GANN CLUSTERS - INSTITUTIONAL SIGNAL PANEL - MQL5/MT4 MARKET DESCRIPTION (formatting: **bold** = Bold button; lines with • = bullet list; UPPERCASE = heading) ======================================================== OVERVIEW ------------------------------------------------------- **Gann Clusters** finds where three independent Gann systems agree and draws those **confluence clusters** across multiple timeframes, with a signal panel that
FREE
Filtrele:
Değerlendirme yok
Değerlendirmeye yanıt