Drawing Studio

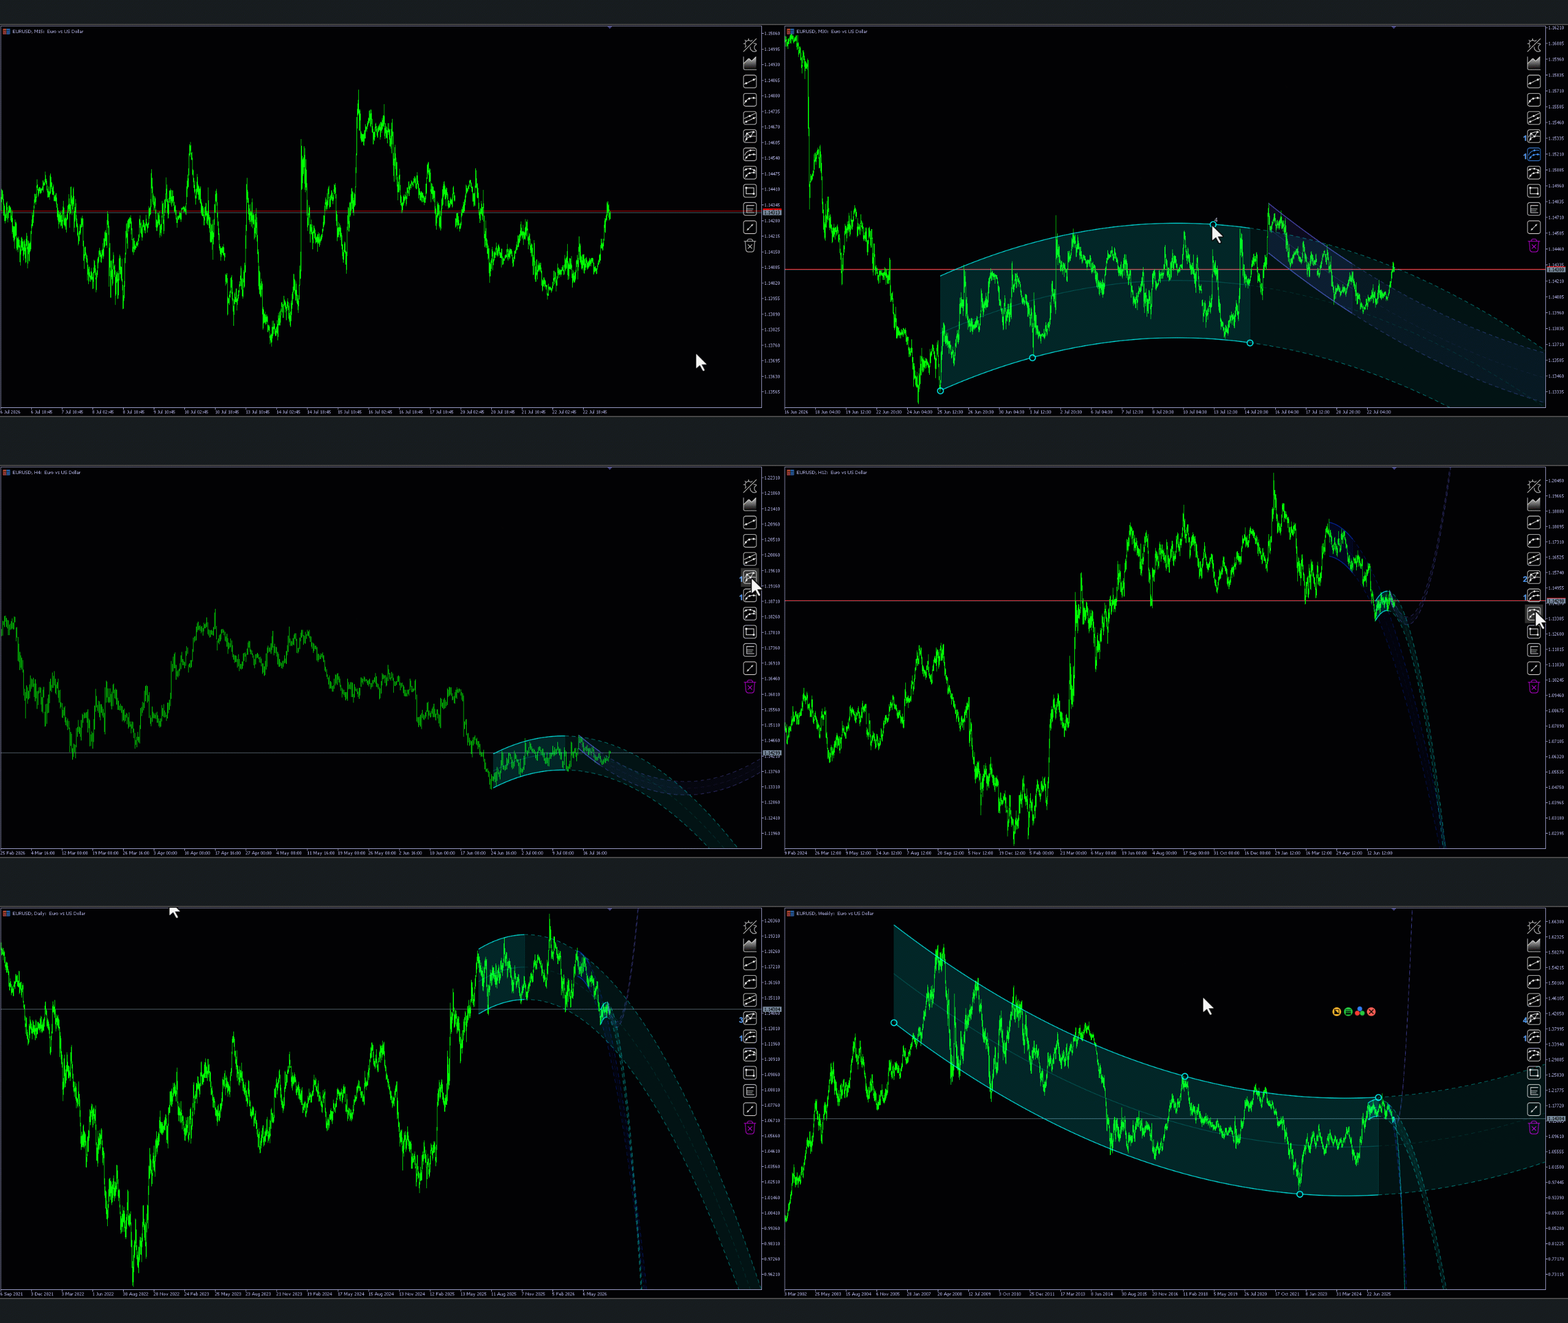
Drawing Studio — a simple tool for drawing vector elements right on your chart, helping you see what the eye alone can't.

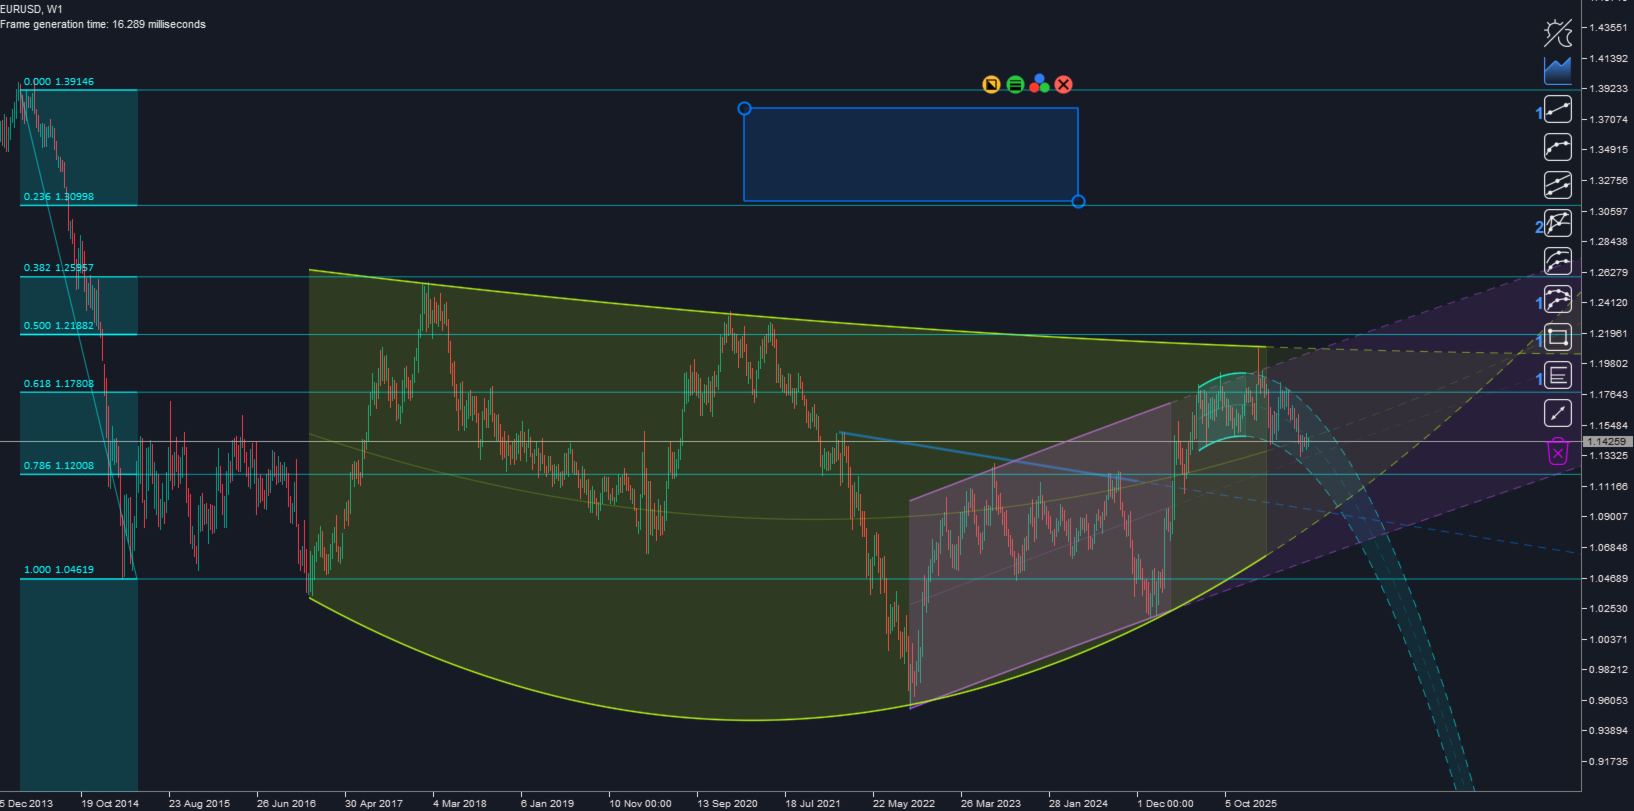
Trend lines, channels, parabolas, Fibonacci levels and a ruler — everything is drawn on a high-performance canvas with true anti-aliasing, not as standard terminal objects. The result is speed, cleanliness and beauty: thin, smooth lines instead of jagged "staircase" edges, and a chart that never gets cluttered with dozens of objects.

Drawing tools

  • Trend line
  • Parabola
  • Linear channel
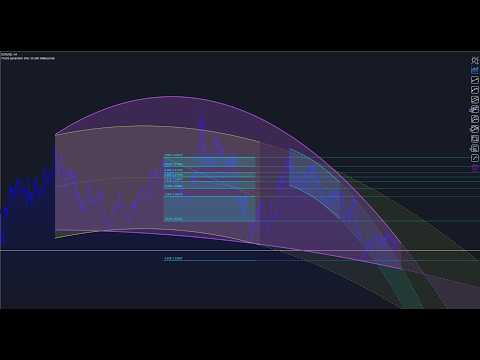
  • Parabolic channels — 2+2, 3+1, 3+3 (rarely found in drawing tools)
  • Rectangle
  • Fibonacci levels
  • Ruler (measuring tool)

The indicator is under active development — new elements are added based on buyers' requests and suggestions.

Editing in one click

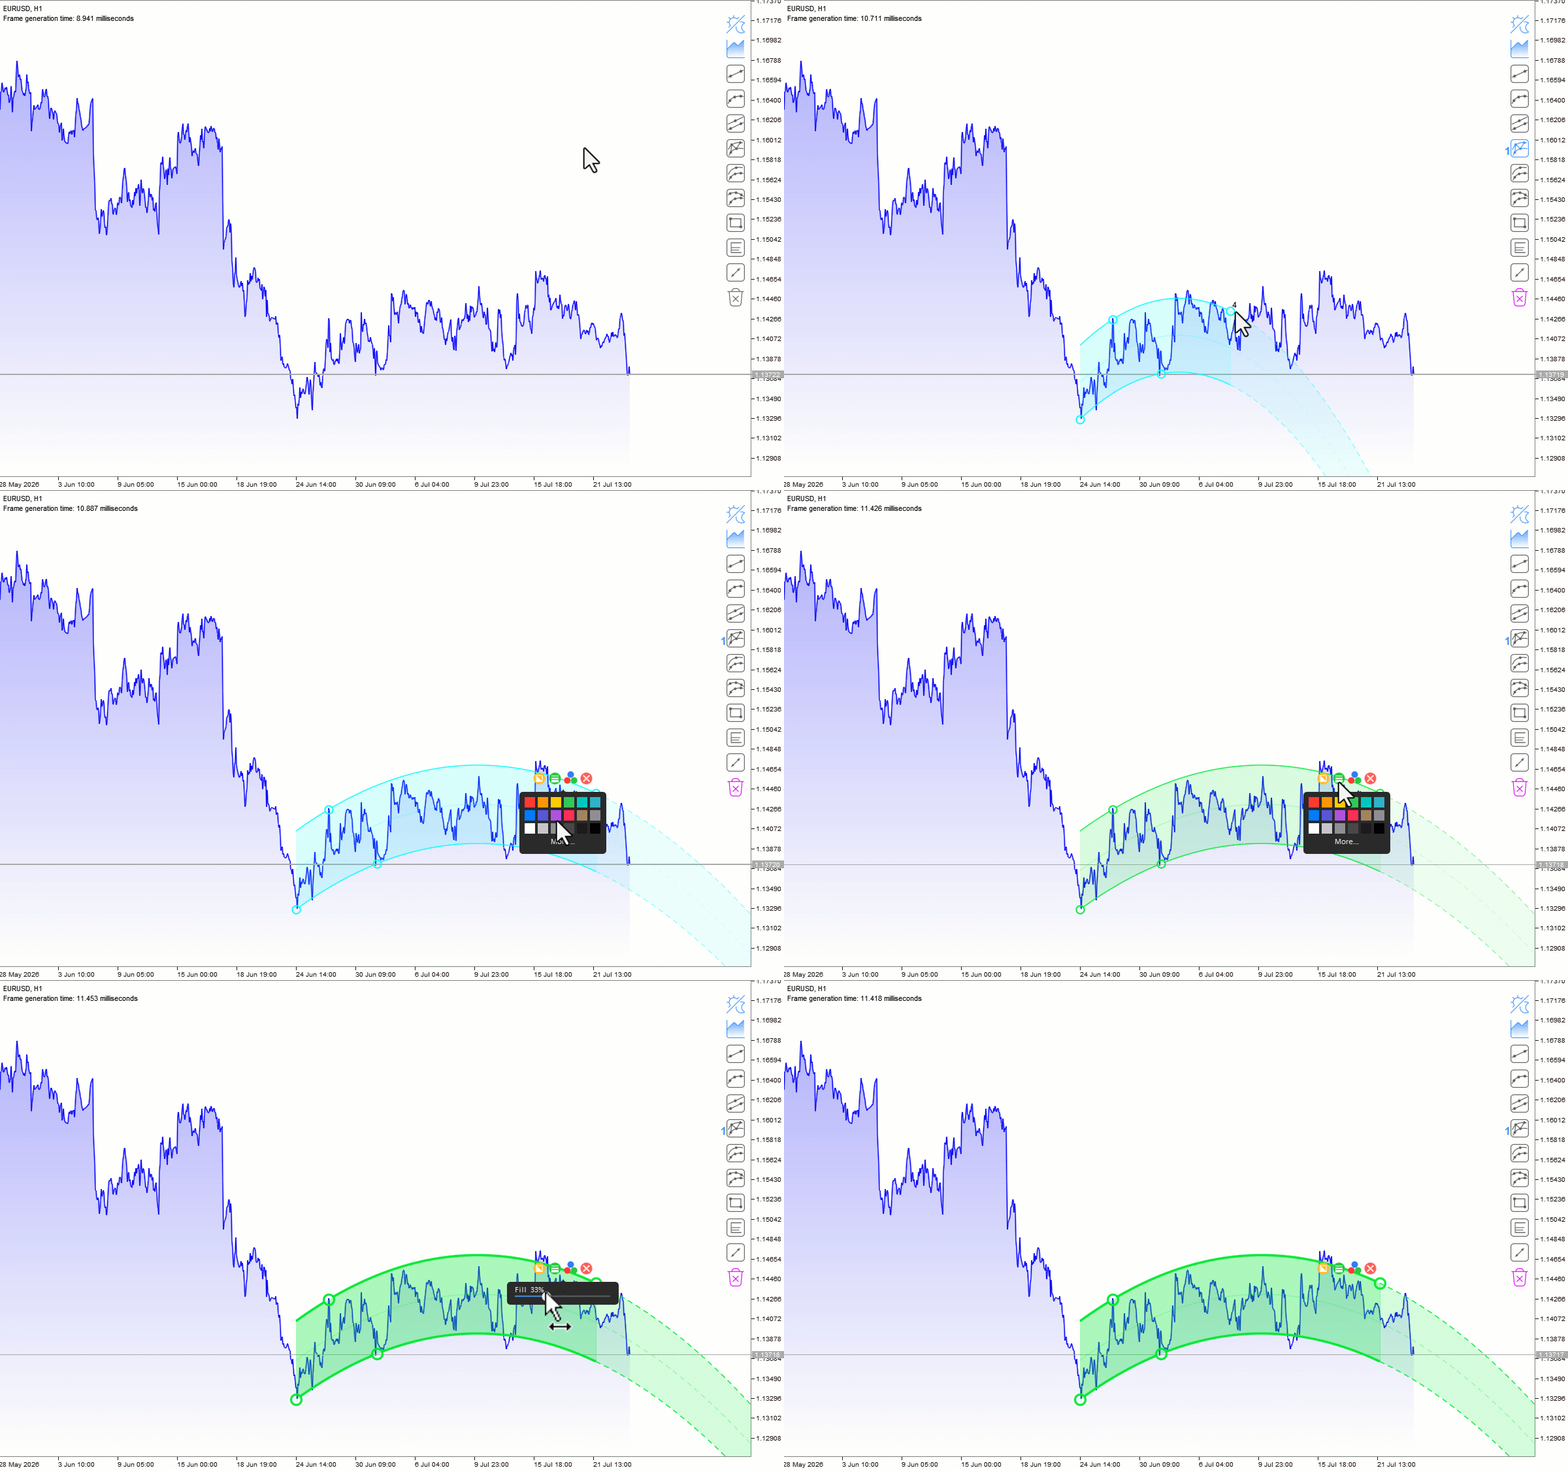
Click any line of an element and it switches to edit mode: a compact, intuitive popup menu with tooltips appears in the corner:

  • Delete
  • Color — built-in palette
  • Line thickness
  • Fill with adjustable transparency

Built for real work

  • High-performance anti-aliased canvas rendering — thin, smooth, precise lines
  • Creates no terminal objects — your chart stays clean and rendering stays fast
  • Your drawings survive timeframe changes — nothing disappears
  • Works in the Strategy Tester
  • DPI-aware — correct sizing on 4K and high-resolution monitors
  • Delete all elements with one click, or remove each one individually
  • (bonus) Canvas chart mode: candlesticks / bars / line with gradient and period separators — with no lag behind price while scrolling, unlike a classic Canvas

Under the hood

No objects are added to the chart: everything is drawn on the Canvas, backed by its own internal database that preserves all elements across timeframe changes and terminal restarts.
Yazarın diğer ürünleri
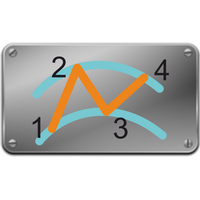
Convenient drawing of parabolic channels by four points (two lower and two upper extremums). Additional control keys: N (New) - Start drawing a new channel. C (Clear) - Deletes the current channel. By default, the current channel is the last channel. But you can click on the line of any channel to make it current. Click on the gear in the upper right corner to set some parameters for all channels or the current channel. All work is visible from the animated Gif. Do not forget to express your w
FREE
The iChannels
BeeXXI Corporation
5 (1)
Ultra-fast recognition of parabolic channels (as well as linear, horizontal and wavy channels) throughout the depth of history, creating a hierarchy of channels. Required setting: Max bars in chart: Unlimited This indicator is designed primarily for algorithmic trading, but can also be used for manual trading.  This indicator will have a very active evolution in the near future and detailed descriptions on how to apply to create robots
Native Channels
BeeXXI Corporation
5 (1)
This indicator recognizes all support and resistance levels. A number of unique high-performance techniques have been applied, which made the existence of this indicator possible. All formed channels are naturally visible: horizontal linear linear parabolic cubic (Polynomial 3 degrees - Wave) This is due to a bundle of approximating channels. The formed channels form "standing waves" in a hierarchical sequence. Thus, all support and resistance levels are visible. All parameter management is i
Convenient drawing of parabolic channels by four points (two lower and two upper extremums). Additional control keys: N (New) - Start drawing a new channel. C (Clear) - Deletes the current channel. By default, the current channel is the last channel. But you can click on the line of any channel to make it current. Click on the gear in the upper right corner to set some parameters for all channels or the current channel. All work is visible from the animated Gif. Channels are saved when the time
FREE
The use of a polynomial expansion of data opens up new possibilities for analysis and decision making. But the problem of all existing algorithms is a very slow computation. The main feature of this indicator is its fast algorithm. The speed of calculation of the polynomial algorithm and its standard deviation values ​​is several thousand times faster than conventional algorithms. So this is a convenient algorithm for use without the need to apply supercomputers. Also, starting from version 1.4
This indicator significantly expands the capabilities of the usual ZigZag due to the addition of parabolic channels at the earliest stage of their inception. Download the demo version and test it in the tester. All graphics in the tester are working. But the ZigZag algorithm is special here, because it is implemented on a unique author's ultrafast loop-less algorithm for calculating parabolic regression and calculating its standard deviation. The features of this ZigZag are: Fast calculation, r
Native Channels MT4
BeeXXI Corporation
5 (1)
This indicator recognizes all support and resistance levels. A number of unique high-performance techniques have been applied, which made the existence of this indicator possible. All formed channels are naturally visible: horizontal linear linear parabolic cubic (Polynomial 3 degrees - Wave) This is due to a bundle of approximating channels. The formed channels form "standing waves" in a hierarchical sequence. Thus, all support and resistance levels are visible. All parameter management is i
A useful and convenient tool for traders when analyzing and making decisions. Peculiarity The main feature of this indicator is its fast algorithm . The gain in the speed of calculating the polynomial and its value of the standard deviation in comparison with classical algorithms reaches several thousand times. Also, this indicator includes a Strategy Tester with a clear visualization of transactions, an equity chart and simultaneous calculation and display of the following data in the form of
ZigZagus Parabolicus
BeeXXI Corporation
5 (1)
This indicator significantly expands the capabilities of the usual ZigZag due to the addition of parabolic channels at the earliest stage of their origin. Download the demo version and test it in the tester. All graphics in the tester are working. But the ZigZag algorithm is special here, because it is implemented on a unique author's ultrafast loop-less algorithm for calculating parabolic regression and calculating its standard deviation. The features of this ZigZag are: Fast calculation, rega
Gravity Channels
BeeXXI Corporation
This indicator allows the trader to see what is difficult to see and recognize with the eyes. The indicator naturally recognizes and visualizes all processes in the behaviour of a trading instrument, which will be an excellent assistant for a trader who likes to make decisions on his own. This indicator draws a set of approximating channels in all sections of history with different periods. Formed channels form naturally and form their own hierarchy of channels by seniority (length and width).
Filtrele:
Değerlendirme yok
Değerlendirmeye yanıt