Drawing Studio
- 지표
- 버전: 1.3
- 업데이트됨: 25 7월 2026
- 활성화: 10

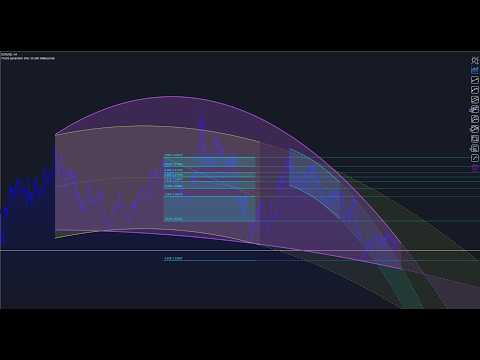
Drawing Studio — a simple tool for drawing vector elements right on your chart, helping you see what the eye alone can't.
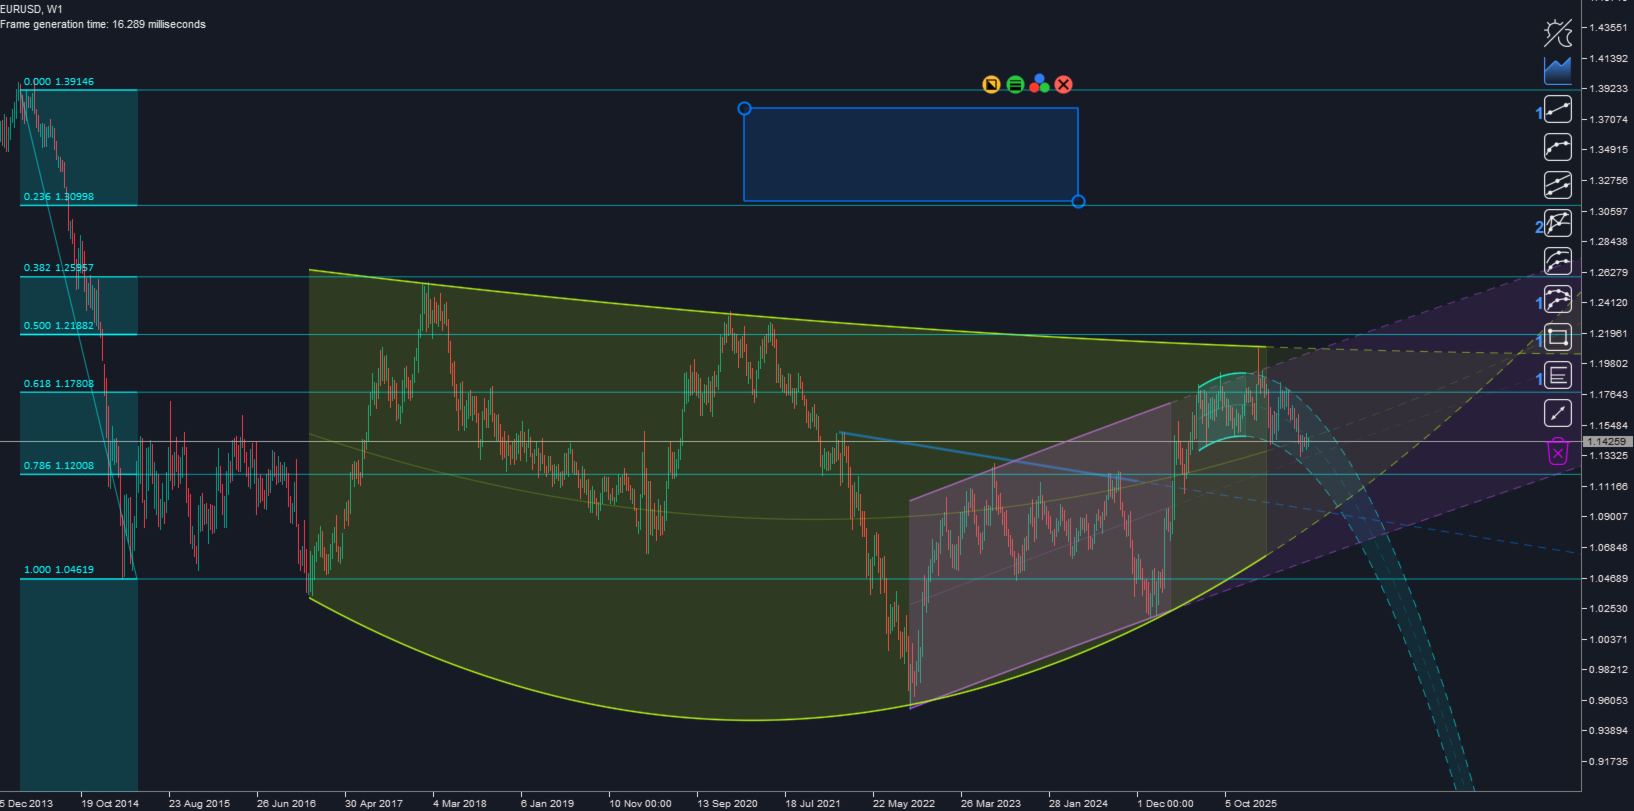
Trend lines, channels, parabolas, Fibonacci levels and a ruler — everything is drawn on a high-performance canvas with true anti-aliasing, not as standard terminal objects. The result is speed, cleanliness and beauty: thin, smooth lines instead of jagged "staircase" edges, and a chart that never gets cluttered with dozens of objects.
Drawing tools
- Trend line
- Parabola
- Linear channel
- Parabolic channels — 2+2, 3+1, 3+3 (rarely found in drawing tools)
- Rectangle
- Fibonacci levels
- Ruler (measuring tool)
The indicator is under active development — new elements are added based on buyers' requests and suggestions.
Editing in one click
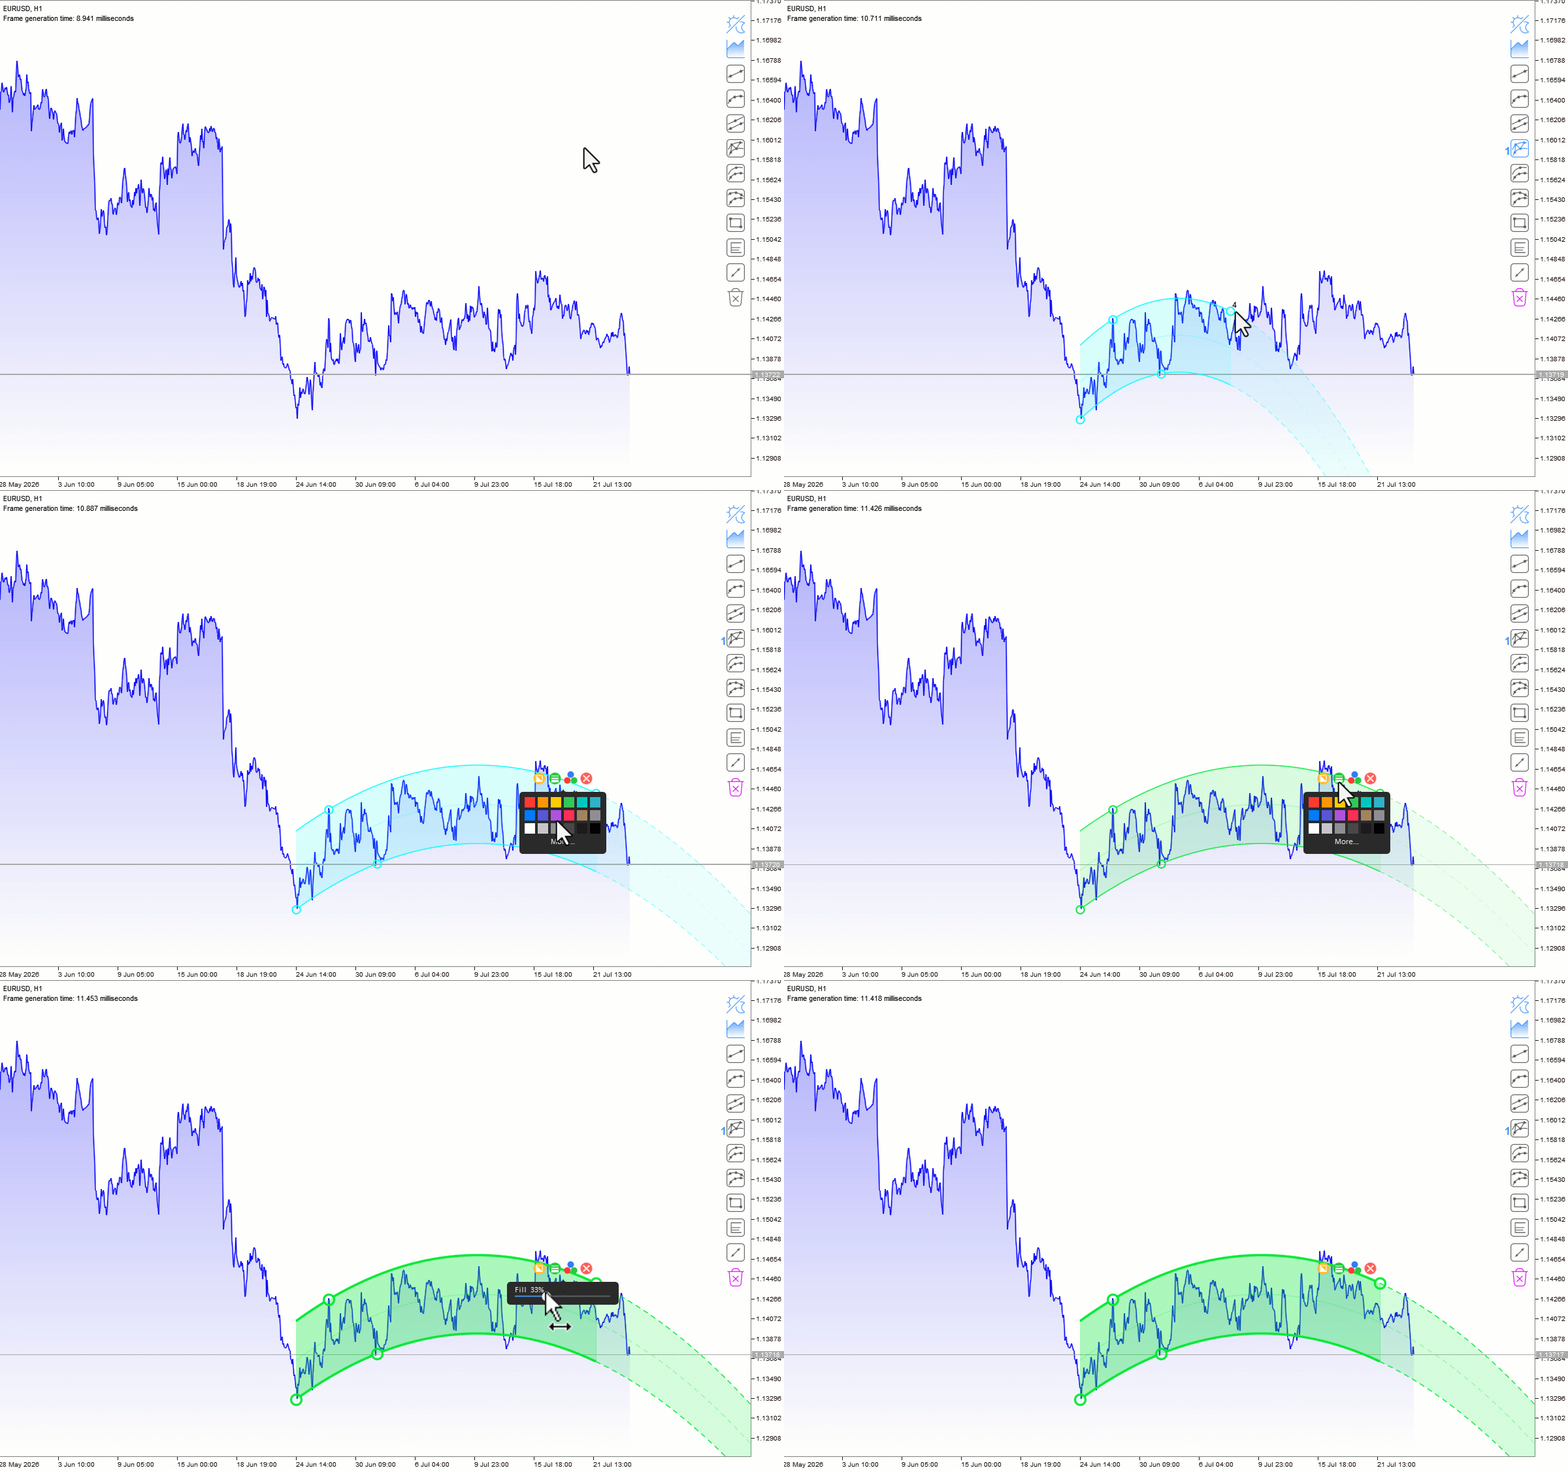
Click any line of an element and it switches to edit mode: a compact, intuitive popup menu with tooltips appears in the corner:
- Delete
- Color — built-in palette
- Line thickness
- Fill with adjustable transparency
Built for real work
- High-performance anti-aliased canvas rendering — thin, smooth, precise lines
- Creates no terminal objects — your chart stays clean and rendering stays fast
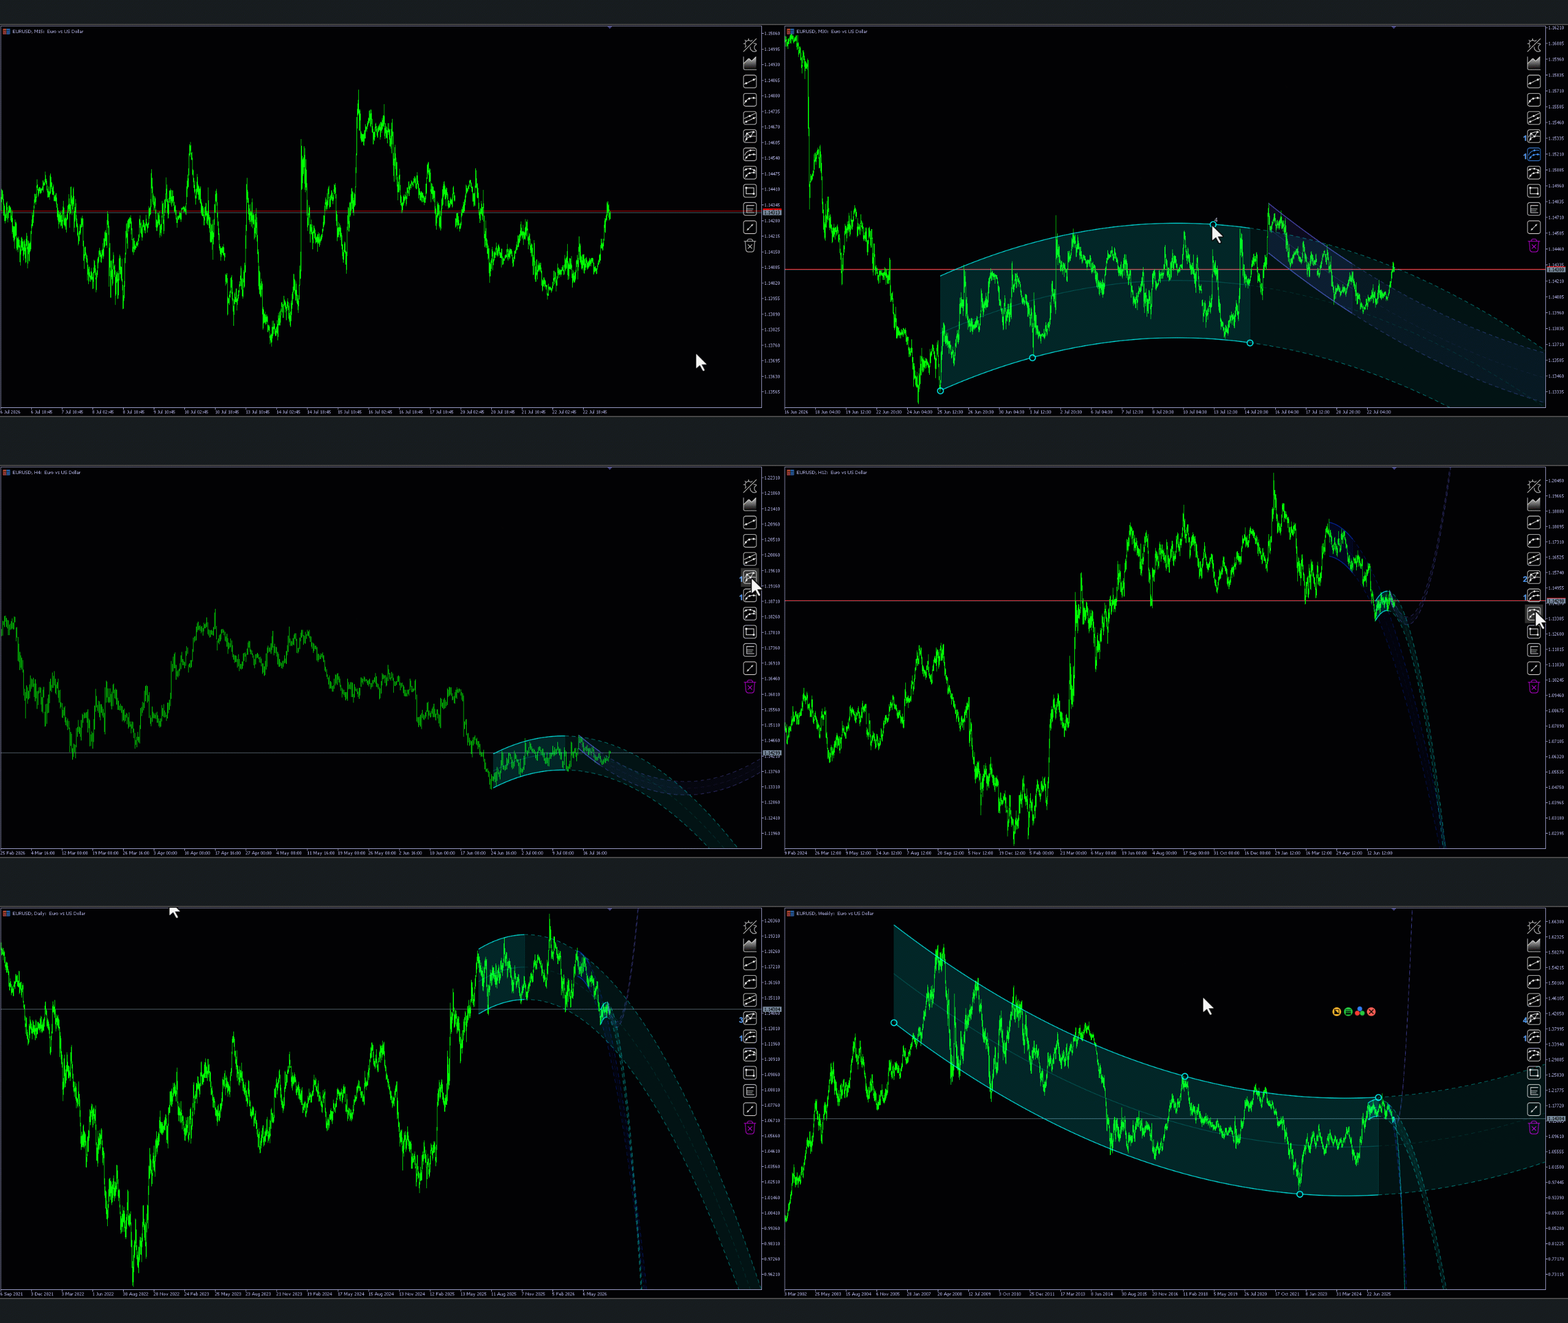
- Your drawings survive timeframe changes — nothing disappears
- Works in the Strategy Tester
- DPI-aware — correct sizing on 4K and high-resolution monitors
- Delete all elements with one click, or remove each one individually
- (bonus) Canvas chart mode: candlesticks / bars / line with gradient and period separators — with no lag behind price while scrolling, unlike a classic Canvas
Under the hood
No objects are added to the chart: everything is drawn on the Canvas, backed by its own internal database that preserves all elements across timeframe changes and terminal restarts.