Volumatic Variable Index Dynamic Averages
- Göstergeler
- Sürüm: 1.0
- Etkinleştirmeler: 5

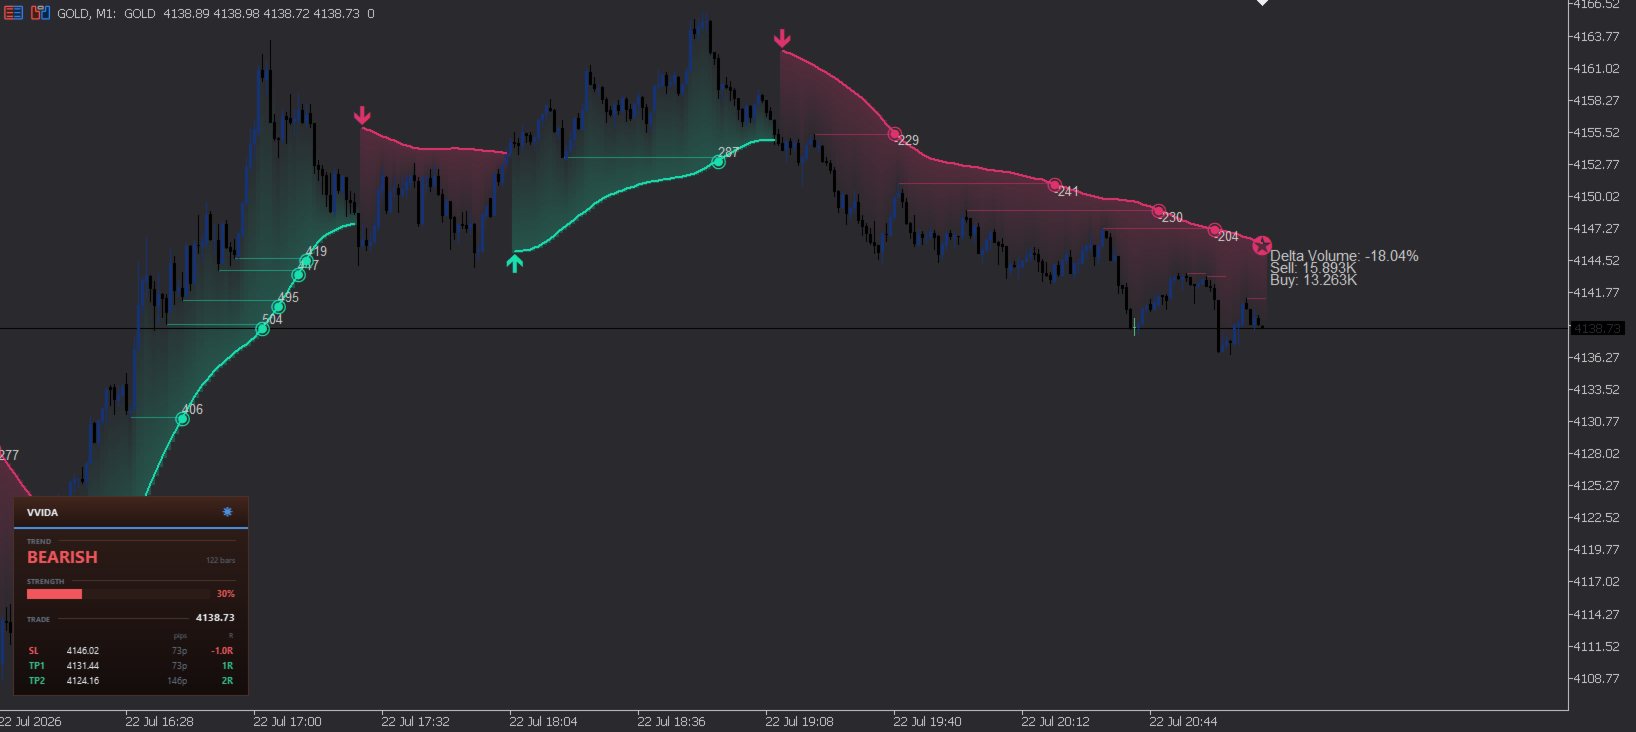
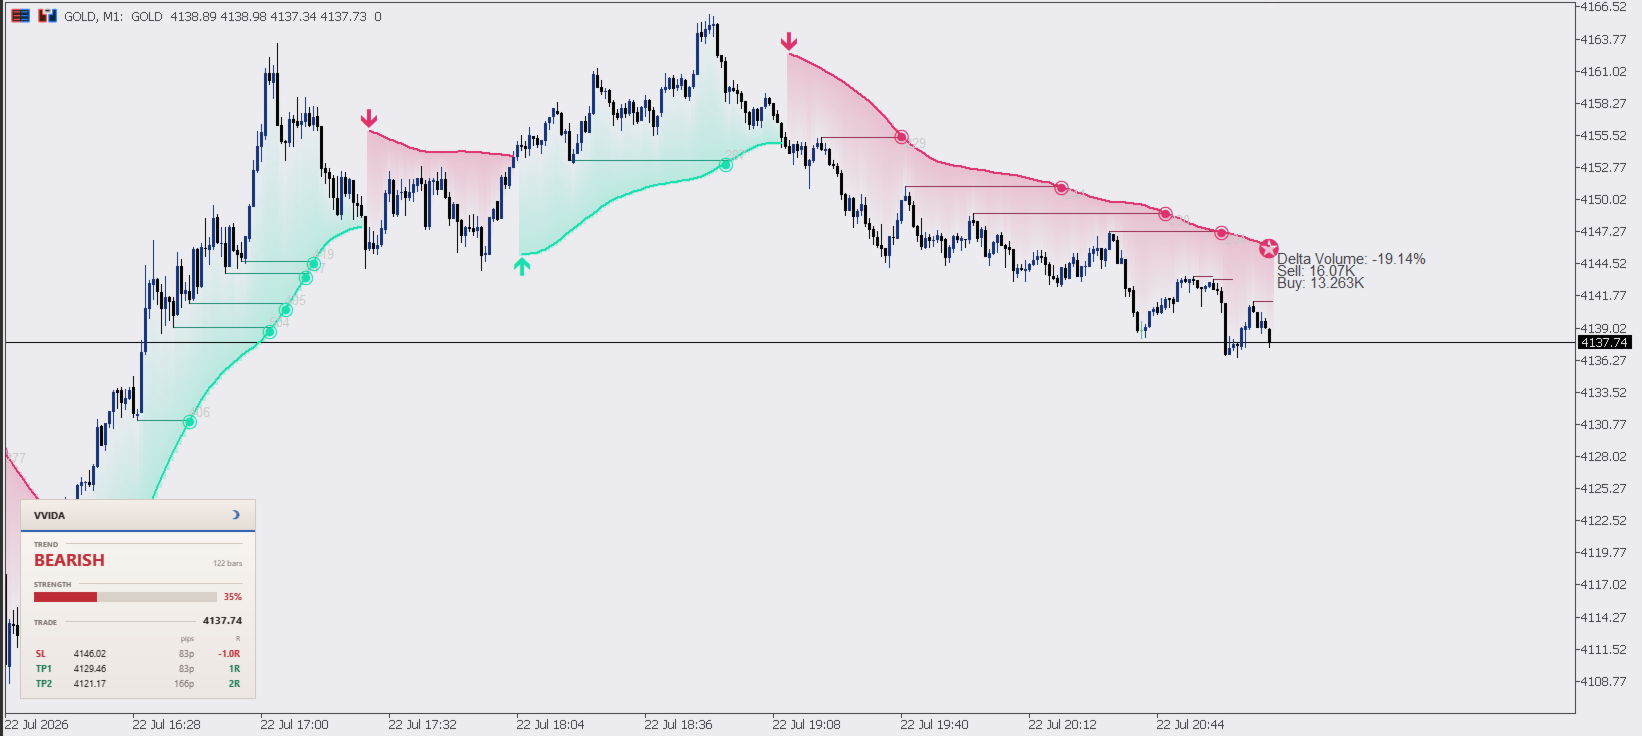
VVIDA draws a momentum-adaptive trend directly on your chart and shows whether the move behind it is actually supported by volume. Instead of using a fixed moving average, it continuously adjusts its speed to market momentum, follows strong trends closely, slows during quiet conditions, tracks untouched liquidity left behind the trend, and measures the buy, sell and delta volume accumulated throughout every trend leg.
It is an indicator for chart analysis only: it draws on the chart, it does not place, modify or close trades, it does not send orders, and it does not manage positions or accounts.
It is the adaptive trend companion to NeuronStructure and NeuronLiquidity, and is built to sit alongside them: structure provides the market framework, liquidity shows where resting orders remain, and VVIDA tells you whether the adaptive trend is strengthening or weakening and whether volume is supporting the move. Native MQL5, no DLLs, non-repainting closed-bar logic, on forex, gold and metals, indices and crypto across any timeframe.
=== HOW IT WORKS ===
Unlike a traditional moving average that applies the same weighting regardless of market conditions, VVIDA continuously adapts its responsiveness using the Chande Momentum Oscillator. Strong momentum makes the line react quickly to price, while weak momentum causes it to slow down and filter out unnecessary noise. The adaptive line is then smoothed to create a clean trend baseline.
Trend changes are confirmed using ATR volatility bands rather than simple moving-average crosses. The trend only changes after a candle closes beyond the active band, preventing false reversals caused by temporary spikes or wicks.
While a trend is active, VVIDA also monitors pivot highs and lows left behind the trend. These become pending liquidity levels that remain on the chart until price eventually sweeps them. Once taken, the sweep is marked together with the amount of resting volume that existed at that level.
At the same time, buy volume, sell volume and delta are accumulated from the beginning of each trend until the next confirmed trend reversal, allowing you to judge whether the move is supported by genuine participation or simply drifting on low activity.
=== WHAT IS INCLUDED ===
| Module | What it does |
|---|---|
| Adaptive VIDYA Trend | Momentum-adaptive Variable Index Dynamic Average using the Chande Momentum Oscillator, smoothed for cleaner trend reading. Teal during uptrends and pink during downtrends. Trend legs are intentionally broken on reversal bars. |
| ATR Flip Bands | Volatility-based trigger bands using a 200-period Wilder ATR. Trends change only after a confirmed closed-bar breakout beyond the band. |
| Gradient Shadow | Smooth gradient fill between price and the trend line, rendered using a chart-aligned canvas for clean scrolling and zooming. Can be disabled. |
| Trend Flip Arrows | Marks every confirmed trend reversal directly on the chart. |
| Liquidity Levels | Detects pivot highs and lows left behind the trend, tracks them until swept, stamps the resting volume, and removes expired levels automatically. |
| Volume Dashboard | Displays accumulated Buy Volume, Sell Volume and Delta since the current trend began. |
| Signal Panel | Displays trend direction, trend duration, momentum strength, suggested entry, stop loss and R-multiple profit targets. Includes live light/dark theme switching. |
| Chart Theme | Optional Neuron dark theme applied automatically when attached. Original chart colours are restored when removed. |
=== HOW TO READ IT ===
The adaptive trend line shows direction. The volume dashboard shows conviction.
When buy volume dominates during an uptrend—or sell volume dominates during a downtrend—the move is supported by participation.
When the delta begins fighting the trend direction, the move is losing conviction and becomes more vulnerable to reversal.
The strength meter is derived directly from the Chande Momentum Oscillator that controls the adaptive average. High readings indicate the trend is reacting aggressively to price, while low readings show that momentum has weakened and the trend has slowed accordingly.
Liquidity levels are destinations rather than entry signals. They represent resting orders that price has not yet collected. Once swept, they become historical references showing how much liquidity was consumed during the move.
=== SUGGESTED SETTINGS (Starting Points) ===
| If you want... | Try |
|---|---|
| Balanced trend following | Use the default settings. |
| Earlier trend reversals | Lower the VIDYA Length and Momentum values. |
| More conservative trend changes | Increase the ATR Distance Factor. |
| Cleaner charts | Disable the Gradient Shadow or Liquidity Levels. |
| Trend confirmation only | Keep the Trend Line and Volume Dashboard enabled while hiding the Signal Panel. |
| Higher-volatility markets | Increase the ATR Distance Factor slightly to reduce false flips. |
=== SPECIFICATIONS ===
| Type | Indicator (chart analysis only) |
|---|---|
| Platform | MetaTrader 5 |
| Markets | Forex, gold and metals, indices, crypto |
| Timeframes | Any timeframe |
| Engine | Native MQL5, no DLLs |
| Trend Engine | Adaptive VIDYA using the Chande Momentum Oscillator |
| Volatility Filter | 200-period Wilder ATR |
| Liquidity | Closed-bar pivot detection with automatic sweep tracking |
| Volume | Buy, Sell and Delta accumulation per trend leg |
| Panel | Trend, strength, trade guidance and R-multiple targets |
| Theme | Optional Neuron dark/light theme |
=== INPUTS ===
| Group | Input | Default | Purpose |
|---|---|---|---|
| Engine | VIDYA Length | 10 | Base period of the adaptive average. |
| Engine | VIDYA Momentum | 20 | Momentum lookback controlling adaptability. |
| Engine | ATR Distance Factor | 2.0 | Distance between baseline and flip bands. |
| Style | Uptrend Colour | Teal | Trend line and bullish elements. |
| Style | Downtrend Colour | Pink | Trend line and bearish elements. |
| Style | Gradient Shadow | true | Draw the adaptive shadow. |
| Signal Panel | Show Panel | true | Display trend and trade information. |
| Signal Panel | Panel Position | Bottom Left | Choose one of nine chart anchors. |
| Signal Panel | Start in Dark Mode | true | Initial chart theme. |
| Signal Panel | TP1 (R) | 1.0 | First target distance. |
| Signal Panel | TP2 (R) | 2.0 | Second target distance. |
| Theme | Apply Theme | true | Apply Neuron chart theme when attached. |
| Theme | Background | Dark Grey | Dark mode background colour. |
| Theme | Bull Candle | Dark Blue | Bull candle colour. |
| Theme | Bear Candle | Black | Bear candle colour. |
Fixed internals: Pivot confirmation = 3 bars, ATR Length = 200, VIDYA smoothing = 15, and liquidity scanning over the most recent 4000 closed bars.
=== COMPATIBILITY ===
- MetaTrader 5, any build.
- Forex, gold and metals, indices and crypto.
- Any timeframe.
- Native MQL5 with no DLLs or external dependencies.
- Non-repainting closed-bar logic for trend changes and liquidity tracking.
=== PAIRS WITH THE NEURON SUITE ===
VVIDA is the adaptive trend component of the Neuron Suite. It pairs naturally with NeuronStructure, which identifies market structure and order blocks, and NeuronLiquidity, which tracks resting liquidity and stop sweeps. Together they provide a complete view of trend, structure and liquidity on a single chart, and fit alongside the rest of the Neuron suite, including NeuronBreakout, NeuronSessions, NeuronTrend, NeuronCloud, NeuronFlow, NeuronIchimoku, NeuronDivergence and NeuronQuant (each sold separately).
=== SUPPORT ===
Customisation requests and questions are welcome through the Comments section on this product page.
NOTE: VVIDA is an indicator for chart analysis only. It draws on the chart, it does not place, modify or close trades, it does not send orders, and it does not manage positions or accounts. The trade panel is provided for analytical guidance only. All trading decisions and execution remain entirely your responsibility.