PCT Price Simulator
- Yardımcı programlar
- Sürüm: 1.0
- Etkinleştirmeler: 10

This indicator was specifically designed for developers, quantitative traders, and mentors looking for total control over live price action, whether for educational purposes, testing strategies, or validating indicators without waiting for real market movements.
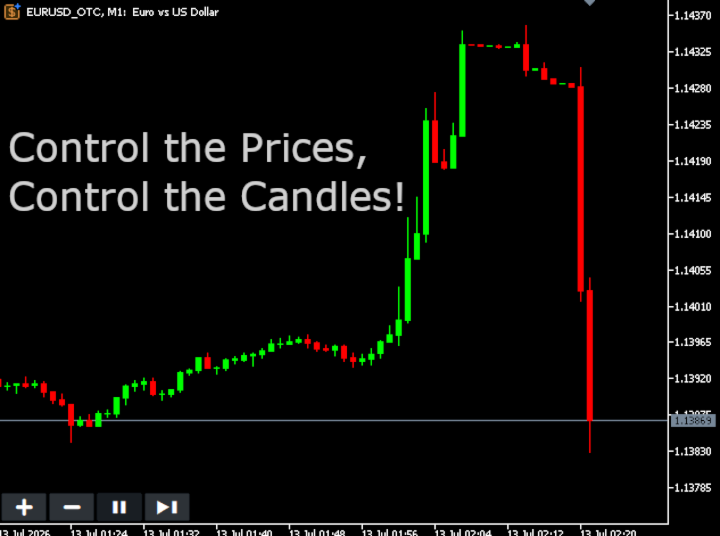
The PCT Price Simulator generates a fully automated, customized offline chart (_OTC), allowing you to manipulate candle directions, test setup reactions, and validate trading strategies in seconds.
Technical Highlights
-
Total Independence: No external quote files (.quote), third-party bots, or complex setups required. Just drag and drop it onto your chart to begin.
-
Smart Auto-Installation: Automatically clones the properties of the current real asset (Forex, Crypto, or Indices) and opens the offline window instantly with the indicator applied.
-
Price "God Mode": Control price tick-by-tick or skip entire candle closes to test transitions and candle completion behaviors.
Configuration Parameters (Inputs)
-
One Tick Variation
-
True: Price moves strictly 1 Tick Size at a time. Ideal for scalping tests.
-
False: Price fluctuates with randomized multi-tick steps, simulating natural market volatility with realistic bodies and wicks.
-
-
Trend Type
-
Normal: Purely random price action (50% Bullish / 50% Bearish probability).
-
Uptrend: The algorithm favors upward price movements to test bullish indicators and buying setups.
-
Downtrend: The algorithm favors downward price movements to test bearish indicators and selling setups.
-
Custom: Grants you absolute algorithmic control over the candlestick sequence (configured in the input below).
-
-
Favorable Trend Probability (%)
-
Defines the mathematical strength of the selected trend. For instance, if set to 70% under Uptrend mode, each new price tick has a 70% probability of going up and only a 30% chance of going down. Allows you to simulate everything from smooth, steady trends to explosive, highly directional market moves.
-
-
Custom Trend
-
Allows you to program an exact sequence of candles using simple letters. Example: A, B, A, A (Where A = Bullish/Up Candle and B = Bearish/Down Candle). Perfect for testing specific Price Action patterns like Engulfing, Harami, or color-based sequence logic.
-
-
Show On-Screen Buttons
-
Toggle the visibility of the visual control panel on your chart to keep your screen completely clean during tests or live training sessions.
-
Hotkey Mapping / Quick Controls
Manage the entire simulation directly through on-screen buttons or via keyboard hotkeys with zero latency:
| Hotkey | On-Screen Button | Action Performed |
|---|---|---|
| A | [+] | Forces the price to Move Up instantly. Hold Shift to larger price jumps. |
| S | [-] | Forces the price to Move Down instantly. Hold Shift to larger price jumps. |
| D | [>] | Skips Candle / Immediately opens a new bar (advances the virtual timeframe). |
| P | [P] | Pauses / Resumes automated random price generation. |
📌 Note: When the simulator is in Pause ( P ) mode, the engine continuously feeds Dojis into the chart. This keeps the MT5 engine clock and indicator buffers updating live, ensuring that any EA or indicator attached to the offline chart never freezes or loses temporal synchronization.