True Visual Trend
- Göstergeler
- Sürüm: 1.0
This indicator is not only for trading but also for learning, thanks to it, you can learn to identify trend, support and resistance.
The video below shows an example of opening a position on gold only buy.
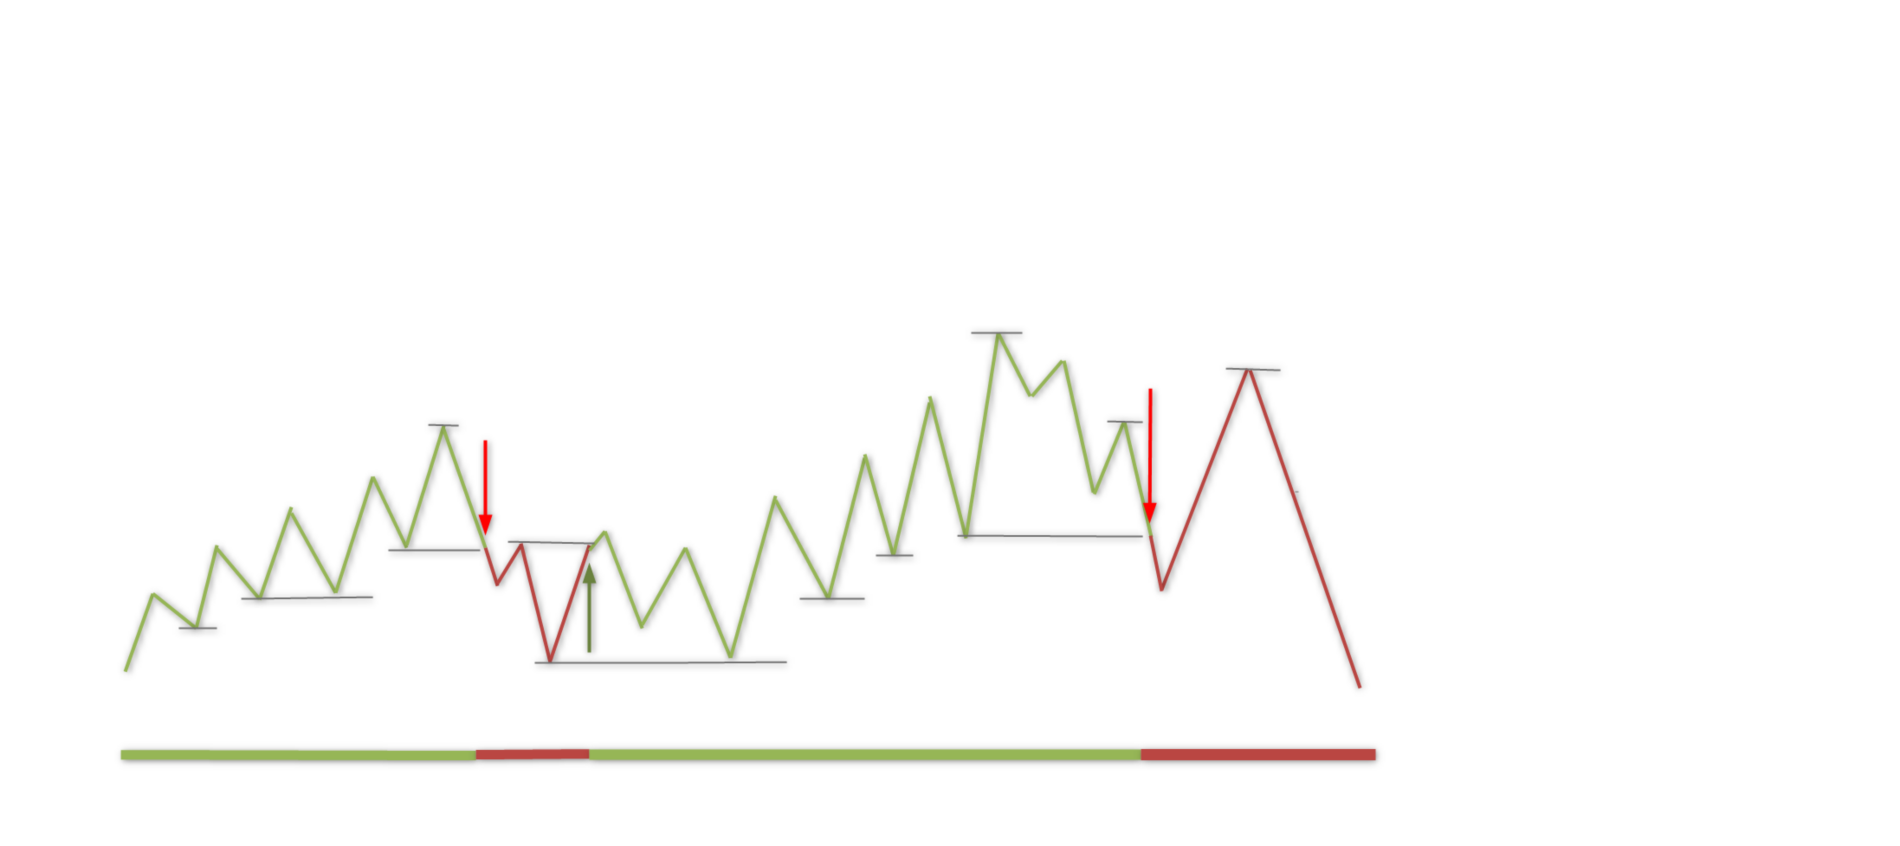
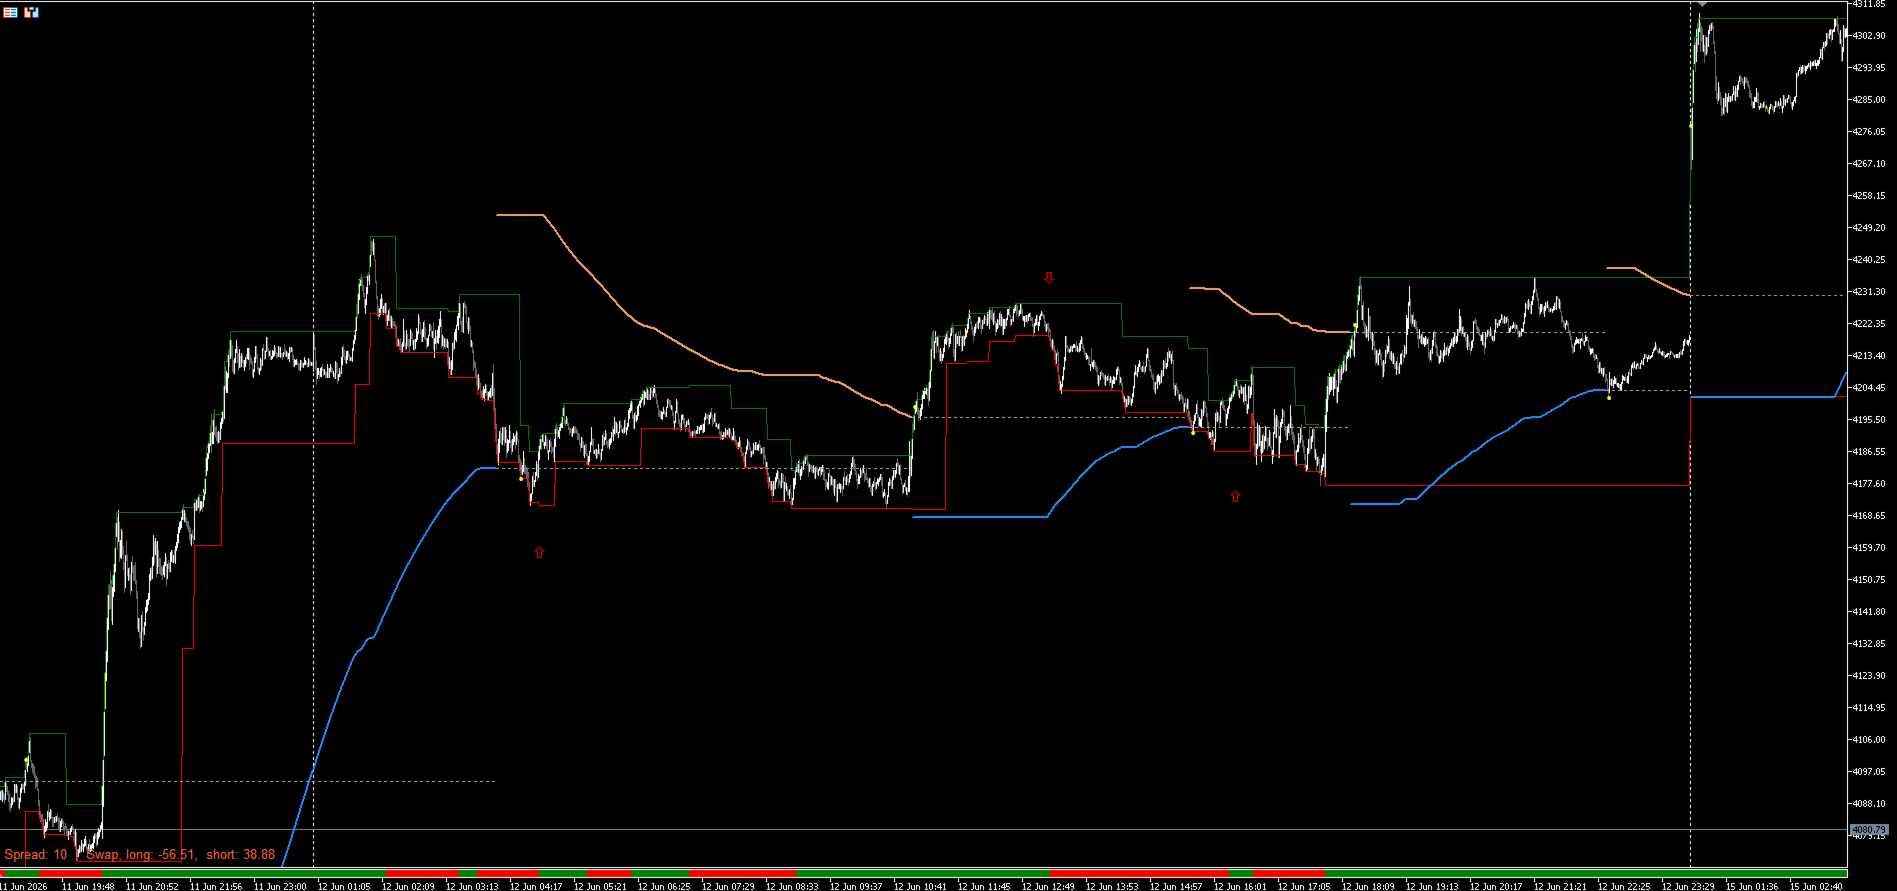
You've probably heard about trend theory, where higher highs and higher lows indicate an uptrend, and lower highs and lower lows indicate a downtrend. This indicator determines this trend. You just need to enter the minimum distance between bars.
Additionally :
-Sound alert on trend change.
-Alert Notification
-Alert Notification on your mobile phone
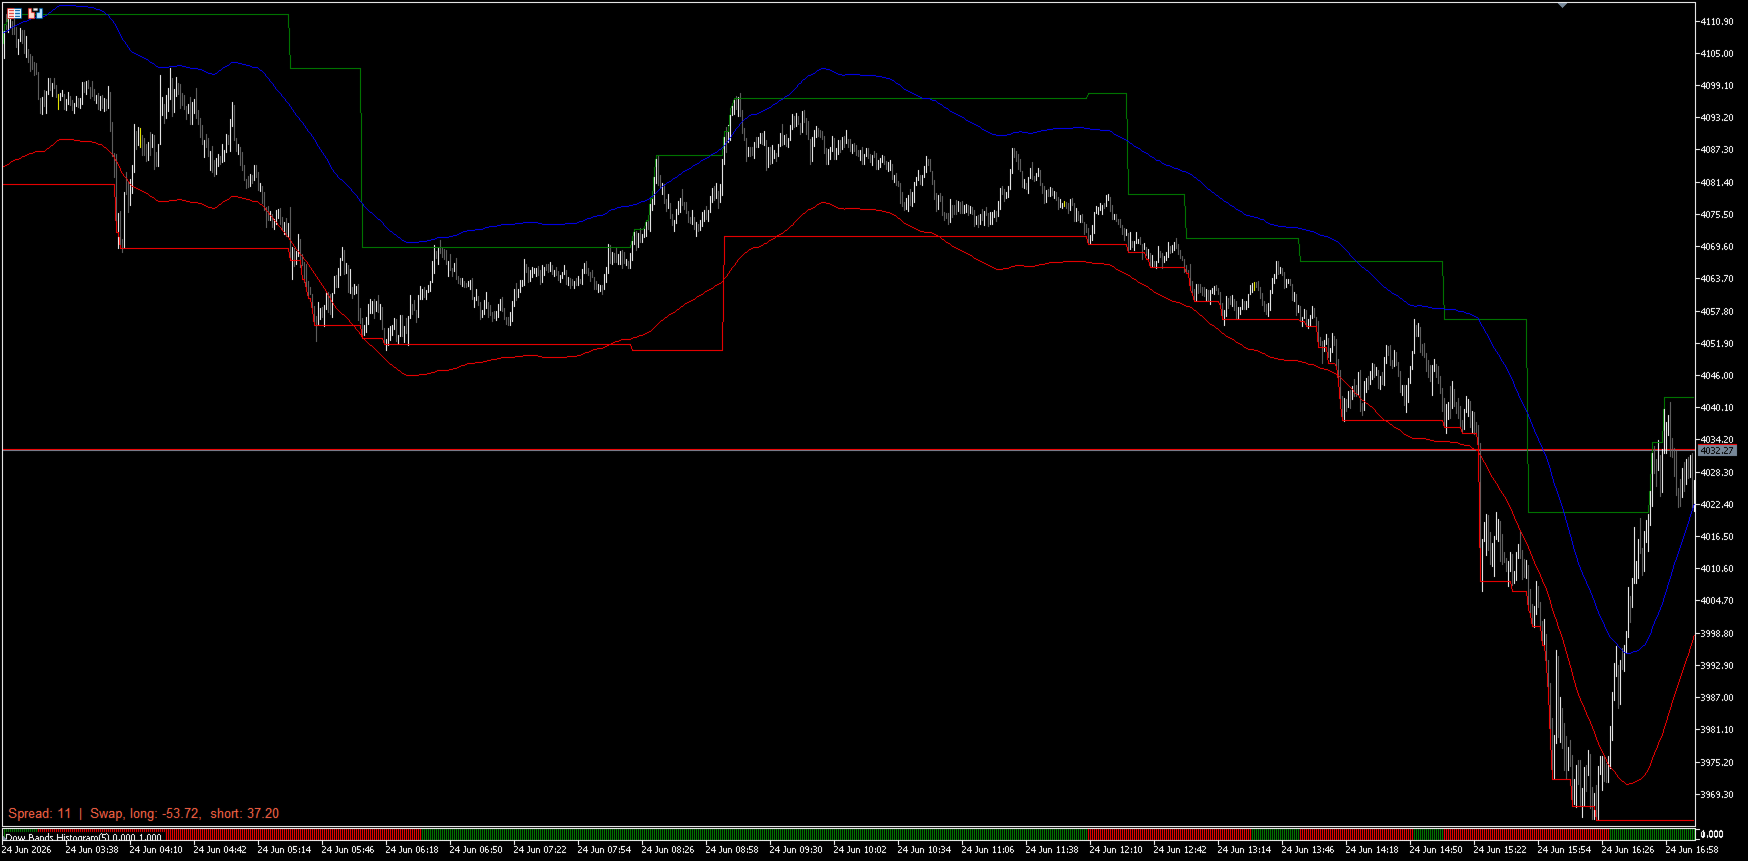
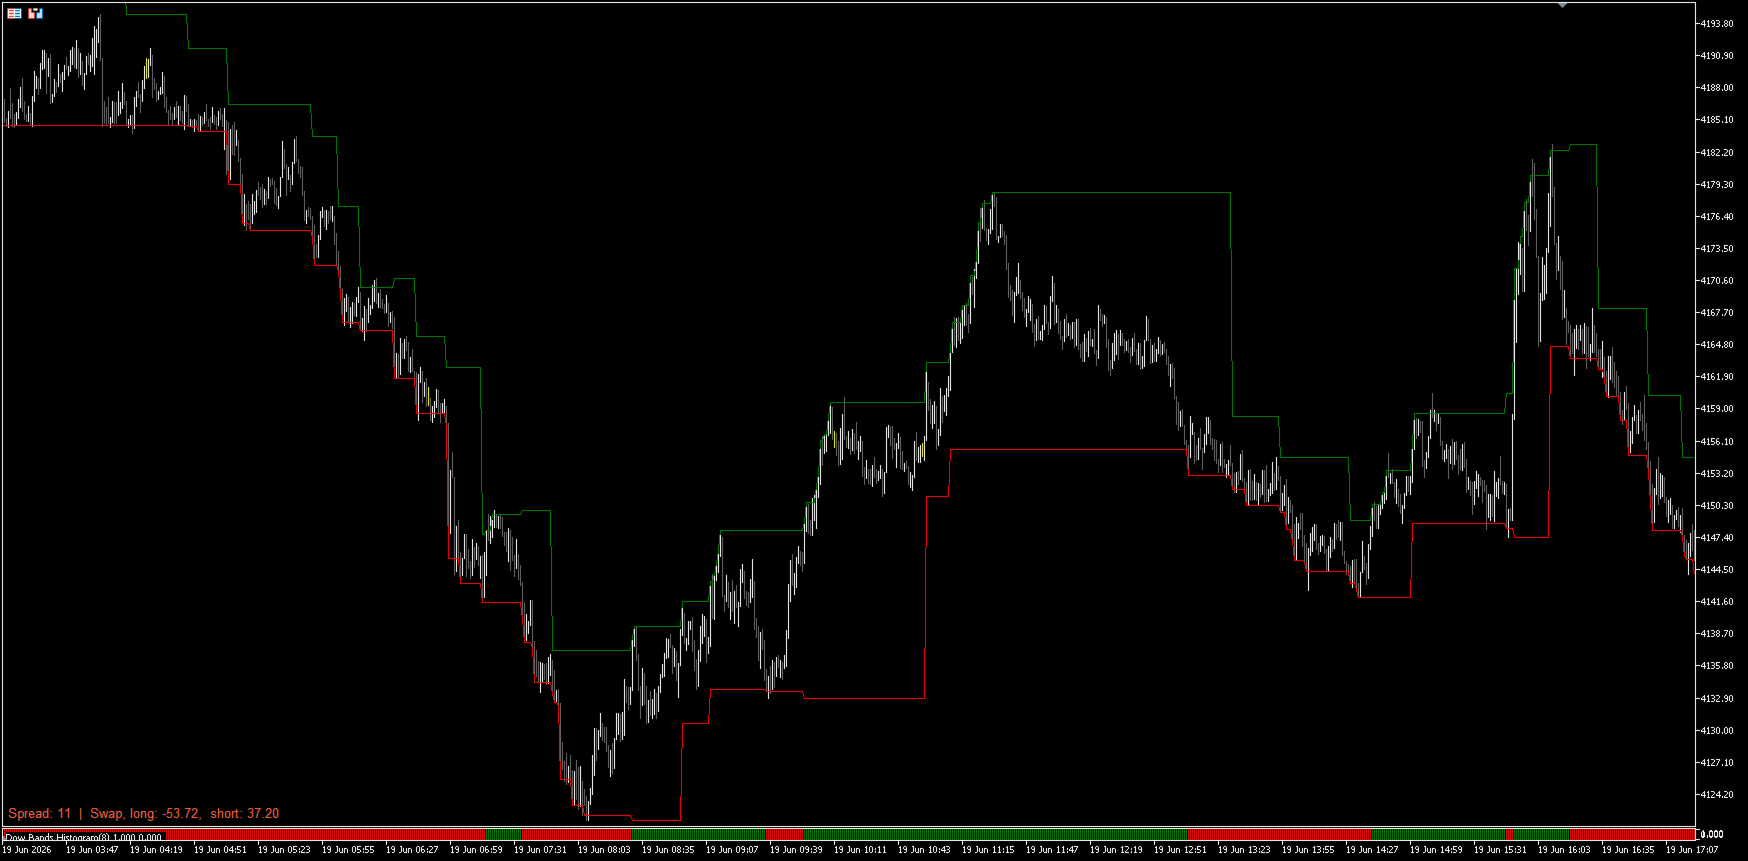
TVT identifies the nearest support and resistance levels, visually displaying a channel whose breakout may signal the opening of a position.
The indicator does not repaint and displays the channel across the entire price history.
The only thing the user needs to enter is the minimum distance between bars.
Check various combinations to trade with the trend.
Many traders open positions as soon as they see a correction, without waiting for confirmation that the correction has ended.
Personally, I prefer a strategy consisting of three steps.
- trend
- correction
- signal
You can identify the trend using an MA cross or a TVT with a higher number, or simply by going long on gold and indices.
The correction can be identified using Envelopes, Bollinger Bands or another indicator.
The signal is a breakout from the TVT channel.
This way, you avoid "catching falling knives" and only open positions after a signal.
This is a free version which will be available for download only until the end of July.
Download and try it out before the free version disappears.