Thrust Map Real Time mt5
- Göstergeler
- Sürüm: 2.3
- Etkinleştirmeler: 5

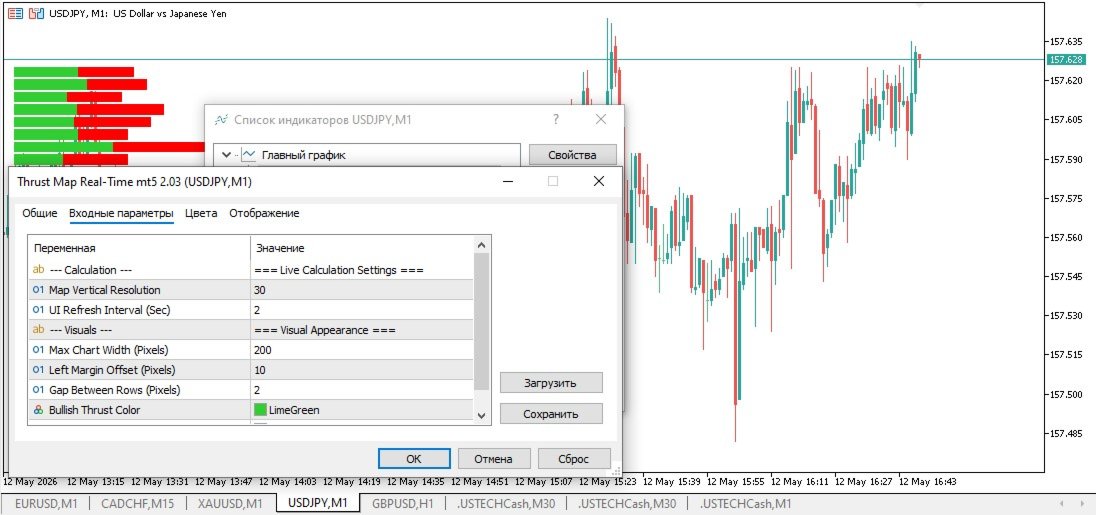
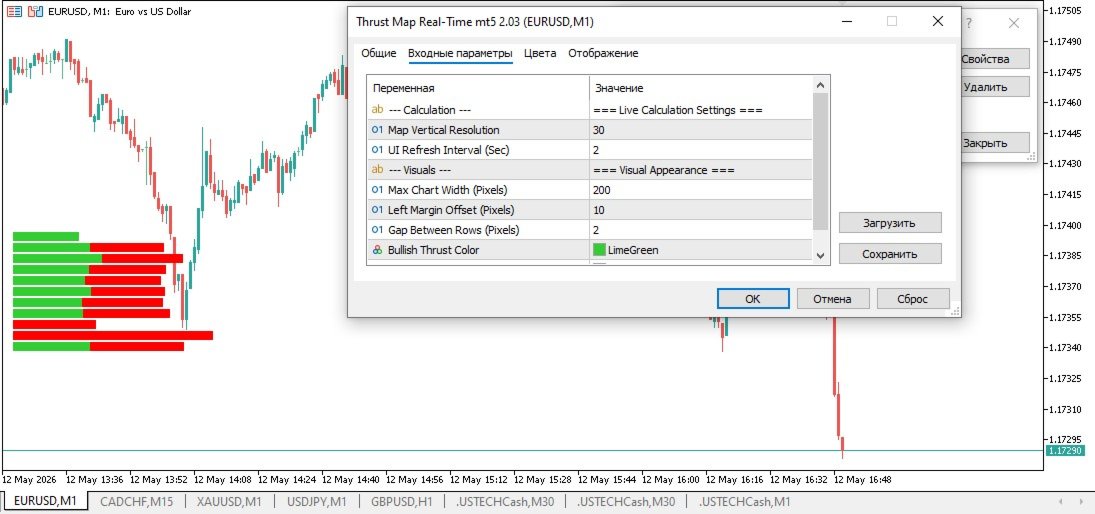
Thrust Map Real-Time Indicator
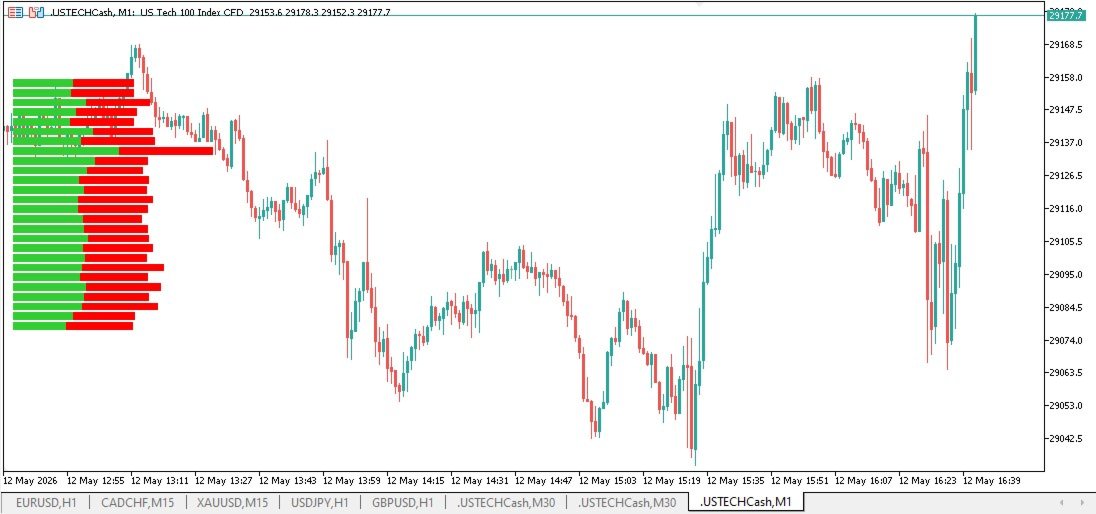
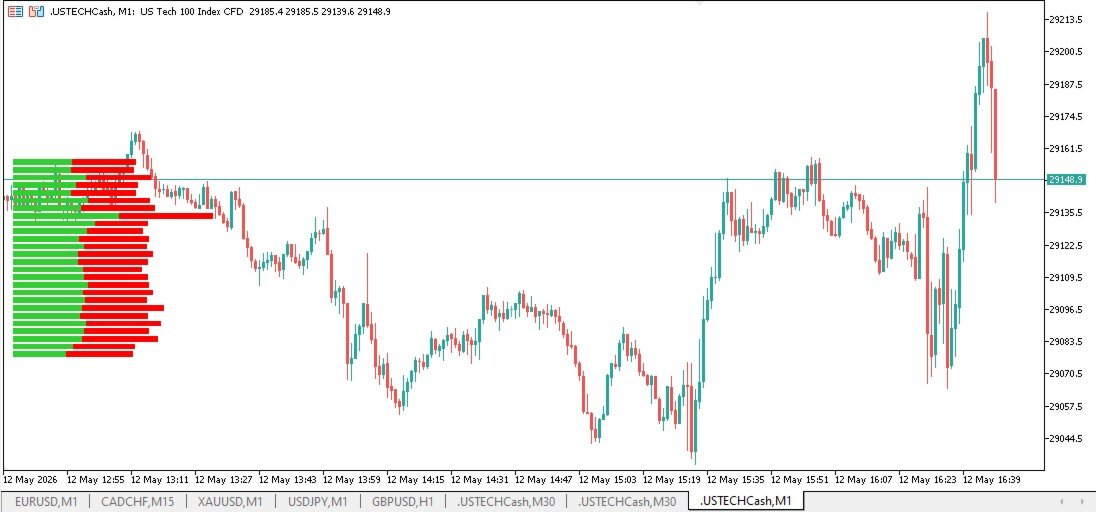
Unlike standard Volume Profiles that aggregate tick counts by price level, this indicator tracks the number of candles that fall within each level's range. The profile accumulates data only from the moment of launch and categorizes it into Buy and Sell by analyzing the direction of every tick. It does not repaint.
The indicator displays vertical and horizontal levels where the price travels the "greatest distance with the fewest actions" (on average per candle). Initially, when first attached to the chart, nothing is displayed. As it gathers live tick history, it begins to render the volume histogram.