CS Pro
- Göstergeler
- Sürüm: 1.0

CS Pro
An oscillator that measures market cycles through sine waves.
The market doesn't always move randomly—it breathes in cycles. The CS Pro (CSO) identifies these cycles by mathematically decomposing price into sinusoidal components to extract the current market phase.
How it Works
The principle is straightforward: the trend is removed from the price, and the remaining cyclical component is converted into a phase angle via trigonometric projection. The resulting sine wave is highly correlated with price movement—hence the name "Correlated."
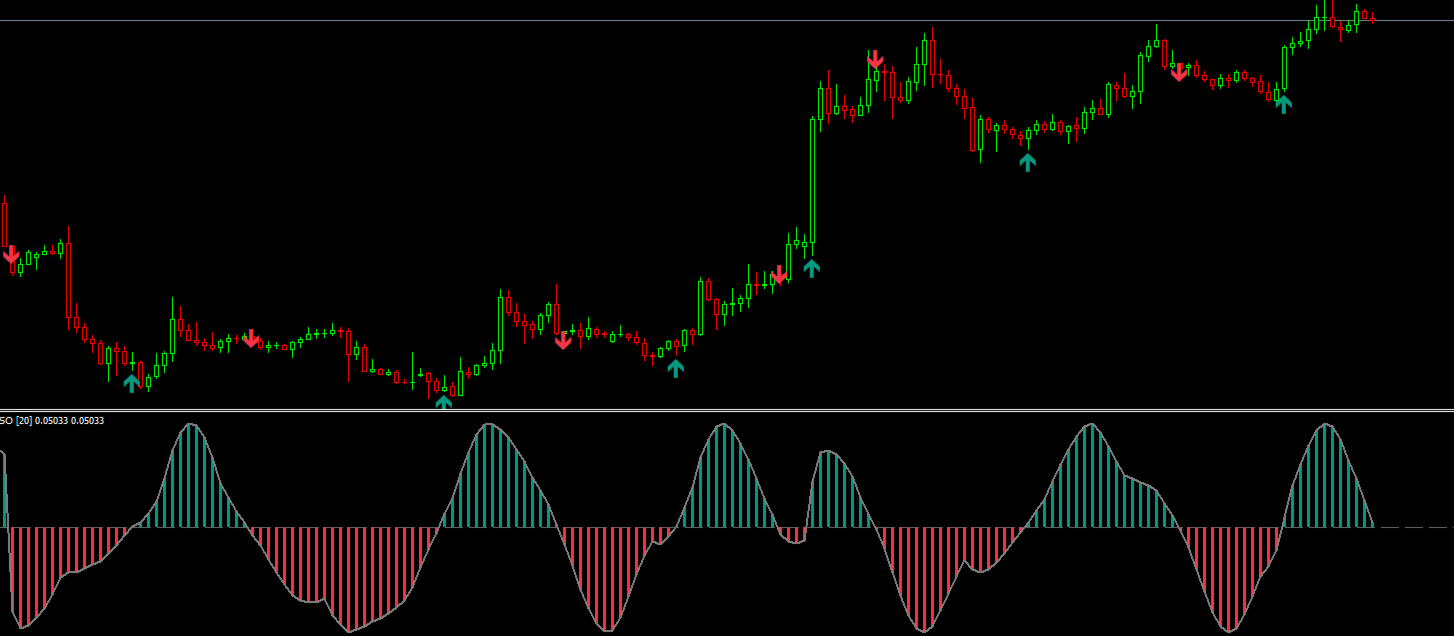
Visual Structure
The indicator consists of three layers:
-
Central Gray Line: Continuously displays the full value of the oscillator.
-
Green Histogram: Fills the area above the zero line.
-
Red Histogram: Fills the area below the zero line.
-
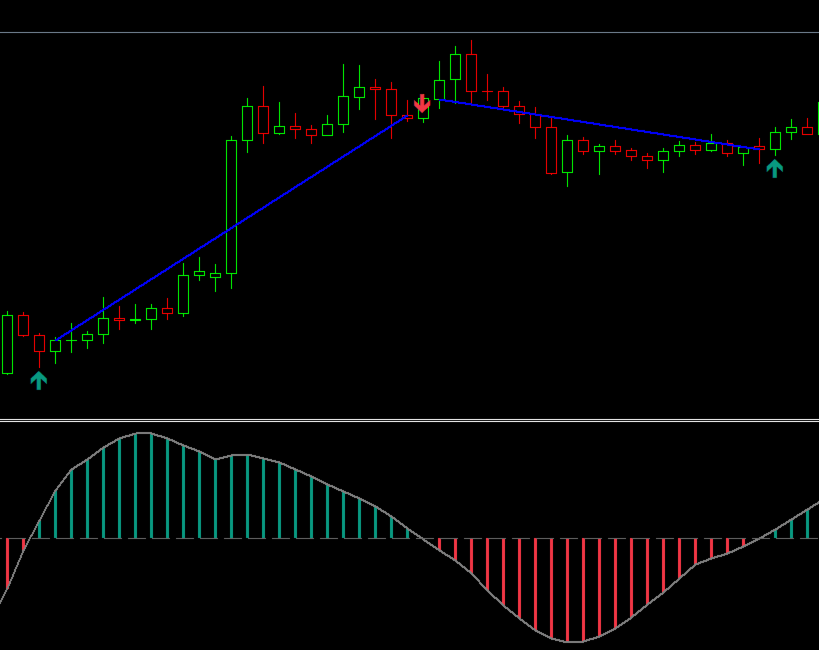
Arrows: An arrow signal appears on the main chart at the exact bar where the oscillator crosses the Zero Line.
Application
-
Bullish Momentum: When the oscillator crosses above the zero line, momentum shifts to the positive side.
-
Bearish Momentum: When it crosses below the zero line, momentum shifts to the negative side.
-
Signals: Arrows mark these transitions directly on the price chart.
Pro Tip: For the best results, it is recommended to use this oscillator in conjunction with trend filters to avoid "whipsaws" during flat market conditions.