MTF MultiAsset Channel Panel

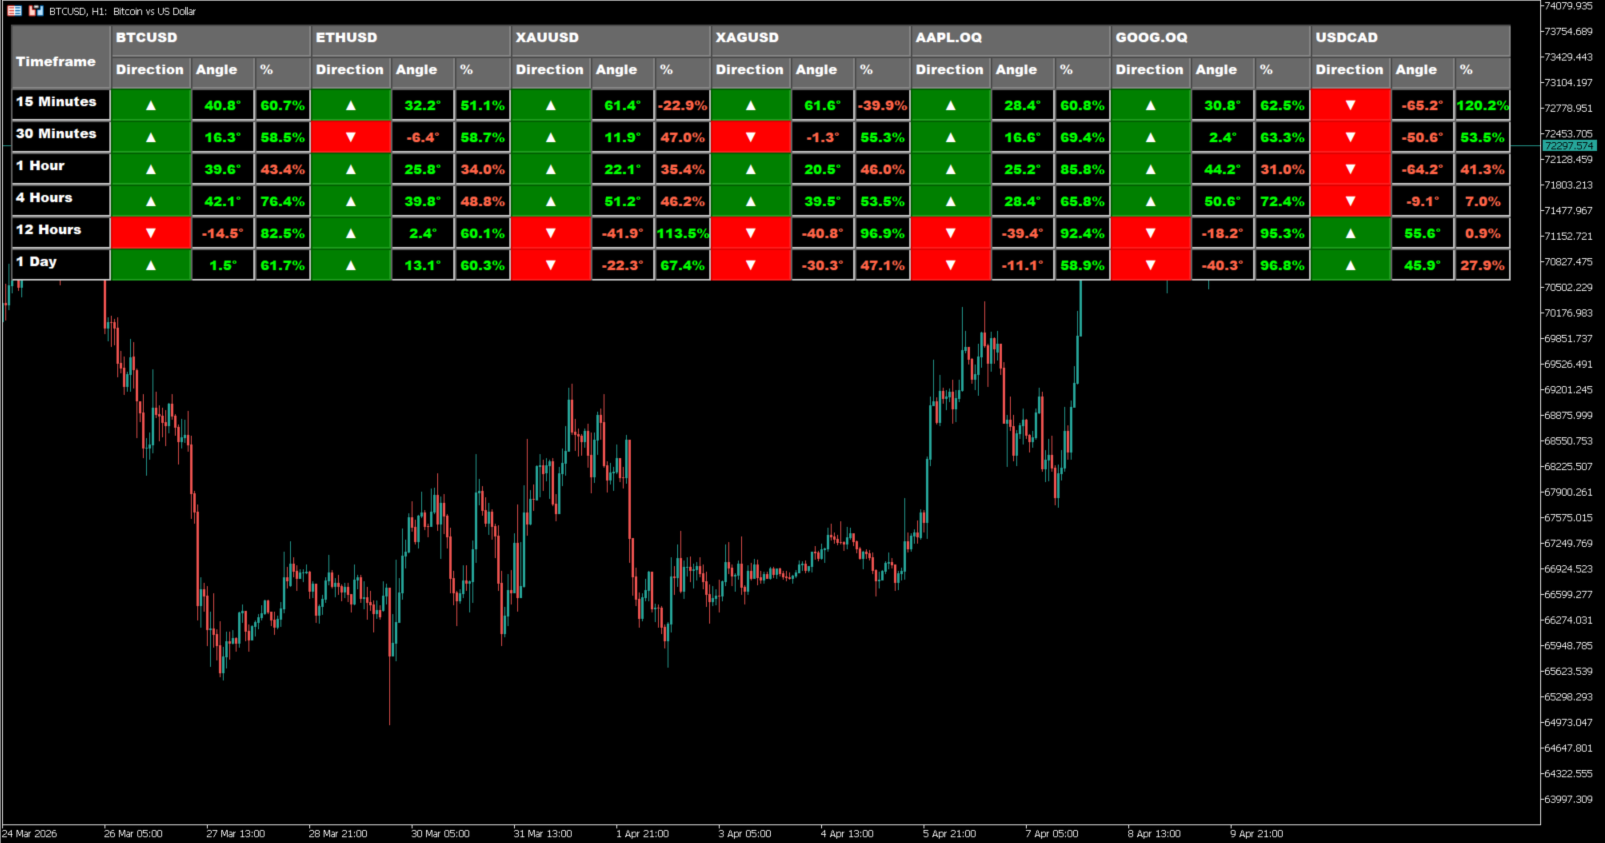
MTF Multi-Asset Channel Panel is a multi-timeframe and multi-symbol indicator for MetaTrader 5 that summarizes channel structure in a compact table directly on the chart.

Instead of drawing several channel objects at the same time, the indicator organizes the most relevant channel information into a structured panel. For each enabled timeframe and each selected symbol, it shows three practical elements: channel direction, channel angle, and the current price position inside the channel in percentage terms.

The purpose of this panel is to help the trader read market context quickly across several symbols and timeframes without filling the chart with overlapping objects. With one glance, it becomes easier to see whether a symbol is moving in the same direction across multiple timeframes, whether the slope is meaningful or flat, and whether price is located near the lower part, middle part, or upper part of the channel.

The indicator can be used for discretionary analysis, symbol comparison, and multi-timeframe filtering. It is especially useful for traders who want a channel-based summary without switching charts continuously or stacking multiple drawings on the screen. This version focuses on a panel view that keeps the information visible, organized, and easy to compare.

How it works

For every configured symbol and enabled timeframe, the indicator loads a lookback window of price data and builds a channel state from that historical segment. The slope can be calculated either with a simple two-point method or with linear regression. The applied price used for the slope can also be selected by the user.

After the slope is calculated, the indicator derives the channel direction, the normalized angle in degrees, and the current price position inside the channel as a percentage. The percentage is calculated from the current live price relative to the channel structure projected from the most recent calculated state. If the price series is not ready yet, the panel shows a synchronization state. If a symbol is invalid or there is not enough data, the panel shows a non-available state instead of a misleading value.

What the panel shows

Timeframe row
Each row represents one timeframe. The current version supports 1 Minute, 5 Minutes, 15 Minutes, 30 Minutes, 1 Hour, 4 Hours, 12 Hours, and 1 Day. Disabled rows can be hidden or kept visible depending on the panel settings.

Symbol groups
Each selected symbol appears as a group of three columns in the header, which makes it possible to compare several symbols side by side in the same panel. If the symbol list is empty, the indicator uses the current chart symbol.

Direction
Direction shows the current channel bias for that symbol and timeframe. Up, down, and flat states are displayed visually so the trader can identify alignment or conflict between timeframes more quickly.

Angle
Angle shows the inclination of the channel in degrees. This helps distinguish between a structured move and a flatter or less directional condition.

Percent (%)
Percent shows the current live price position inside the channel as a percentage. This helps the trader judge whether price is near the lower side of the channel, around the middle, or near the upper side.

Status states
If the series is still loading, the panel can show a sync state. If the symbol is not valid or data is not available, the panel shows a non-available state. This helps avoid reading incomplete information as a valid signal.

Practical uses

  • Compare channel direction across several symbols and timeframes
  • Detect alignment or conflict between short-term and higher-timeframe structure
  • Check whether the slope is strong, weak, or flat
  • See whether price still has room inside the channel or is already extended
  • Reduce chart clutter compared with workflows that require multiple channel drawings
  • Keep a structured market overview on one chart window

Designed for

  • traders who use multi-timeframe confirmation
  • traders who monitor more than one symbol
  • discretionary traders who want fast visual context
  • workflows that use direction, slope, and price location as context filters
  • users who prefer a summary panel instead of many overlapping chart objects

Main features

  • Multi-timeframe channel panel
  • Multi-symbol comparison
  • Direction, angle, and price position in one table
  • Configurable symbol list
  • Selectable slope method
  • Selectable applied price for slope calculation
  • Option to calculate using closed bar or current bar
  • Adjustable refresh interval
  • Adjustable panel location and dimensions
  • Optional display of disabled timeframe rows
  • Debug mode for development or troubleshooting
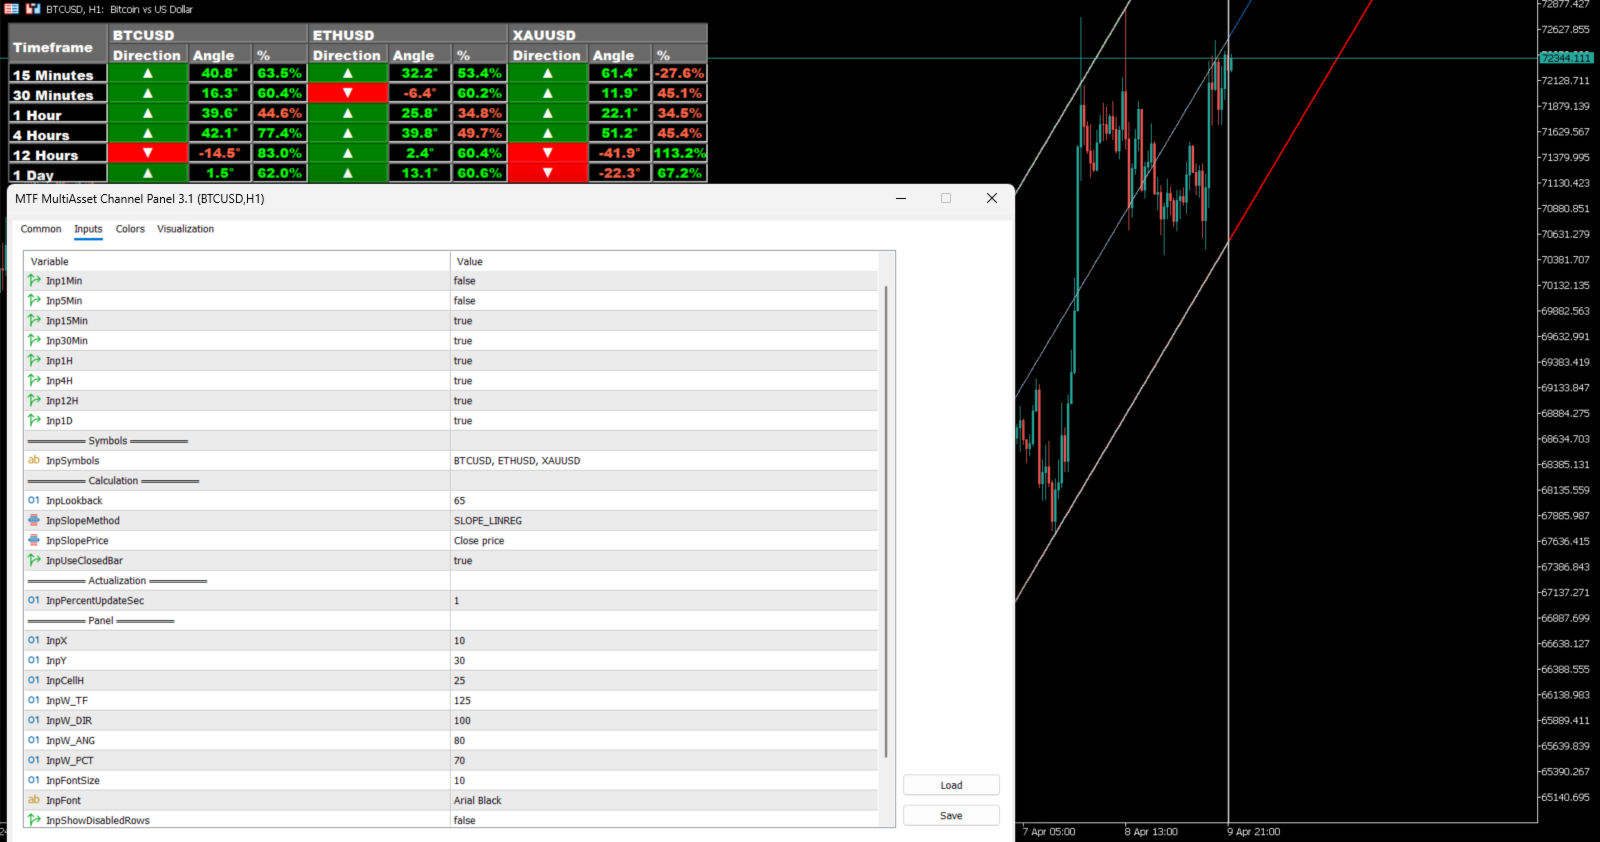
Input Parameters

Timeframes

Inp1Min – enables or disables the 1 Minute row
Inp5Min – enables or disables the 5 Minutes row
Inp15Min – enables or disables the 15 Minutes row
Inp30Min – enables or disables the 30 Minutes row
Inp1H – enables or disables the 1 Hour row
Inp4H – enables or disables the 4 Hours row
Inp12H – enables or disables the 12 Hours row
Inp1D – enables or disables the 1 Day row

Symbols

InpSymbols – list of symbols to display in the panel. If left empty, the indicator uses the current chart symbol. The code normalizes separators, so the symbol list can be prepared from common text formats before being parsed into the panel.

Calculation

InpLookback – number of bars used to build the channel structure for each symbol and timeframe
InpSlopeMethod – slope calculation method:

  • SLOPE_2POINTS uses the oldest and newest price in the lookback range
  • SLOPE_LINREG uses a linear regression slope over the lookback range
    InpSlopePrice – applied price used in the slope calculation. Supported options come from MetaTrader price constants such as Open, High, Low, Median, Typical, Weighted, and Close
    InpUseClosedBar – when true, calculations use the last closed bar; when false, calculations can use the current forming bar

Update

InpPercentUpdateSec – refresh interval in seconds used to update live price position and panel values

Panel

InpCorner – chart corner used to anchor the panel
InpX – horizontal offset in pixels from the selected corner
InpY – vertical offset in pixels from the selected corner
InpCellH – row height of the panel cells
InpW_TF – width of the Timeframe column
InpW_DIR – width of each Direction column
InpW_ANG – width of each Angle column
InpW_PCT – width of each Percent column
InpFontSize – text size used in panel labels
InpFont – font name used in panel labels
InpShowDisabledRows – when true, disabled timeframes remain visible as inactive rows; when false, they are hidden from the layout

Debug

InpDebugMode – enables journal messages for debugging and configuration checks

Notes

This indicator is designed as a decision-support tool. It does not open trades or execute automated trading operations. Its purpose is to summarize channel structure in a clear panel so the trader can read context with less chart noise and faster comparison across symbols and timeframes.


Önerilen ürünler
Fixed Volume Profile
Carlos Pascual Perez Maturano
This indicator, titled "Fixed Volume Profile.mq5", is a custom tool for MetaTrader 5 (MQL5) designed to calculate and display a Volume Profile over a user-defined fixed time range. The Volume Profile shows the distribution of trading volume at different price levels during a specific period, helping to identify areas of high activity (such as Points of Control or POCs) and volume-based support/resistance areas. Main Functionality: Interactive Range: The indicator creates two vertical lines on
FREE
Advanced Volume Profile Liquidity Analysis via Custom Area Selection The Advanced Manual Volume Profile is a precision tool for MetaTrader 5 designed to deconstruct market structure through price-level volume analysis. Unlike static profiles, this indicator exclusively processes the price and time range defined by the user via a rectangle object, offering a surgical view of the market auction. Elite Technical Specifications Dynamic Algorithm: Real-time calculation (400ms refresh rate) based on t
The indicator calculates ZigZag using the classic algorithm with three parameters: Depth, Deviation, and Backstep. Its main function is detecting and visualizing repaints — moments when the last ZigZag point shifts to a new bar. Upon loading, the indicator performs a simulation over the specified history depth. The algorithm sequentially recalculates ZigZag for each bar, comparing the current position of the last point with the previous one. If a shift is detected, a repaint line appears on the
FREE
MTF Channel Panel
Manuel Alejandro Montoya Martinez
MTF Channel Panel is a visual multi-timeframe panel for MetaTrader 5 that summarizes channel behavior and allows optional channel drawing for each timeframe without overloading the chart. Instead of forcing the trader to view multiple channels at the same time, this indicator organizes the most important information into a clean and easy-to-read panel. Each timeframe is reduced to three essential elements: direction , angle , and price position inside the projected channel . In addition, each r
️ Trade Manager oneclick  ( Reverse Trade,  Partial Close,  Breakeven, Close All Running Trade )   control – Smart Manual Trade Control for MT5 Trade Manager oneclick control is a powerful yet lightweight trade management utility built for manual traders who want precise control over their open positions — directly from the MT5 chart. This EA does not open or close trades automatically based on any strategy. It simply provides one-click management tools to handle your running trades efficient
FREE
Price Alerts Advanced Price Target Notifications
Elsayed Mohamed Kamal Elsayed Abdelwadod
Price Alerts - Advanced Price Target Notifications Never miss important price levels again! Price Alert Pro lets traders: • Set unlimited price target alerts • Receive instant desktop and mobile notifications • Visually track progress to each target • Customize alert sounds and frequencies • Manage all alerts from an intuitive panel Perfect for: - Breakout traders waiting for key levels - News traders monitoring reaction points - Position traders managing multiple targets - All traders who c
About indicator > The indicator is a function based on one value (open/high prices up to now) and then it is a mathematical representation of the whole function that is totally independent from any else values. So, if you ask yourself will the future be as it is on the graph... I can tell you - as it was the same as the trading function up to the moment "now"... In conclusion, the point of the indicator is  to try to show the future of the trading function into eternity. The graphic is sometime
Hot Zones MT5
Innovicient Limited
This indicator simplifies your entry zones by displaying the areas where you can plan your entry that potentially could give you high risk/reward ratios. Other than picking the most optimal entry points, the Hot Zone indicator can act as your typical support/resistance indicator for pullbacks for all timeframes. You can use this indicator as the only trading indicator or use it with another indicator for reentry purposes.  Besides, when using Hot Zones, the risk/reward ratio should be well abov
Daily & Composite Volume Profile   This is a professional-grade market profile tool designed for MetaTrader 5. It utilizes a   Dual-Profile System   to visualize supply, demand, and liquidity concentrations. Key Features Left Side: Daily Session Profiles Automatically identifies the start and end of every trading day. Generates a unique Volume Profile for each individual day. Allows you to see how value migrated from yesterday to today (e.g., Is today's volume higher or lower than yesterday?).
Technical Analysis Dashboard Pro
Andres Felipe Carvajal Rodriguez
Technical Analysis Dashboard Pro (TADashboard Pro) – Birleşik Teknik Analiz Sistemi TADashboard Pro , birden fazla göstergeyi ( indikatör ) ve zaman dilimini ( timeframe ) tek bir görsel arayüzde birleştiren gelişmiş bir teknik analiz panelidir. Hassasiyet ve verimlilik arayan yatırımcılar ( trader ) için tasarlanan bu sistem, 8 farklı zaman diliminde eş zamanlı olarak 7 osilatör ve 4 hareketli ortalamayı analiz eder ve karar verme sürecini basitleştiren normalize edilmiş puanlar üretir. Temel Ö
FREE
Delta Profile Volume
Teresinha Moraes Correia
Technical Description of the Indicator – Delta Profile for MetaTrader 5 The Delta Profile is an indicator developed for MetaTrader 5 focused on detailed analysis of volume flow within a defined range of candles. It organizes and displays information about the imbalance of positive volumes (associated with upward movements) and negative volumes (associated with downward movements) at different price levels. The result is a clear view of the chart points where the highest concentration of trades o
Market Profile Heat indicator  — is a classic Market Profile implementation that can show the price density over time, outlining the most important price levels, value area, and control value of a given trading session. This indicator can be attached to timeframes between M1 and D1 and will show the Market Profile for daily, weekly, monthly, or even intraday sessions. Lower timeframes offer higher precision. Higher timeframes are recommended for better visibility. It is also possible to use a fr
İşlem hataları nedeniyle para kaybetmeyi bırakın. Kesin girişler ve tam risk kontrolü ile işlem yapın. MT5 için manuel trading paneli (scalping ve intraday). Tek tıkla işlem, sıkı risk yönetimi ve disiplin sistemi. Yüksek hızlı scalping için tasarlanmıştır, doğru giriş ve tutarlı execution sağlar. Daha hızlı işlem yap. Daha akıllı işlem yap. Kontrol sende olsun. Tereddüt, hata ve duygusal kararları ortadan kaldırır. Hataları önleyen ve disiplin sağlayan sistem. H
Session Control session indicator. Depending on from which continent the trading activity takes place in a certain period, the entire daily routine is divided into several trading sessions. Due to the fact that at each separate time interval exchange and banking platforms from different parts of the world are connected to the trading process, and the Forex market operates around the clock. There are 4 main trading sessions: Pacific. European. American. Asian. This indicator allows you to se
OVERVIEW SyncCrosshair Pro synchronizes your crosshair across all open chart windows. When you move your mouse on one chart, all other charts instantly display the crosshair at the exact same time position. Perfect for traders who analyze multiple timeframes or correlated instruments simultaneously. KEY FEATURES Multi-Chart Crosshair Sync • Vertical line synchronized by time • Horizontal line synchronized by price • Works across different symbols (EURUSD, XAUUSD, indices, crypto...) • Works ac
ArroX
Zahed Khodarahmi
ArroX Indicator Description ArroX is a technical analysis indicator designed for MetaTrader 5 platform. This indicator analyzes price movements and market trends to provide trading signals. Key Features: - Displays buy and sell arrows on the chart - Includes trend filtering capabilities - Provides multiple take profit levels - Shows market analysis information panel - Supports different signal sensitivity modes - Uses Bollinger Bands and moving averages for analysis - Includes stop loss calc
CONTACT AND SUPPORT At TPFX, we understand that every trader has unique requirements and that efficiency is the key to success. Therefore, I cordially invite you to send me a private message regarding any questions, functional errors, or needs for personalized adjustments. I am committed to providing fast and decisive technical assistance, ensuring your tool is always in perfect condition. Personalized adjustments to adapt the system to your specific strategy can be made at no additional cost
Three Methods Trading System for MetaTrader 5 Three Methods Trading System is a price action indicator for MT5 designed to detect 5-candle continuation patterns where a strong trend candle is followed by a brief consolidation and then a breakout in the original direction. A detailed user guide is available on the author’s MQL5 Blog . Additional updates are available through the author’s   MQL5 Channel . Depending on the current support policy, buyers may receive additional access to selected co
AUC Super Trends
Alfonso Urbano Cardenas
AUC - Super Trends , fiyat davranışına dayalı görsel çizgiler kullanarak piyasa yönünü gösteren bir göstergedir. Gösterge, fiyat takip sistemi kullanarak yükseliş ve düşüş fazları arasındaki değişimleri işaretler. Çizgiler, piyasa değişimlerine göre otomatik olarak ayarlanır. Forex, endeksler veya altın gibi farklı finansal enstrümanlarda ve çeşitli zaman dilimlerinde kullanılabilir. Fonksiyonlar Piyasa yönünün görselleştirilmesi Fiyat hareketlerindeki değişimlerin belirlenmesi Trend analizine d
FREE
Blahtech Supply Demand MT5
Blahtech Limited
4.54 (13)
Was: $299  Now: $99  Supply Demand uses previous price action to identify potential imbalances between buyers and sellers. The key is to identify the better odds zones, not just the untouched ones. Blahtech Supply Demand indicator delivers functionality previously unavailable on any trading platform. This 4-in-1 indicator not only highlights the higher probability zones using a multi-criteria strength engine, but also combines it with multi-timeframe trend analysis, previously confirmed swings a
Visual Heatmap Book Analyzer
Alexandre Moraes De Souza Lima
Visual Heatmap Book Analyser This indicator monitors the market liquidity and generates colors based on order patterns, quantities, and renewal activities in the book. This allows you to visualize the order flow and identify areas of high and low liquidity and activity. The indicator uses machine learning techniques to analyze the order behavior in the book, enabling it to detect patterns and trends in orders, allowing you to make informed decisions about your trading operations. The color pale
This product is designed for the MT5 platform and offers two key features: VWAP (Volume Weighted Average Price) calculation and Volume Profile analysis. Advantages: VWAP Calculation: The product calculates the VWAP, which is a popular indicator used by traders to determine the average price of a security based on its trading volume. It helps identify potential buying or selling opportunities by comparing the current price to the average price weighted by volume. Volume Profile Analysis: The prod
Range Directional Force Indicator – Designed for You to Optimize! The Range Directional Force Indicator is a cutting-edge tool designed to empower traders by visualizing market dynamics and directional strength. Built to offer insights into market trends and reversals, this indicator is an invaluable asset for traders seeking precision in their strategies. However, it is important to note that this indicator is not optimized, leaving room for you to tailor it to your unique trading preferences.
Volume at Price (VAP) VAP is a right-anchored Volume Profile Heatmap for MetaTrader 5 designed for clean, fast, and stable execution on any chart. It shows where trading activity clustered, not just when—so you can read balance/imbalance, spot value migration, and plan trades with precise references: VAH, VAL, and POC . What VAP shows Heatmap Profile (tick-volume): A compact, right-anchored histogram that scales with the chart. Value Area (~70%) in Gold Non-Value in White Soft shadow gradient
Auto Zig HTF Vwap Midas
Ricardo Almeida Branco
5 (1)
The best Vwap Midas coding for Metatrader 5 you can find in White Trader indicators. The indicator has been optimized not to recalculate (improving performance) and has several visual settings for you to adapt in your own way. TRY IT FOR FREE by clicking the free demo button Where and why to use Vwap Midas (and Auto Zig Vwap Midas) can be used on a variety of indices, currencies, forex, cryptocurrencies, stocks, indices and commodities. Many successful traders use price and volume to get the
Mirror Chart MT5
Andrej Hermann
5 (1)
The Mirror Chart MT5 is a overlay indicator specifically designed to project a second financial instrument directly onto the main chart window. This tool is invaluable for traders who rely on correlation analysis, as it visualizes the price movements of two different instruments in real time. Unlike traditional overlays, this indicator utilizes intelligent, dynamic centering and scaling logic. It continuously analyzes the visible price range in the current window for both symbols and calculates
FREE
WolfSight AI
Marius Ovidiu Sunzuiana
The WolfSight AI  is a next‑generation market analyzer built for traders who demand speed, clarity, and institutional‑grade intelligence. Powered by a multi‑layer AI decision framework, this indicator evaluates market conditions in real time and transforms them into clear BUY, SELL, or WAIT signals — all displayed through a sleek, interactive panel. This system doesn’t rely on simple crossovers or retail‑grade formulas. Instead, it uses a proprietary AI‑inspired scoring model that processes mul
Sadece Gerçekten Önemli Olan Gerçek Kırılmaları İşlem Yapın. True Breakouts, gerçek piyasa kırılmalarını, özgün ve tescilli bir kırılma modeli kullanarak tespit eden yüksek hassasiyetli bir MT5 göstergesidir. Bu, geleneksel göstergelerde bulunmayan nadir bir kavramdır. Full description in English:   https://www.mql5.com/en/market/product/162325 True Breakouts, gerçek kırılmaları şu şekilde belirler: benzersiz bir tescilli model, daha yüksek doğruluk sağlar, MT5 grafiğinizde doğrudan net kır
Adjustable Consecutive Fractals  looks for 2 or more fractals in one direction and sends out a on screen alert, sound alert and push notification, for strong reversal points . Adjustable Consecutive Fractals, shows the fractals on chart along with a color changing text for buy and sell signals when one or more fractals appear on one side of price. Adjustable Consecutive Fractals is based Bill Williams Fractals . The standard Bill Williams fractals are set at a non adjustable 5 bars, BUT withe th
The Supply and Demand Zone Indicator is a powerful and easy-to-use tool designed to help traders identify critical supply and demand zones on the chart. These zones can provide valuable insight into potential market reversals, breakouts, and important price levels where buyers or sellers are likely to take control. The best   FREE Trade Manager . If you want to create your own Hedging or Grid strategies without any coding make sure to check out the   ManHedger Key Features: Automatic Zone Detect
FREE
Bu ürünün alıcıları ayrıca şunları da satın alıyor
Divergence Bomber
Ihor Otkydach
4.9 (86)
Bu göstergeyi satın alan herkese aşağıdaki ekstra içerikler ücretsiz olarak sunulmaktadır: Her işlemi otomatik olarak yöneten, Stop Loss ve Take Profit seviyelerini ayarlayan ve işlemleri strateji kurallarına göre kapatan özel yardımcı araç: "Bomber Utility" Göstergenin farklı varlıklar üzerinde kullanılmasına yönelik ayar dosyaları (set dosyaları) Bomber Utility için 3 farklı modda kullanım sunan ayar dosyaları: "Minimum Risk", "Dengeli Risk" ve "Bekle-Gör Stratejisi" Bu ticaret stratejisini hı
Azimuth Pro
Ottaviano De Cicco
5 (6)
Azimuth Pro V2: Synthetic Fractal Structure and Confirmed Entries for MT5 Overview Azimuth Pro is a multi-level swing structure indicator by Merkava Labs . Four nested swing layers, swing-anchored VWAP, ABC pattern detection, three-timeframe structural filtering, and closed-bar confirmed entries — one chart, one workflow from micro-swings to macro-cycles. This is not a blind signal product. It is a structure-first workflow for traders who care about location, context, and timing. V2 Launch Offe
OmniSync Projection
Antonio-alin Teculescu
5 (1)
Chronos Fractal Engine is an innovative price projection indicator for MetaTrader 5, designed to transform your technical analysis by intelligently identifying and projecting historical price patterns. Built upon an advanced correlation algorithm and the fractal principles of the market, this powerful tool visualizes potential future price movements, giving you a unique edge in your trading decisions. What is Chronos Fractal Engine? At its core, the Chronos Fractal Engine employs a sophisticat
Quantum TrendPulse
Bogdan Ion Puscasu
5 (22)
SuperTrend   ,   RSI   ve   Stochastic'in   gücünü tek bir kapsamlı göstergede birleştirerek işlem potansiyelinizi en üst düzeye çıkaran nihai işlem aracı olan   Quantum TrendPulse'u   tanıtıyoruz. Hassasiyet ve verimlilik arayan yatırımcılar için tasarlanan bu gösterge, piyasa trendlerini, momentum değişimlerini ve en uygun giriş ve çıkış noktalarını güvenle belirlemenize yardımcı olur. Temel Özellikler: SuperTrend Entegrasyonu:   Güncel piyasa trendlerini kolayca takip edin ve karlılık dalgası
Btmm state engine pro
Garry James Goodchild
5 (3)
BTMM State Engine Pro is a MetaTrader 5 indicator for traders who use the Beat The Market Maker approach: Asian session context, kill zone timing, level progression, peak formation detection, and a multi-pair scanner from a single chart. It combines cycle state logic with a built-in scanner dashboard so you do not need the same tool on many charts at once. What it does Draws the Asian session range; session times can follow broker server offset or be set in inputs. Tracks level progression (L
ARICoins
Temirlan Kdyrkhan
ARICoin is a powerful trading companion designed to generate high-probability entry signals with dynamic TP/SL/DP levels based on volatility. Built-in performance tracking shows win/loss stats, PP1/PP2 hits, and success rates all updated live. Key Features: Buy/Sell signals with adaptive volatility bands Real-time TP/SL/DP levels based on ATR Built-in MA Filter with optional ATR/StdDev volatility Performance stats panel (Success, Profit/Loss, PP1/PP2) Alerts via popup, sound, push, or email Cust
Öncelikle, bu Ticaret Aracının Non-Repainting, Non-Redrawing ve Non-Lagging Gösterge olduğunu vurgulamakta fayda var, bu da onu profesyonel ticaret için ideal hale getiriyor. Çevrimiçi kurs, kullanıcı kılavuzu ve demo. Akıllı Fiyat Hareketi Kavramları Göstergesi, hem yeni hem de deneyimli tüccarlar için çok güçlü bir araçtır. İleri ticaret fikirlerini, Inner Circle Trader Analizi ve Smart Money Concepts Ticaret Stratejileri gibi 20'den fazla kullanışlı göstergeyi bir araya getirerek bir araya
Bill Williams Advanced
Siarhei Vashchylka
5 (11)
Bill Williams Advanced is designed for automatic chart analysis using Bill Williams' "Profitunity" system. The indicator analyzes four timeframes at once. Manual (Be sure to read before purchasing) Advantages 1. Analyzes the chart using Bill Williams' "Profitunity" system. Signals are displayed in a table in the corner of the screen and on the price chart. 2. Finds all known AO and AC signals, as well as zone signals. Equipped with a trend filter based on the Alligator. 3. Finds "Divergence Bar
Weltrade Spike Sentinel
Batsirayi L Marango
5 (1)
Introducing Indicator for PainX and GainX Indices Traders on Weltrade Get ready to experience the power of trading with our indicator, specifically designed for Weltrade   broker's PainX and GainX Indices.  Advanced Strategies for Unbeatable Insights Our indicator employs sophisticated strategies to analyze market trends, pinpointing optimal entry and exit points.  Optimized for Maximum Performance To ensure optimal results, our indicator is carefully calibrated for 5-minute timeframe charts on
RelicusRoad Pro: Kantitatif Piyasa İşletim Sistemi ÖMÜR BOYU ERİŞİMDE %70 İNDİRİM (SINIRLI SÜRE) - 2.000+ TRADER'A KATILIN Neden çoğu trader "mükemmel" indikatörlere rağmen başarısız olur? Çünkü tekil kavramları boşlukta trade ederler. Bağlamı olmayan bir sinyal kumardır. Sürekli kazanmak için KONFLÜANS (UYUM) gerekir. RelicusRoad Pro basit bir ok indikatörü değildir. Tam bir Kantitatif Piyasa Ekosistemi dir. Tescilli volatilite modellemesini kullanarak fiyatın ilerlediği "Adil Değer Yolu"nu har
RFI levels PRO MT5
Roman Podpora
3.67 (3)
Bu gösterge, fiyat dönüş noktalarını ve fiyat geri dönüş bölgelerini doğru bir şekilde gösterir.       Başlıca oyuncular   . Yeni trendlerin nerede oluştuğunu görüyorsunuz ve her işlem üzerinde kontrolü elinizde tutarak, azami hassasiyetle kararlar alıyorsunuz. TREND LINES PRO   göstergesiyle birlikte kullanıldığında maksimum potansiyelini ortaya koyar.  VERSION MT4 Göstergenin gösterdiği şey: Yeni bir trendin başlangıcında aktivasyonla birlikte tersine dönüş yapıları ve tersine dönüş seviyeler
CGE Trading Suite
Carl Gustav Johan Ekstrom
5 (1)
CGE Trading Suite delivers the analytical edge typically reserved for professional trading desks. The platform integrates a full suite of analytical tools into one seamless workflow: dynamic grid mapping, liquidity behavior analysis, ECM, trend lines, MIDAS, trade cycles, and directional channel projections. Together, these provide a unified view of market structure and momentum. Directional clarity is further enhanced by the capital flow index, which measures currency basket strength to identif
Berma Bands
Muhammad Elbermawi
5 (8)
Berma Bantları (BB'ler) göstergesi, piyasa trendlerini belirlemeyi ve bunlardan yararlanmayı amaçlayan yatırımcılar için değerli bir araçtır. Fiyat ile BB'ler arasındaki ilişkiyi analiz ederek, yatırımcılar bir piyasanın trend veya aralıklı fazda olup olmadığını ayırt edebilir. Daha fazla bilgi edinmek için [ Berma Home Blog ] adresini ziyaret edin. Berma Bantları üç belirgin çizgiden oluşur: Üst Berma Bandı, Orta Berma Bandı ve Alt Berma Bandı. Bu çizgiler fiyatın etrafına çizilir ve genel tren
ARIPoint
Temirlan Kdyrkhan
ARIPoint is a powerful trading companion designed to generate high-probability entry signals with dynamic TP/SL/DP levels based on volatility. Built-in performance tracking shows win/loss stats, PP1/PP2 hits, and success rates all updated live. Key Features: Buy/Sell signals with adaptive volatility bands Real-time TP/SL/DP levels based on ATR Built-in MA Filter with optional ATR/StdDev volatility Performance stats panel (Success, Profit/Loss, PP1/PP2) Alerts via popup, sound, push, or email Cu
Advanced Supply Demand MT5
Bernhard Schweigert
4.53 (15)
Herhangi bir Acemi veya Uzman Tüccar için En İyi Çözüm! Bu gösterge benzersiz, yüksek kaliteli ve uygun fiyatlı bir ticaret aracıdır çünkü bir dizi tescilli özelliği ve yeni bir formülü bir araya getirdik. Bu güncelleme ile çift zaman dilimi dilimlerini gösterebileceksiniz. Yalnızca daha yüksek bir TF gösteremeyeceksiniz, aynı zamanda TF grafiğini ve ARTIK daha yüksek TF'yi de gösterebileceksiniz: YUVARLAK BÖLGELERİ GÖSTERMEK. Tüm Arz Talebi tüccarları buna bayılacak. :) Önemli Bilgiler Açıkland
PZ Trend Trading MT5
PZ TRADING SLU
3.8 (5)
Capture every opportunity: your go-to indicator for profitable trend trading Trend Trading is an indicator designed to profit as much as possible from trends taking place in the market, by timing pullbacks and breakouts. It finds trading opportunities by analyzing what the price is doing during established trends. [ Installation Guide | Update Guide | Troubleshooting | FAQ | All Products ] Trade financial markets with confidence and efficiency Profit from established trends without getting whip
Easy SMC Trading
Israr Hussain Shah
4 (1)
Otomatik Risk/Ödül ve Yapı Kırılması (BOS) Tarayıcılı Yapı Trendi Sürüm: 1.0 Genel Bakış Otomatik Risk/Ödül ile Yapı Trendi, Fiyat Hareketine ve Piyasa Yapısına dayanan yatırımcılar için tasarlanmış kapsamlı bir işlem sistemidir. Yüksek olasılıklı işlem kurulumları oluşturmak için düzeltilmiş bir trend filtresini, Swing Noktası tespiti ve Yapı Kırılması (BOS) sinyalleriyle birleştirir. Bu aracın öne çıkan özelliği Otomatik Risk Yönetimidir. Geçerli bir Yapı Kırılması tespit edildiğinde, göste
Gartley Hunter Multi
Siarhei Vashchylka
5 (11)
Gartley Hunter Multi - An indicator for searching for harmonic patterns simultaneously on dozens of trading instruments and on all possible timeframes. Manual (Be sure to read before purchasing) | Version for MT4 Advantages 1. Patterns: Gartley, Butterfly, Shark, Crab. Bat, Alternate Bat, Deep Crab, Cypher 2. Simultaneous search for patterns on dozens of trading instruments and on all possible timeframes 3. Search for patterns of all possible sizes. From the smallest to the largest 4. All fou
Grabber System MT5
Ihor Otkydach
4.83 (23)
Size mükemmel bir teknik gösterge olan Grabber’ı tanıtıyorum. Bu araç, kullanıma hazır bir “her şey dahil” işlem stratejisi olarak çalışır. Tek bir yazılım kodu içinde güçlü piyasa teknik analiz araçları, işlem sinyalleri (oklar), uyarı işlevleri ve push bildirimleri entegre edilmiştir. Bu göstergeyi satın alan herkes aşağıdaki hediyeleri ücretsiz olarak alır: Açık emirleri otomatik yönetmek için Grabber Yardımcı Aracı Kurulum, yapılandırma ve nasıl işlem yapılacağını adım adım anlatan video kıl
AriX
Temirlan Kdyrkhan
1 (4)
AriX Indicator for MT5 A powerful trend-following and signal-evaluation tool AriX is a custom MT5 indicator that combines Moving Averages and ATR-based risk/reward logic to generate clear buy/sell signals. It visualizes dynamic SL/TP levels, evaluates past trade outcomes, and displays win/loss statistics in a clean on-chart panel. Key features include: Buy/Sell signals based on MA crossovers ATR-based SL/TP1/TP2/TP3 levels with visual lines and labels Signal outcome tracking with real-time stat
TREND ÇİZGİLERİ PRO       Piyasanın gerçek yön değiştirdiği noktayı anlamaya yardımcı olur. Gösterge, gerçek trend dönüşlerini ve büyük oyuncuların piyasaya yeniden girdiği noktaları gösterir. Anlıyorsun   BOS hatları   Daha yüksek zaman dilimlerindeki trend değişiklikleri ve önemli seviyeler, karmaşık ayarlar veya gereksiz gürültü olmadan gösterilir. Sinyaller yeniden çizilmez ve çubuk kapandıktan sonra grafikte kalır. MT4 SÜRÜMÜ   -   RFI LEVELS PRO   göstergesiyle   birlikte kullanıldığında m
Meravith MT5
Ivan Stefanov
5 (1)
Göstergе, herhangi bir noktadan hacmi analiz eder ve bu hacim için piyasanın tükeniş seviyelerini hesaplar. Meravith’in ana çizgileri: Boğa hacim tükeniş çizgisi – hedef olarak kullanılır. Ayı hacim tükeniş çizgisi – hedef olarak kullanılır. Trend çizgisi – piyasa trendini gösterir. Piyasanın boğa mı ayı mı olduğuna bağlı olarak rengi değişir ve trend desteği görevi görür. Nasıl kullanılır: Mor dikey çizgiye çift tıklayın ve istediğiniz konuma taşıyın. Her şeyi analiz edebilirsiniz – trendleri v
Shock Pullback
Suleiman Alhawamdah
5 (1)
Basitçe söylemek gerekirse, mevcut mum çubuğunun yanında “pip” olarak bilinen beyaz sayıların hareketi görünmeye başladığında işlem yapmaya başlayabilirsiniz. Beyaz “pip”ler, bir alım veya satım işleminin şu anda aktif olduğunu ve beyaz renkleriyle belirtildiği gibi doğru yönde ilerlediğini gösterir. Beyaz pip hareketi durduğunda ve sabit yeşil renge dönüştüğünde, bu mevcut ivmenin sona erdiğini gösterir. Sayıların yeşil rengi, alım veya satım işlemiyle elde edilen toplam kârı “pip” cinsinden t
Real Spread Monitor is a powerful indicator that is designed to accurately measure and analyze real spreads, giving traders the ability to compare trading conditions of different brokers. This product is also available for MetaTrader 4 =>  https://www.mql5.com/en/market/product/125769 Key Features of Real Spread Monitor: 1. Two modes of operation: Write mode : In this mode the indicator collects data on real spreads of the selected trading instrument and records them in a file. The spread is r
Trend Forecaster
Alexey Minkov
5 (7)
The Trend Forecaster indicator utilizes a unique proprietary algorithm to determine entry points for a breakout trading strategy. The indicator identifies price clusters, analyzes price movement near levels, and provides a signal when the price breaks through a level. The Trend Forecaster indicator is suitable for all financial assets, including currencies (Forex), metals, stocks, indices, and cryptocurrencies. You can also adjust the indicator to work on any time frames, although it is recommen
Tanıtım       Quantum Breakout PRO   , Breakout Bölgeleri ile ticaret yapma şeklinizi değiştiren çığır açan MQL5 Göstergesi! 13 yılı aşkın ticaret tecrübesine sahip deneyimli tüccarlardan oluşan bir ekip tarafından geliştirilmiştir.       Kuantum Breakout PRO       yenilikçi ve dinamik koparma bölgesi stratejisiyle ticaret yolculuğunuzu yeni zirvelere taşımak için tasarlanmıştır. Kuantum Breakout Göstergesi, size 5 kar hedefi bölgesi ile kırılma bölgelerinde sinyal okları ve kırılma kutusuna da
Protect against whipsaws: revolutionize your swing trading approach Swing Trading is the first indicator designed to detect swings in the direction of the trend and possible reversal swings. It uses the baseline swing trading approach, widely described in trading literature. The indicator studies several price and time vectors to track the aggregate trend direction and detects situations in which the market is oversold or overbought and ready to correct. [ Installation Guide | Update Guide | Tro
LT Regression Channel MT5 , Fibonacci analizi, Zarf teorisi ve Fourier ekstrapolasyonunu birleştiren gelişmiş bir teknik gösterge olup doğrudan grafiğinizde yüksek hassasiyetli piyasa analizi sunar. Güçlü kılan özellikler: Fibonacci tabanlı hassasiyetle aşırı alım ve aşırı satım bölgelerini tanımlar Fourier ekstrapolasyonu kullanarak gelecekteki fiyat hareketlerini tahmin eder Hiçbir fırsatı kaçırmamanız için gerçek zamanlı uyarı ve ticaret sinyalleri üretir Daha derin piyasa bağlamı için çoklu
" Dynamic Scalper System MT5 " göstergesi, trend dalgaları içinde işlem yapmak için scalping yöntemi için tasarlanmıştır. Başlıca döviz çiftleri ve altın üzerinde test edilmiştir, diğer işlem araçlarıyla uyumluluğu mümkündür. Ek fiyat hareketi desteğiyle trend boyunca pozisyonların kısa vadeli açılması için sinyaller sağlar. Göstergenin prensibi. Büyük oklar trend yönünü belirler. Küçük oklar şeklinde scalping için sinyaller üreten bir algoritma trend dalgaları içinde çalışır. Kırmızı oklar yü
Top indicator for MT5   providing accurate signals to enter a trade without repainting! It can be applied to any financial assets:   forex, cryptocurrencies, metals, stocks, indices .  Watch  the video  (6:22) with an example of processing only one signal that paid off the indicator! MT4 version is here It will provide pretty accurate trading signals and tell you when it's best to open a trade and close it. Most traders improve their trading results during the first trading week with the help of
Yazarın diğer ürünleri
MTF Channel Panel
Manuel Alejandro Montoya Martinez
MTF Channel Panel is a visual multi-timeframe panel for MetaTrader 5 that summarizes channel behavior and allows optional channel drawing for each timeframe without overloading the chart. Instead of forcing the trader to view multiple channels at the same time, this indicator organizes the most important information into a clean and easy-to-read panel. Each timeframe is reduced to three essential elements: direction , angle , and price position inside the projected channel . In addition, each r
Impulse Zone Spike Detector
Manuel Alejandro Montoya Martinez
Impulse Zone Spike Detector is a MetaTrader 5 indicator that detects and draws horizontal interest zones around impulse-style spike movements on Boom and Crash indices. The indicator analyzes recent price behavior and marks levels that can help organize chart reading. Its purpose is to display technical references around impulses, pullbacks, and areas where price has reacted strongly. It can work in automatic mode to adapt its logic to the symbol behavior, or in manual mode to fix the analysis t
MTF RSI and Stochastic Scanner
Manuel Alejandro Montoya Martinez
MTF RSI & Stochastic Scanner is a MetaTrader 5 panel indicator designed to monitor multiple timeframes from a single view. For each enabled timeframe, the panel displays the current Relative Strength Index (RSI) value, the current Stochastic Oscillator value, the synchronization status between both oscillators, the active signal, and the last detected signal. Its purpose is to provide a fast and structured multi-timeframe overview without the need to constantly switch charts or timeframes. The i
Boom Crash Multi Entry Risk Calculator
Manuel Alejandro Montoya Martinez
Boom Crash Multi Entry Risk Calculator  is a panel-style indicator for MetaTrader 5 designed for risk planning on Boom and Crash synthetic index strategies. The panel helps organize multiple entries, define a common exit, estimate monetary risk per trade, and display a simple visual projection of the plan before execution. The indicator can automatically detect the index type from the symbol loaded on the chart. It also allows the user to set the index manually when a specific reference is prefe
Spike Distribution Analyzer
Manuel Alejandro Montoya Martinez
Spike Distribution Analyzer  is a visual statistical indicator for MetaTrader 5 designed to study how spikes are distributed after sequences of trend candles. Instead of focusing on entry signals, it summarizes the structure between spikes and trend continuation in a clear visual format. The indicator can display a floating text summary, a graphic panel, or both, depending on the selected display mode. The main purpose of the indicator is to help the trader understand how often a spike appears a
Filtrele:
Değerlendirme yok
Değerlendirmeye yanıt