Quantum VWAP Pro for MT5

The VWAP indicator is another of our suite of volume indicators and one which was first referred to in 1988 when it appeared in an article entitled “The Total Cost Of Transactions On The NYSE” in the March edition of the Journal Of Finance from that year, which went on to explain its importance, particularly from an institutional perspective, which underpins its significance in appreciating the power and importance of this indicator.

In many ways, it is akin to the volume price analysis methodology itself, as we are merely attempting to follow the footprints in the sand left by their passage and described by volume. The same is true here, but in this case, we are following the institutions in much the same way.

Originally, the VWAP indicator was developed as a benchmark to measure whether an institutional customer received a fair execution of their order by the broker buying and selling on their behalf. The difference between the reported price and the VWAP gave the customer a benchmark against which to judge whether they had received a fair price or not. A portfolio manager for example, wants to know how the price they paid compared to the average price of the stock during the time it took to fill the order. If an order is filled at a worse price than the VWAP, it raises questions as to the ability of the broker. If the broker purchased a million shares at $40.50 and the VWAP during this time was at $40.70, the customer is likely to be happy since they paid 20 cents less than ‘fair value’. Equally, if the stock were purchased above, at, say $40.90 per share, the customer would consider this a poor trade, paying well above the fair value price at the VWAP.

The simplicity of this easy-to-understand benchmark, which creates this fair value price concept, has led to its wholehearted adoption amongst the institutions, and moreover, why algorithmic VWAP orders now dominate institutional market activity. A huge percentage of institutional orders are executed as VWAP orders, which raises two key questions. First of all, why, and second, how can we benefit from using the indicator?

If we start with the why, according to reports from the leading market makers, almost 40% of orders are now executed on this basis as they attempt to obtain a buy or sell price close to or better than the VWAP during the time it takes to complete the buy or sell order. These orders, therefore, help to hugely reinforce the importance of the VWAP since it is the guiding principle on which these orders are based. Even Warren Buffet uses VWAP, as evidenced when he sold his entire position in Southwest Airlines over two days, holding 2.3 million shares.

This highlights the key issues for any large institutional investor involving the price. If executed in a single order, an order to buy a large block of shares would almost certainly swamp the market, raising the price exponentially and, in addition, overwhelm the average volume traded in the day.

It is this issue of putting the price up against their own buying or conversely seeing the price fall as a result of their own selling that leads to the parent and child order scenario where significant block orders are broken into a multitude of smaller orders, which are duly executed over days, weeks or months. It is this aspect of institutional order execution that makes the VWAP such a potent indicator.

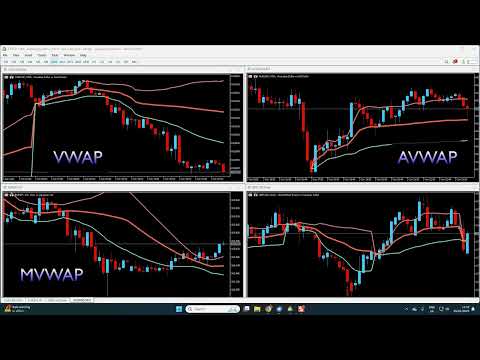
However, at Quantum Trading, we don’t just build a single indicator and leave it at that! We always take them to another level, and here we have done the same, bundling together a total of five indicators into one amazing value package so you can select your favorite from those on offer. The reason for this is we recognize the different ways the volume-weighted average price is used, which is why we offer a total of FIVE variants to choose from, and these are as follows:

  • VWAP – Volume Weighted Average Price
  • MVWAP – Moving Volume Weighted Average Price
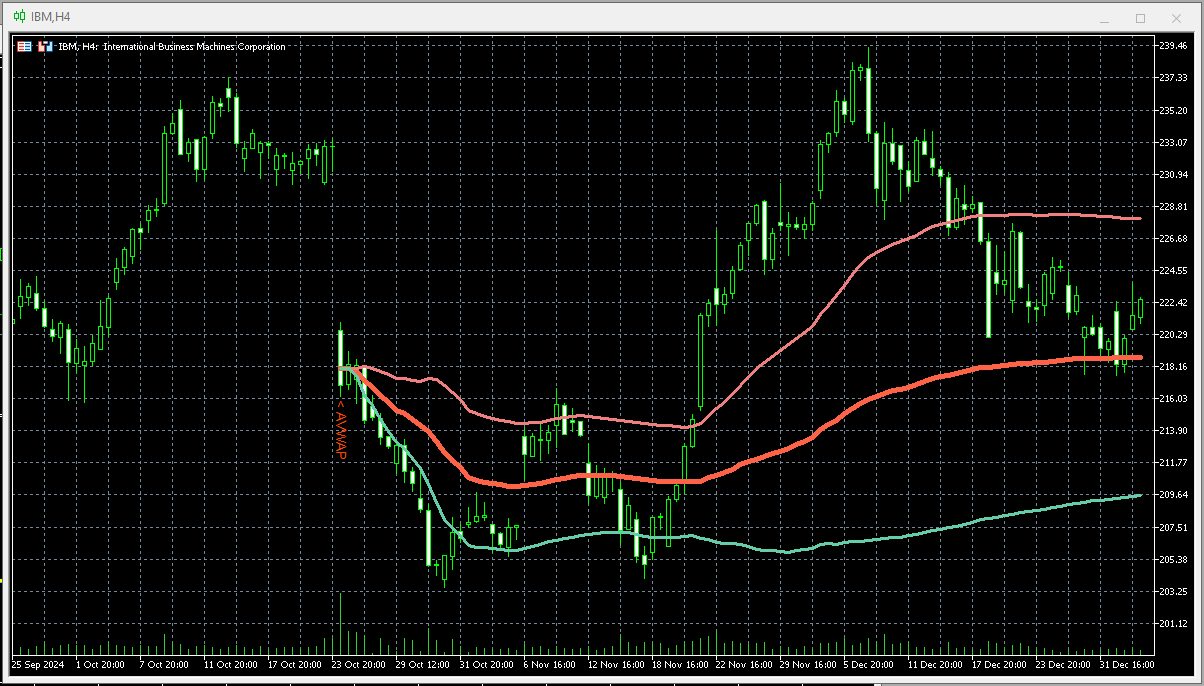
  • AVWAP – Anchored Volume Weighted Average Price
  • TWAP – Time Weighted Average Price
  • Interday Volume Weighted Average Price

All five variants include the option to display upper and lower bands that act as envelopes above and below the VWAP based on standard deviation, which you can adjust and set yourself. These price envelopes become essential dynamic support and resistance levels, which can help predict the extremes of price action as it oscillates around the VWAP from the fastest to the slowest timeframes and everything in between.

All five indicators are packaged into one powerful indicator, which we have named the Quantum VWAP Pro indicator for obvious reasons, and as you would expect, it works in all markets and instruments, whether stocks, futures, ETFs, forex or cryptocurrencies.

Finally, as with all our indicators, we recommend you use it in multiple timeframes.

Önerilen ürünler
# SSL ST Strategy MT5 Indicator - Turkish Version SSL ST Strategy MT5 Göstergesi, tüccarların ticaret grafiğinde alış ve satış sinyallerini açıkça tanımlamalarına yardımcı olmak için tasarlanmış bir teknik analiz aracıdır. Çizgiler ve oklar gibi görsel göstergeler, ayrıca ses, açılır pencere ve anında bildirimleri sunarak, ticaret fırsatı ortaya çıktığında tüccarları zamanında uyarır. ## Ana Avantajlar - Renkli çizgiler (SSL1 ve Baseline) ve alış sinyalleri (yeşil üçgen) ve satış sinyalleri
Introducing RSIScalperPro - the revolutionary RSI-based indicator for Metatrader 5, specifically designed for scalping in the one-minute chart. With RSIScalperPro, you'll have a powerful toolkit for precise entry and exit signals to take your trading to the next level. RSIScalperPro utilizes two different RSI indicators that provide clear signals for overbought and oversold areas. You can customize the time periods and limit values of the two RSIs according to your preferences to achieve the be
Boom Rocket
Cairo Neto Sergio Ndava
This Expert Advisor is designed exclusively for trading the Boom market on the 1-minute timeframe. It operates solely in the sell direction, focusing on precise exits at specific moments in time. Unlike typical signal bots, this EA doesn’t generate buy/sell alerts but executes trades based on a well-defined strategy to take advantage of price movements during market pullbacks. Key Features: Works exclusively for Boom market : The EA is tailored for Boom markets and functions only on the Boom as
Zenith Trade Alerts Indie
Opengates Success International
Zenith Trade Alerts Custom Indicator is a simple amazing trading tool that is created to scan through the applied currency pairs to see if any of them has met profitable trading condition and give trade alerts accordingly. The trading conditions are simply about candle science that is a timeless strategy for profitable trading that will never go out of phase. If combined with good trading plans and good money managements. These are the features: 1. Multi-currency Indicator. 2. Simple and dire
VIDYA Enhanced
David Ben Svaiter
VIDYA-ENHANCED göstergesi (Değişken Endeks Dinamik Ortalama) trendleri ve yatay hareketleri belirlemek için kullanılan bir teknik analiz aracıdır. Chande Momentum Osilatörünü bir volatilite endeksi olarak kullanarak hassasiyetini piyasa volatilitesine göre dinamik olarak ayarlar. Bu özellik, VIDYA-ENHANCED'in önemli fiyat hareketleri dönemlerinde daha çevik olmasını sağlarken, daha az değişken aşamalarda daha istikrarlı kalmasını sağlar.  Özellikler: - Fiyatı 12 seçenek arasından seçin - Met
All in One Multi Indicator
Teerathad Booranawisedkul
Overview Comprehensive technical analysis indicator combining 20+ essential trading tools in a single chart display. Moving Averages EMA (Exponential Moving Average): 9, 21, 50, 200 periods SMA (Simple Moving Average): configurable period Customizable colors and line widths Price position indicators (above/below) Oscillators & Momentum RSI (Relative Strength Index): adjustable overbought/oversold levels MACD (Moving Average Convergence Divergence): customizable fast/slow/signal periods Stochasti
Glider
Vitalii Zakharuk
The Glider indicator gives accurate and timely signals to enter and exit the transaction that appear on the current candle. Using the indicator is very simple. When a dot and a blue line appear, open a buy deal. When a dot and a red line appear, open a sell deal. The main purpose of this indicator is to determine the moments of entry and exit from transactions, therefore the Glider indicator will display only the trend line and entry points, i.e. displays displays the entry points to the marke
Introducing "CypherInvest," your trusted Expert Advisor in the dynamic world of financial markets.  With cutting-edge technology and advanced algorithms, CypherInvest analyzes market data, identifies patterns, and uncovers hidden opportunities to help you make informed investment decisions. Our innovative approach combines the power of cryptography and data analysis, unlocking the secrets of the market to maximize your returns. Powered by the Secret algorithm, CypherInvest leverages support an
Insight Investor: Advanced Multi-Currency Forex Trading Bot Introduction In the fast-paced world of Forex trading, having the right tools can significantly enhance your trading experience. Insight Investor is an advanced multi-currency trading bot designed to automate and optimize your trading operations. This expert advisor employs modern algorithms to analyze market conditions and execute trades, aiming to deliver consistent results while maintaining controlled risk levels. Key Features of Ins
Disclaimer : Keep in mind that seasonal patterns are not always reliable. Therefore, thoughtful risk management is crucial to minimize losses.  Seasonal patterns in the financial world are like a well-guarded secret that successful investors use to their advantage. These patterns are recurring price movements that occur during specific periods or around special events. Additionally, there are also intraday patterns that repeat. For example, Uncle Ted from Forex Family suggests examining previou
I recommend you to read the  product's blog  (manual) from start to end so that it is clear from the beginning what the indicator offers. This multi time frame and multi symbol supply and demand zone dashboard indicator sends alerts when the price has reached a supply/demand zone. It is also possible to use it to be alerted about regular double tops/bottoms instead of zones. It can be used with all time frames from M1 to MN. Maximum 9 time frames can be shown in the dashboard at the same time. 
Bu gösterge, pratik ticaret için mükemmel olan otomatik dalga analizine yönelik bir göstergedir! Dava... Not:   Dalga sınıflandırması için Batılı isimleri kullanmaya alışkın değilim. Tang Lun'un (Tang Zhong Shuo Zen) adlandırma kuralının etkisiyle, temel dalgayı   kalem   , ikincil dalga bandını ise   segment   olarak adlandırdım. aynı zamanda segmentin trend yönü vardır. Adlandırma   esas olarak trend segmentidir   (bu adlandırma yöntemi gelecekteki notlarda kullanılacaktır, öncelikle söyleyey
Turpial Pullback
Arlos Elias Rivas Romero
Indicator Type Strategy (Pullback) for all Symbols and Periodicity, Preferably from 30M periodicity. Can be used for manual trading. Its workspace corresponds to channel of 3 bars of Bill Willians. Also relies on the indicator Rsi and Atr. BUY when: There is a Green Arrow STOPLOSS to buy, below the bottom line of the channel (red line)" SELL when: There is a Red Arrow. STOPLOSS to sell, above the upper line of the channel (blue line)
ArroX
Zahed Khodarahmi
ArroX Indicator Description ArroX is a technical analysis indicator designed for MetaTrader 5 platform. This indicator analyzes price movements and market trends to provide trading signals. Key Features: - Displays buy and sell arrows on the chart - Includes trend filtering capabilities - Provides multiple take profit levels - Shows market analysis information panel - Supports different signal sensitivity modes - Uses Bollinger Bands and moving averages for analysis - Includes stop loss calc
The indicator is designed to close positions on the market in time. For example: to take profits ahead of schedule if the price has not reached TakeProfit, and the market is turning around. The indicator analyzes the momentum, not the trend. He does not give any information about the trend. The indicator is well suited for finding divergence. The Ershov 38 Parrots indicator dynamically adjusts to the market and detects price movement impulses of medium and high amplitude. It almost does not rea
Product Description: Trading Vision – Automated Assistant for Forex Traders Introduction In today's financial markets, automating Forex trading is not just desirable but essential for success. The primary goal of automated trading systems like Trading Vision is to simplify the trading process by implementing advanced algorithms to analyze market trends. This allows traders to focus on strategic thinking while leaving routine operations to technology. What is Trading Vision? Trading Vision is a p
TB EA  – Trendline Breakout Expert Advisor Overview TB EA 1.0 is a professional-grade automated trading system that detects and executes trades based on trendline breakouts using a "body break" confirmation methodology. The EA intelligently distinguishes between support and resistance trendlines, executing BUY orders on resistance breakouts and SELL orders on support breakouts. It works seamlessly on Forex pairs and CFD Indices. Key Features Trendline Breakout Detection Automatically detects
The Rainbow Multiple Moving Average (MMA) is a technical analysis tool used to identify trends and potential reversal points in financial markets. It is based on a system of moving averages that are designed to be used together, with each moving average having a different time frame. The Rainbow MMA consists of multiple exponential moving averages (EMAs) of different lengths, with each EMA plotted in a different color. Typically, the Rainbow MMA includes EMAs of 2, 3, 4, 5, 6, 7, 8, 9, 10, 11, a
ToolBox 360 is the swiss knife of all indicators. It is full packed with useful tools to help you with your trading. It can be used to find best entry and exit points and help you to decide if you should open a trade or not. It shows market trends, candlestick formations outside / inside bars and you can sett time based allerts. Main features: Time based Fibonacci lines Choose a start and end time and the indicator shows you Fibonacci lines within the selected time range including range high a
BluePrint Adaptive Trader - Professional Trading System Advanced Channel Trading System based on our proprietary TrenderFlex PRO algorithm Learn more about TrenderFlex PRO KEY FEATURES • TrenderFlex PRO Channel Technology - Advanced channel calculation based on our proven algorithm • Adaptive Risk Management - Automatic TP/SL calculation based on channel width • Win Rate Statistics - Real-time tracking of TP1, TP2, TP3 success rates • Multi-Timeframe Analysis - Monitor 7 timeframes simultaneou
Tahmin Etmeyi Bırakın. Hesaplamayı Bırakın. Ticarete Başlayın. Risk Reward Tool , TradingView'in sezgisel, görsel deneyimini doğrudan MetaTrader grafiğinize getirir. Profesyonel ticaret hassas risk yönetimi gerektirir, ancak Excel sayfalarıyla manuel olarak lot büyüklüğü hesaplamak yavaştır ve tehlikelidir. Çözüm: Görsel çizgileri Giriş, Zarar Durdur (Stop Loss) ve Kâr Al (Take Profit) seviyelerinize sürükleyin. Araç, belirli dolar miktarınızı (ör. 50$) riske atmak için tam olarak kaç Lot işl
Guardian Trader , trend piyasalarındaki en erken düzeltme fırsatlarını tespit etmek için tasarlanmış, gelişmiş bir trend takip Uzman Danışmanıdır. Profesyonel seviye bir para yönetim sistemi etrafında inşa edilmiş olup, sürdürülebilir büyüme, tutarlı sonuçlar ve işlem sermayenizin sağlam korumasını sunar. Hassas Trend Girişleri Guardian Trader, piyasa trendlerini tanımlar ve işlemleri yalnızca en uygun geri çekilme noktalarında gerçekleştirir; doğruluğu en üst düzeye çıkarır ve gereksiz maruz ka
VWAP Z-Score (Rolling) Positive values indicate price trading above VWAP, while negative values indicate price trading below VWAP. Typical Use Cases Mean-reversion strategies Overbought / oversold detection VWAP-based statistical analysis Confirmation tool for discretionary or algorithmic trading Risk-aware trade entries and exits Notes Uses tick volume for VWAP weighting (standard for Forex symbols). The indicator does not repaint. Designed for analytical and decision-support purposes only.
SMC Market Blueprint
Alex Amuyunzu Raymond
SMC Market Blueprint Institutional Market Structure Analyzer Based on Smart Money and ICT Concepts Overview SMC Market Blueprint is a comprehensive institutional-grade indicator designed to decode the true structure of the market using Smart Money Concepts (SMC) and ICT (Inner Circle Trader) methodology. It maps the internal market framework — identifying structure shifts, liquidity zones, and order flow transitions across multiple timeframes — giving traders a clear blueprint of how institution
EmasFijas
Isaias Villalobos Arias
EmasFijas Multi-Timeframe EMA Indicator for MetaTrader 5 Product Description English: EmasFijas displays EMAs (Exponential Moving Averages) from any timeframe on your current chart. Perfect for multi-timeframe analysis without switching charts. Features an intuitive visual dropdown panel to quickly select any of the 21 available MT5 timeframes. Español: EmasFijas muestra EMAs (Medias Móviles Exponenciales) de cualquier temporalidad en tu gráfico actual. Perfecto para análisis multi-temporalidad
SwingVolumePro
Thalles Nascimento De Carvalho
Genel Bakış SwingVolumePro , geniş bir finansal varlık yelpazesi üzerinde kullanılmak üzere tasarlanmış gelişmiş ve çok yönlü bir göstergedir. Hacim ve fiyat analizi üzerine kurulmuş olan bu gösterge, tüm seviyelerdeki trader'ların yüksek kaliteli verilere dayanarak bilinçli kararlar almasını sağlayacak şekilde net ve hassas sinyaller sunar. SwingVolumePro.PDF Ana Özellikler Çok Yönlülük: SwingVolumePro, hisse senetleri, forex, kripto paralar ve daha fazlası dahil olmak üzere çeşitli
Descriptions A point point is a technical analysis indicator, or calculations, used to determine the overall trend of market over different time frames. This indicator calculate the highest or lowest pivots among left x and right y bars and show the high/low level during that period.   From that, you could clearly see the top resistance & bottom support level and how market goes break out. Instructions pivotLeft - pivot left bar count pivotRight - pivot right bar count pivotHighColor - color
Connix MT5
Garry James Goodchild
Connix Smart Trading – MT5 Multi-Currency Smart Money & ICT Scanner Connix Smart Trading is a multi-currency, multi-timeframe dashboard for MT5 designed for traders using Smart Money Concepts (SMC) and ICT-style methodologies . It allows you to scan up to 28 symbols simultaneously (anything in Market Watch) and view market structure, order blocks, fair value gaps, VWAP bias, and range data across multiple timeframes from one central dashboard. The number of symbols and all timeframes are fully c
BCSpikes
Shamsul Arfeen
Modern Spike Indicator Features: 1. Support and Resistance Lines: Displays dynamic horizontal dashed lines on the chart representing current support and resistance levels calculated from recent price swings. 2. Spike Detection Arrows: Shows up arrows (green) for potential upward spikes and down arrows (red) for potential downward spikes, triggered when price breaks S/R levels with RSI confirmation. 3. Trend Analysis: Incorporates ADX (Average Directional Index) to determine market trend stre
AfriBold Cybernetic Affluence  Your Key to Autonated Trading In the dynamic world of financial markets, navigating the intricate patterns and making informed decisions can be a daunting task. Even seasoned traders face challenges in consistently outperforming the market. This is where the AfriBold Cybernetic Affluence emerges as a powerful tool, designed to automate your trading strategies. Harnessing the Power of AI The AfriBold Cybernetic Wealth Expert Advisor is a cutting-edge trading tool
Bu ürünün alıcıları ayrıca şunları da satın alıyor
Bu indikatörü satın alırsanız, Profesyonel Trade Manager’ımı  + EA ÜCRETSİZ olarak alacaksınız. Öncelikle, bu Ticaret Sistemi'nin Non-Repainting, Non-Redrawing ve Non-Lagging Göstergesi olduğunu vurgulamak önemlidir, bu da hem manuel hem de robot ticareti için ideal hale getirir. Online kurs, kılavuz ve ön ayarları indir. "Smart Trend Trading System MT5", yeni ve deneyimli tüccarlar için özelleştirilmiş kapsamlı bir ticaret çözümüdür. 10'dan fazla premium göstergeyi birleştiriyor ve 7'den fazla
ARIPoint
Temirlan Kdyrkhan
1 (1)
ARIPoint is a powerful trading companion designed to generate high-probability entry signals with dynamic TP/SL/DP levels based on volatility. Built-in performance tracking shows win/loss stats, PP1/PP2 hits, and success rates all updated live. Key Features: Buy/Sell signals with adaptive volatility bands Real-time TP/SL/DP levels based on ATR Built-in MA Filter with optional ATR/StdDev volatility Performance stats panel (Success, Profit/Loss, PP1/PP2) Alerts via popup, sound, push, or email Cu
Azimuth Pro
Ottaviano De Cicco
5 (3)
LAUNCH PROMO Azimuth Pro price is initially set at 299$ for the first 100 buyers. Final price will be 499$ . THE DIFFERENCE BETWEEN RETAIL AND INSTITUTIONAL ENTRIES ISN'T THE INDICATOR — IT'S THE LOCATION. Most traders enter at arbitrary price levels, chasing momentum or reacting to lagging signals. Institutions wait for price to reach structured levels where supply and demand actually shift. Azimuth Pro maps these levels automatically: swing-anchored VWAP, multi-timeframe structure lines, an
Divergence Bomber
Ihor Otkydach
4.89 (82)
Bu göstergeyi satın alan herkese aşağıdaki ekstra içerikler ücretsiz olarak sunulmaktadır: Her işlemi otomatik olarak yöneten, Stop Loss ve Take Profit seviyelerini ayarlayan ve işlemleri strateji kurallarına göre kapatan özel yardımcı araç: "Bomber Utility" Göstergenin farklı varlıklar üzerinde kullanılmasına yönelik ayar dosyaları (set dosyaları) Bomber Utility için 3 farklı modda kullanım sunan ayar dosyaları: "Minimum Risk", "Dengeli Risk" ve "Bekle-Gör Stratejisi" Bu ticaret stratejisini hı
TrendMaestro5
Stefano Frisetti
note: this indicator is for METATRADER4, if you want the version for METATRADER5 this is the link:  https://www.mql5.com/it/market/product/108106 TRENDMAESTRO ver 2.5 TRENDMAESTRO recognizes a new TREND from the start, he never makes mistakes. The certainty of identifying a new TREND is priceless. DESCRIPTION TRENDMAESTRO identifies a new TREND in the bud, this indicator examines the volatility, volumes and momentum to identify the moment in which there is an explosion of one or more of these da
Atomic Analyst MT5
Issam Kassas
4.07 (28)
Öncelikle belirtmek gerekir ki bu Ticaret Göstergesi Yeniden Çizim Yapmaz, Gecikmez ve Gecikme Göstermez, bu da hem manuel hem de robot ticareti için ideal hale getirir. Kullanıcı kılavuzu: ayarlar, girişler ve strateji. Atom Analisti, Piyasada Daha İyi Bir Avantaj Bulmak İçin Fiyatın Gücünü ve Momentumunu Kullanan PA Fiyat Hareketi Göstergesidir. Gürültüleri ve Yanlış Sinyalleri Kaldırmaya ve Ticaret Potansiyelini Artırmaya Yardımcı Olan Gelişmiş Filtrelerle Donatılmıştır. Birden fazla katmanl
Grabber System MT5
Ihor Otkydach
4.82 (22)
Size mükemmel bir teknik gösterge olan Grabber’ı tanıtıyorum. Bu araç, kullanıma hazır bir “her şey dahil” işlem stratejisi olarak çalışır. Tek bir yazılım kodu içinde güçlü piyasa teknik analiz araçları, işlem sinyalleri (oklar), uyarı işlevleri ve push bildirimleri entegre edilmiştir. Bu göstergeyi satın alan herkes aşağıdaki hediyeleri ücretsiz olarak alır: Açık emirleri otomatik yönetmek için Grabber Yardımcı Aracı Kurulum, yapılandırma ve nasıl işlem yapılacağını adım adım anlatan video kıl
Super Signal – Skyblade Edition Profesyonel No-Repaint / Gecikmesiz Trend Sinyal Sistemi, Olağanüstü Kazanma Oranı ile | MT4 / MT5 için 1 dakika, 5 dakika ve 15 dakika gibi daha düşük zaman dilimlerinde en iyi şekilde çalışır. Temel Özellikler: Super Signal – Skyblade Edition, özellikle trend bazlı işlemler için geliştirilmiş akıllı bir sinyal sistemidir. Yalnızca güçlü, yönlü ve gerçek momentum destekli piyasa hareketlerini tespit etmek amacıyla çok katmanlı bir filtreleme yapısı kullanır.
RelicusRoad Pro: Kantitatif Piyasa İşletim Sistemi ÖMÜR BOYU ERİŞİMDE %70 İNDİRİM (SINIRLI SÜRE) - 2.000+ TRADER'A KATILIN Neden çoğu trader "mükemmel" indikatörlere rağmen başarısız olur? Çünkü tekil kavramları boşlukta trade ederler. Bağlamı olmayan bir sinyal kumardır. Sürekli kazanmak için KONFLÜANS (UYUM) gerekir. RelicusRoad Pro basit bir ok indikatörü değildir. Tam bir Kantitatif Piyasa Ekosistemi dir. Tescilli volatilite modellemesini kullanarak fiyatın ilerlediği "Adil Değer Yolu"nu har
Trend Screener Pro MT5
STE S.S.COMPANY
4.84 (100)
Trend Göstergesi, Trend Alım Satım ve Filtreleme için Çığır Açan Benzersiz Çözüm, Tüm Önemli Trend Özellikleriyle Tek Bir Araç İçinde Yerleştirildi! Forex, emtialar, kripto para birimleri, endeksler ve hisse senetleri gibi tüm sembollerde/araçlarda kullanılabilen %100 yeniden boyamayan çoklu zaman çerçevesi ve Çoklu para birimi göstergesidir. Trend Screener, grafikte noktalarla ok trend sinyalleri sağlayan etkili bir trend trend göstergesidir. Trend analizörü göstergesinde bulunan özellikler: 1.
Quantum TrendPulse
Bogdan Ion Puscasu
5 (20)
SuperTrend   ,   RSI   ve   Stochastic'in   gücünü tek bir kapsamlı göstergede birleştirerek işlem potansiyelinizi en üst düzeye çıkaran nihai işlem aracı olan   Quantum TrendPulse'u   tanıtıyoruz. Hassasiyet ve verimlilik arayan yatırımcılar için tasarlanan bu gösterge, piyasa trendlerini, momentum değişimlerini ve en uygun giriş ve çıkış noktalarını güvenle belirlemenize yardımcı olur. Temel Özellikler: SuperTrend Entegrasyonu:   Güncel piyasa trendlerini kolayca takip edin ve karlılık dalgası
Dark Support Resistance  is an Indicator for intraday trading. This Indicator is programmed to identify  Support and Resistance Lines , providing a high level of accuracy and reliability. Key benefits Easily visible lines Only the most important levels will be displayed Automated adjustment for each timeframe and instrument Easy to use even for beginners Never repaints, never backpaints, Not Lag 100% compatible with Expert Advisor development All types of alerts available: Pop-up, Email, Push
TPSproTREND PrO MT5
Roman Podpora
4.74 (19)
TPSproTrend PRO, piyasanın yön değiştirdiği anı belirler ve hareketin başlangıcında bir giriş noktası oluşturur. Piyasaya, fiyat hareketi henüz yeni başladığı anda girersiniz, hareket gerçekleştikten sonra değil.   Gösterge       Sinyalleri yeniden çizmez ve giriş noktalarını, Zarar Durdurma ve Kar Al seviyelerini otomatik olarak göstererek alım satımı net, görsel ve yapılandırılmış hale getirir. RUSÇA TALİMATLAR   -   MT4 SÜRÜMÜ Başlıca avantajlar Yeniden çizim yapılmadan sinyaller.   Tüm sinya
The AX Forex Indicator MT5 is a sophisticated trading tool designed to provide traders with a comprehensive analysis of multiple currency pairs. This   powerful indicator   simplifies the complex nature of the forex market, making it accessible for both novice and experienced traders. AX Forex Indicator uses   advanced algorithms   to detect trends, patterns and is an essential tool for traders aiming to enhance their forex trading performance. With its robust features, ease of use, and reliabl
Weis Wave with Alert MT5
Trade The Volume Waves Single Member P.C.
4.94 (17)
Rental/Lifetime Package Options and Privileges  Rent Monthly Six Months   Yearly/Lifetime Weis Wave with Speed with Alert+Speed Index x x x Manual  x x x Quick Set up Video x x x Blog x x x Lifetime Updates x x x Setup and Training Material x x Discord Access Channel "The SI traders"          x Rectangle Break Alert Tool      x How to trade with it:    http://www.tradethevolumewaves.com   ** If you purchase please contact me to setup your  : Training Room and  complete manual access.  Wei
Öncelikle, bu Ticaret Aracının Non-Repainting, Non-Redrawing ve Non-Lagging Gösterge olduğunu vurgulamakta fayda var, bu da onu profesyonel ticaret için ideal hale getiriyor. Çevrimiçi kurs, kullanıcı kılavuzu ve demo. Akıllı Fiyat Hareketi Kavramları Göstergesi, hem yeni hem de deneyimli tüccarlar için çok güçlü bir araçtır. İleri ticaret fikirlerini, Inner Circle Trader Analizi ve Smart Money Concepts Ticaret Stratejileri gibi 20'den fazla kullanışlı göstergeyi bir araya getirerek bir araya
Her gün binlerce trader aynı tuzağa düşüyor. Fiyat kritik bir seviyeyi kırıyor. İşleme giriyorsun. Sonra BOOM — piyasa tersine dönüyor ve stopunu patlatıyor. Bu gerçek bir kırılım değildi. Asıl hareket başlamadan önce perakende parayı tuzağa düşürmek için tasarlanmış bir yanılsamaydı. Profesyonel trader’lar buna “likidite süpürmesi” (liquidity sweep) der. Akıllı para buna “stop avı” (stop hunt) der. TANIŞTIRIM: MIRAGE TRADING SYSTEM — sahte kırılımları avantajına çevir. SINIRLI LANSMAN: Şimdi s
Advanced Supply Demand MT5
Bernhard Schweigert
4.5 (14)
Herhangi bir Acemi veya Uzman Tüccar için En İyi Çözüm! Bu gösterge benzersiz, yüksek kaliteli ve uygun fiyatlı bir ticaret aracıdır çünkü bir dizi tescilli özelliği ve yeni bir formülü bir araya getirdik. Bu güncelleme ile çift zaman dilimi dilimlerini gösterebileceksiniz. Yalnızca daha yüksek bir TF gösteremeyeceksiniz, aynı zamanda TF grafiğini ve ARTIK daha yüksek TF'yi de gösterebileceksiniz: YUVARLAK BÖLGELERİ GÖSTERMEK. Tüm Arz Talebi tüccarları buna bayılacak. :) Önemli Bilgiler Açıkland
ARIScalping
Temirlan Kdyrkhan
ARIScalp is a powerful trading companion designed to generate high-probability entry signals with dynamic TP/SL/DP levels based on volatility. Built-in performance tracking shows win/loss stats, PP1/PP2 hits, and success rates all updated live. Key Features: Buy/Sell signals with adaptive volatility bands Real-time TP/SL/DP levels based on ATR Built-in MA Filter with optional ATR/StdDev volatility Performance stats panel (Success, Profit/Loss, PP1/PP2) Alerts via popup, sound, push, or email Cus
Algo Pumping
Ihor Otkydach
4.75 (20)
PUMPING STATION – Kişisel “her şey dahil” stratejiniz Karşınızda PUMPING STATION — forex dünyasında işlem yapma şeklinizi heyecan verici ve etkili bir sürece dönüştürecek devrim niteliğinde bir gösterge. Bu sadece bir yardımcı değil, güçlü algoritmalarla donatılmış tam teşekküllü bir ticaret sistemidir ve daha istikrarlı işlem yapmanıza yardımcı olur. Bu ürünü satın aldığınızda ŞUNLARI ÜCRETSİZ olarak alırsınız: Özel ayar dosyaları: Otomatik kurulum ve maksimum performans için. Adım adım video e
If you need an indicator that shows market entry points, then this is your indicator.  The indicator is not redrawn. Shows buy and sell points for any TF (time frame) and any currency pair. Settings are adjustable for all instruments. You can configure each parameter for any broker, for any account. This is a PILLOW that is comfortable :)) Just check it out.....
PZ Day Trading MT5
PZ TRADING SLU
2.83 (6)
Effortless trading: non-repainting indicator for accurate price reversals This indicator detects price reversals in a zig-zag fashion, using only price action analysis and a donchian channel. It has been specifically designed for short-term trading, without repainting or backpainting at all. It is a fantastic tool for shrewd traders aiming to increase the timing of their operations. [ Installation Guide | Update Guide | Troubleshooting | FAQ | All Products ] Amazingly easy to trade It provides
Presenting one-of-a-kind Gann Indicator for XAUUSD IQ Gold Gann Levels is a non-repainting, precision tool designed exclusively for XAUUSD/Gold intraday trading. It uses W.D. Gann’s square root method to plot real-time support and resistance levels, helping traders spot high-probability entries with confidence and clarity. William Delbert Gann (W.D. Gann) was an exceptional market analyst whose trading technique was based on a complex blend of mathematics, geometry, astrology, and ancient calcul
Top indicator for MT5   providing accurate signals to enter a trade without repainting! It can be applied to any financial assets:   forex, cryptocurrencies, metals, stocks, indices .  Watch  the video  (6:22) with an example of processing only one signal that paid off the indicator! MT4 version is here It will provide pretty accurate trading signals and tell you when it's best to open a trade and close it. Most traders improve their trading results during the first trading week with the help of
Ace Trend
Mikhail Sergeev
5 (3)
Size trend ticareti dünyasında oyunun kurallarını değiştiren devrim niteliğinde bir gösterge sunuyoruz. Gösterge, performansı yeniden düşünmek ve ticaret deneyiminizi benzeri görülmemiş bir yüksekliğe çıkarmak için tasarlanmıştır. Göstergemiz, onu rakiplerinden ayıran benzersiz bir gelişmiş özellik kombinasyonuna sahiptirize trend ticareti dünyasında oyunun kurallarını değiştiren devrim niteliğinde bir gösterge sunuyoruz. Gösterge, performansı yeniden düşünmek ve ticaret deneyiminizi benzeri gör
TREND ÇİZGİLERİ PRO       Piyasanın gerçek yön değiştirdiği noktayı anlamaya yardımcı olur. Gösterge, gerçek trend dönüşlerini ve büyük oyuncuların piyasaya yeniden girdiği noktaları gösterir. Anlıyorsun   BOS hatları   Daha yüksek zaman dilimlerindeki trend değişiklikleri ve önemli seviyeler, karmaşık ayarlar veya gereksiz gürültü olmadan gösterilir. Sinyaller yeniden çizilmez ve çubuk kapandıktan sonra grafikte kalır. MT4 SÜRÜMÜ Göstergenin gösterdiği şey: Gerçek değişimler   trend (BOS çizg
Gartley Hunter Multi
Siarhei Vashchylka
5 (11)
Gartley Hunter Multi - An indicator for searching for harmonic patterns simultaneously on dozens of trading instruments and on all possible timeframes. Manual (Be sure to read before purchasing) | Version for MT4 Advantages 1. Patterns: Gartley, Butterfly, Shark, Crab. Bat, Alternate Bat, Deep Crab, Cypher 2. Simultaneous search for patterns on dozens of trading instruments and on all possible timeframes 3. Search for patterns of all possible sizes. From the smallest to the largest 4. All fou
Bu gösterge paneli, seçilen semboller için mevcut en son   harmonik kalıpları   gösterir, böylece zamandan tasarruf edersiniz ve daha verimli olursunuz /   MT4 sürümü . Ücretsiz Gösterge:   Basic Harmonic Pattern Gösterge sütunları Symbol :   seçilen semboller görünecektir Trend:   yükseliş veya düşüş Pattern :   desen türü (gartley, kelebek, yarasa, yengeç, köpekbalığı, cypher veya ABCD) Entry :   giriş fiyatı SL:   zararı durdur fiyatı TP1:   1. kar alma fiyatı TP2:   2. kar alma fiyatı TP
Noise filtering: the key to mastering trends This indicator tracks the market trend with an unmatched reliability, by ignoring sudden fluctuations and market noise. It has been designed to trend-trade intraday charts and small timeframes. Its winning ratio is around 85%. [ Installation Guide | Update Guide | Troubleshooting | FAQ | All Products ] Amazingly easy to trade Find oversold/overbought situations Enjoy noise-free trading at all times Avoid being whipsawed in intraday charts The indi
G-Labs Advanced Market Maker Dashboard – MT5 BTMM Cycle & Market Maker State Engine The G-Labs Advanced Market Maker Dashboard is a professional multi-symbol, multi-cycle analysis system designed to track Market Maker intent, cycle progression, and structural behavior across the market from a single, unified dashboard. This is not a simple scanner. It is a cycle-aware BTMM engine that combines higher-timeframe bias, intraday structure, range expansion, manipulation detection, adaptive order bloc
Yazarın diğer ürünleri
This indicator has been developed to identify and display these trends quickly and easily, allowing you to see instantly, those currency pairs which are trending, and those which are not – and in all timeframes, with just one click. The 28 currency pairs are displayed as a fan as they sweep from strong to weak and back again, and this is why we call it the ‘currency array’. All 28 pairs are arrayed before you, giving an instant visual description of those pairs that are trending strongly, those
Quantum Currency Strength Indicator
QUANTUM TRADING SOFTWARE LIMITED
Your success as a forex trader depends on being able to identify when a currency or currency pair is oversold or overbought. If it is strong or weak. It is this concept which lies at the heart of forex trading. Without the Quantum Currency Strength indicator, it is almost impossible. There are simply too many currencies and too many pairs to do this quickly and easily yourself. You need help! The Quantum Currency Strength indicator has been designed with one simple objective in mind. To give you
The Quantum VPOC indicator has been developed to expand the two dimensional study of volume and price, to a three dimensional one which embraces time. The volume/price/time relationship then provides real insight to the inner workings of the market and the heartbeat of sentiment and risk which drives the price action accordingly. The Quantum VPOC indicator displays several key pieces of information on the chart as follows: Volume Profile - this appears as a histogram of volume on the vertical pr
Quantum Tick Volumes Indicator
QUANTUM TRADING SOFTWARE LIMITED
5 (1)
Many Forex traders assume there is no volume in the foreign exchange market. And they would be correct. There is no central exchange, not yet anyway. And even if there were, what would it report? What there is however is activity, and this is captured as tick volume. After all, volume is simply displaying activity, the buyers and sellers in the market. So for volume read activity, and for activity read volume – simple. The MT4 platform delivers tick data which the Quantum Tick Volumes indicator
Quantum Trend Monitor Indicator
QUANTUM TRADING SOFTWARE LIMITED
Currency pairs never go up or down in a straight line. They rise and fall constantly, creating pullbacks and reversals. And with each rise and fall, so your emotions rise and fall. Hope, then fear, then hope. This is when the market will try to frighten you out of a strong position. It is when you are most vulnerable. But not if you have the Quantum Trend Monitor. And here, you even get two indicators for the price of one! The Quantum Trend Monitor has been designed to absorb these temporary pau
Quantum Trends Indicator
QUANTUM TRADING SOFTWARE LIMITED
1 (1)
One of the oldest maxims in trading is ‘let the trend be your friend’. You must have come across it! This is easier said than done! First, you have to identify one, then you have to stay in – not easy. Staying in a trend to maximise your profits is extremely difficult. In addition, how do you know when a trend has started? It’s very easy to look back and identify the trend. Not so easy at the live edge of the market. The Quantum Trends indicator is the ‘sister’ indicator to the Quantum Trend Mon
Quantum Dynamic Price Pivots Indicator
QUANTUM TRADING SOFTWARE LIMITED
1 (1)
For aspiring price action traders, reading a candle chart at speed can be learnt, but is a skill which takes years to perfect. For lesser mortals, help is required, and this is where the Quantum Dynamic Price Pivots indicator steps in to help. As a leading indicator based purely on price action, the indicator delivers simple clear signals in abundance, highlighting potential reversals with clinical efficiency. Just like volume and price, pivots are another ‘predictive’ indicator, and a leading i
If you've been trading for any time, you will almost certainly have come across the concept of support and resistance. This powerful and simple concept lies at the heart of technical analysis. It forms the cornerstone of price action trading. Strange to consider therefore, that such a key component of the traders chart has largely been ignored. Most Forex traders still draw their lines manually, leading to a crude interpretation of these key levels. Even those companies who have developed a trad
Quantum Dynamic Volatility Indicator
QUANTUM TRADING SOFTWARE LIMITED
Have you ever wondered why so many Forex traders get trapped in weak positions on the wrong side of the market? One of the easiest ways the market makers do this, is by using volatility. A currency pair moves suddenly, often on a news release or economic data. Traders jump in, expecting some quick and easy profits, but the move suddenly moves in the opposite direction. This happens in all timeframes, and in all currency pairs. The candle or bar closes, with a wide spread, but then reverses sharp
Quantum US Dollar Index Indicator
QUANTUM TRADING SOFTWARE LIMITED
We don’t want to become boring, but the US dollar is the most important currency for all traders, and not just in Forex. Trading without a clear view of the US dollar is like driving in fog. Sooner or later you are going to crash – it’s just a question of when. That’s why at Quantum we have developed two US dollar indices. The first is the Quantum DXY, and the second is the Quantum USDX. So what’s the difference? Well, the reason we created the Quantum USDX is that many Forex traders believe tha
Quantum Currency Matrix Indicator
QUANTUM TRADING SOFTWARE LIMITED
Of all the four principle capital markets, the world of foreign exchange trading is the most complex and most difficult to master, unless of course you have the right tools! The reason for this complexity is not hard to understand. First currencies are traded in pairs. Each position is a judgment of the forces driving two independent markets. If the GBP/USD for example is bullish, is this being driven by strength in the pound, or weakness in the US dollar. Imagine if we had to do the same thing
Quantum Volume Point of Control Indicator
QUANTUM TRADING SOFTWARE LIMITED
5 (1)
The Quantum VPOC indicator has been developed to expand the two dimensional study of volume and price, to a three dimensional one which embraces time. The volume/price/time relationship then provides real insight to the inner workings of the market and the heartbeat of sentiment and risk which drives the price action accordingly. The Quantum VPOC indicator displays several key pieces of information on the chart as follows: Volume Profile - this appears as a histogram of volume on the vertical pr
Quantum Currency Array Indicator
QUANTUM TRADING SOFTWARE LIMITED
This indicator has been developed to identify and display these trends quickly and easily, allowing you to see instantly, those currency pairs which are trending, and those which are not – and in all timeframes, with just one click. The 28 currency pairs are displayed as a fan as they sweep from strong to weak and back again, and this is why we call it the ‘currency array’. All 28 pairs are arrayed before you, giving an instant visual description of those pairs that are trending strongly, those
Quantum Currency Heatmap Indicator
QUANTUM TRADING SOFTWARE LIMITED
Trading the currency markets is a complex business, not least since we are dealing with pairs of currencies, and by inference, pairs of economies. All economies around the world are interlinked, and reflected in the constant ebb and flow of currency strength and weakness. The problem for us as traders is monitoring so many pairs simultaneously, since every pair does not move independently, but reflects the interrelated nature of this market. The Quantum Currency Heatmap delivers the information
The words powerful, unique and game changing are ones that are often over used when applied to trading indicators, but for the MT4/MT5 Quantum Camarilla levels indicator, they truly describe this new and exciting indicator completely. Why? Because the indicator has something to offer every trader, from the systematic to the discretionary and from swing trading to breakout trading. And it’s not an indicator which is simply used for entries. The Camarilla indicator delivers in all areas, from get
Quantum Market Strength Indicator
QUANTUM TRADING SOFTWARE LIMITED
The Market Strength Indicator (MSI) is yet another in our stable of volume-based indicators, and as such, is a must-have tool for trading virtually any type of market and across a myriad of applications from trend trading to swing trading, scalping, and much more. While its sister indicator, the Currency Strength Indicator (CSI), helps you analyze which currencies are oversold, overbought, correlating, and trending, the MSI or Market Strength Indicator does this also, but in this case, for all m
Quantum VRSI
QUANTUM TRADING SOFTWARE LIMITED
The VRSI indicator is another in the suite of volume indicators we have developed and one that complements our volume price analysis methodology perfectly. and was developed out of a desire to build further on our cornerstone of VPA by peeling back the layers of volume and considering the relative aspect of volume. Hence, the acronym of Volume Relative Strength Index indicator encapsulates what the indicator is all about. By analyzing relative volume, we are able to see a visual representation o
Quantum VWAP Pro
QUANTUM TRADING SOFTWARE LIMITED
The VWAP indicator is another of our suite of volume indicators and one which was first referred to in 1988 when it appeared in an article entitled “The Total Cost Of Transactions On The NYSE” in the March edition of the Journal Of Finance from that year, which went on to explain its importance, particularly from an institutional perspective, which underpins its significance in appreciating the power and importance of this indicator. In many ways, it is akin to the volume price analysis methodol
If there is only one MT5 indicator you ever buy for trading forex – this has to be it. Your success as a forex trader depends on being able to identify when a currency or currency pair is oversold or overbought. If it is strong or weak. It is this concept which lies at the heart of forex trading. Without the Quantum Currency Strength indicator, it is almost impossible. There are simply too many currencies and too many pairs to do this quickly and easily yourself. You need help! The Quantum Cur
Have you ever wondered why so many Forex traders get trapped in weak positions on the wrong side of the market? One of the easiest ways the market makers do this, is by using volatility. A currency pair moves suddenly, often on a news release or economic data. Traders jump in, expecting some quick and easy profits, but the move suddenly moves in the opposite direction. This happens in all timeframes, and in all currency pairs. The candle or bar closes, with a wide spread, but then reverses sharp
If you've been trading for any time, you will almost certainly have come across the concept of support and resistance. This powerful and simple concept lies at the heart of technical analysis. It forms the cornerstone of price action trading. Strange to consider therefore, that such a key component of the traders chart has largely been ignored. Most Forex traders still draw their lines manually, leading to a crude interpretation of these key levels. Even those companies who have developed a trad
Quantum Trends Indicator for MT5
QUANTUM TRADING SOFTWARE LIMITED
One of the oldest maxims in trading is ‘let the trend be your friend’. You must have come across it! This is easier said than done! First, you have to identify one, then you have to stay in – not easy. Staying in a trend to maximise your profits is extremely difficult. In addition, how do you know when a trend has started? It’s very easy to look back and identify the trend. Not so easy at the live edge of the market. The Quantum Trends indicator is the ‘sister’ indicator to the Quantum Trend Mon
Quantum Currency Matrix Indicator for MT5
QUANTUM TRADING SOFTWARE LIMITED
5 (1)
Of all the four principle capital markets, the world of foreign exchange trading is the most complex and most difficult to master, unless of course you have the right tools! The reason for this complexity is not hard to understand. First currencies are traded in pairs. Each position is a judgment of the forces driving two independent markets. If the GBP/USD for example is bullish, is this being driven by strength in the pound, or weakness in the US dollar. Imagine if we had to do the same thing
We don’t want to become boring, but the US dollar is the most important currency for all traders, and not just in Forex. Trading without a clear view of the US dollar is like driving in fog. Sooner or later you are going to crash – it’s just a question of when. That’s why at Quantum we have developed two US dollar indices. The first is the Quantum DXY, and the second is the Quantum USDX. So what’s the difference? Well, the reason we created the Quantum USDX is that many Forex traders believe tha
For aspiring price action traders, reading a candle chart at speed can be learnt, but is a skill which takes years to perfect. For lesser mortals, help is required, and this is where the Quantum Dynamic Price Pivots indicator steps in to help. As a leading indicator based purely on price action, the indicator delivers simple clear signals in abundance, highlighting potential reversals with clinical efficiency. Just like volume and price, pivots are another ‘predictive’ indicator, and a leading i
Quantum Tick Volumes Indicator for MT5
QUANTUM TRADING SOFTWARE LIMITED
5 (1)
Many Forex traders assume there is no volume in the foreign exchange market. And they would be correct. There is no central exchange, not yet anyway. And even if there were, what would it report? What there is however is activity, and this is captured as tick volume. After all, volume is simply displaying activity, the buyers and sellers in the market. So for volume read activity, and for activity read volume – simple. The MT5 platform delivers tick data which the Quantum Tick Volumes indicator
Currency pairs never go up or down in a straight line. They rise and fall constantly, creating pullbacks and reversals. And with each rise and fall, so your emotions rise and fall. Hope, then fear, then hope. This is when the market will try to frighten you out of a strong position. It is when you are most vulnerable. But not if you have the Quantum Trend Monitor. And here, you even get two indicators for the price of one! The Quantum Trend Monitor has been designed to absorb these temporary pau
Trading the currency markets is a complex business, not least since we are dealing with pairs of currencies, and by inference, pairs of economies. All economies around the world are interlinked, and reflected in the constant ebb and flow of currency strength and weakness. The problem for us as traders is monitoring so many pairs simultaneously, since every pair does not move independently, but reflects the interrelated nature of this market. The Quantum Currency Heatmap delivers the information
The words powerful, unique and game changing are ones that are often over used when applied to trading indicators, but for the MT5 Quantum Camarilla levels indicator, they truly describe this new and exciting indicator completely. Why? Because the indicator has something to offer every trader, from the systematic to the discretionary and from swing trading to breakout trading. And it’s not an indicator which is simply used for entries. The Camarilla indicator delivers in all areas, from getting
Renko is a well-known Japanese charting technique that removes time from the chart. Instead of drawing bars in constant intervals (time) as a normal chart would, a Renko chart does so only when price moves beyond a predefined amount. In a Renko chart, a bar is created when price exceeds the previous bar’s high or low by a predefined amount or what we call the Box Size. The result is a chart with equally sized bars running up or down in 45 degree angles. Such a chart offers the following advant
Filtrele:
İnceleme yok
İncelemeye yanıt