RC Hour Interval Lines MT5
- Göstergeler
-
Francisco Rayol
 MQL5 | MQL4 | PINESCRIPT | NINJASCRIPT
RC ATR Volatility Hedge Zones: https://www.mql5.com/en/market/product/114742 - Sürüm: 1.0
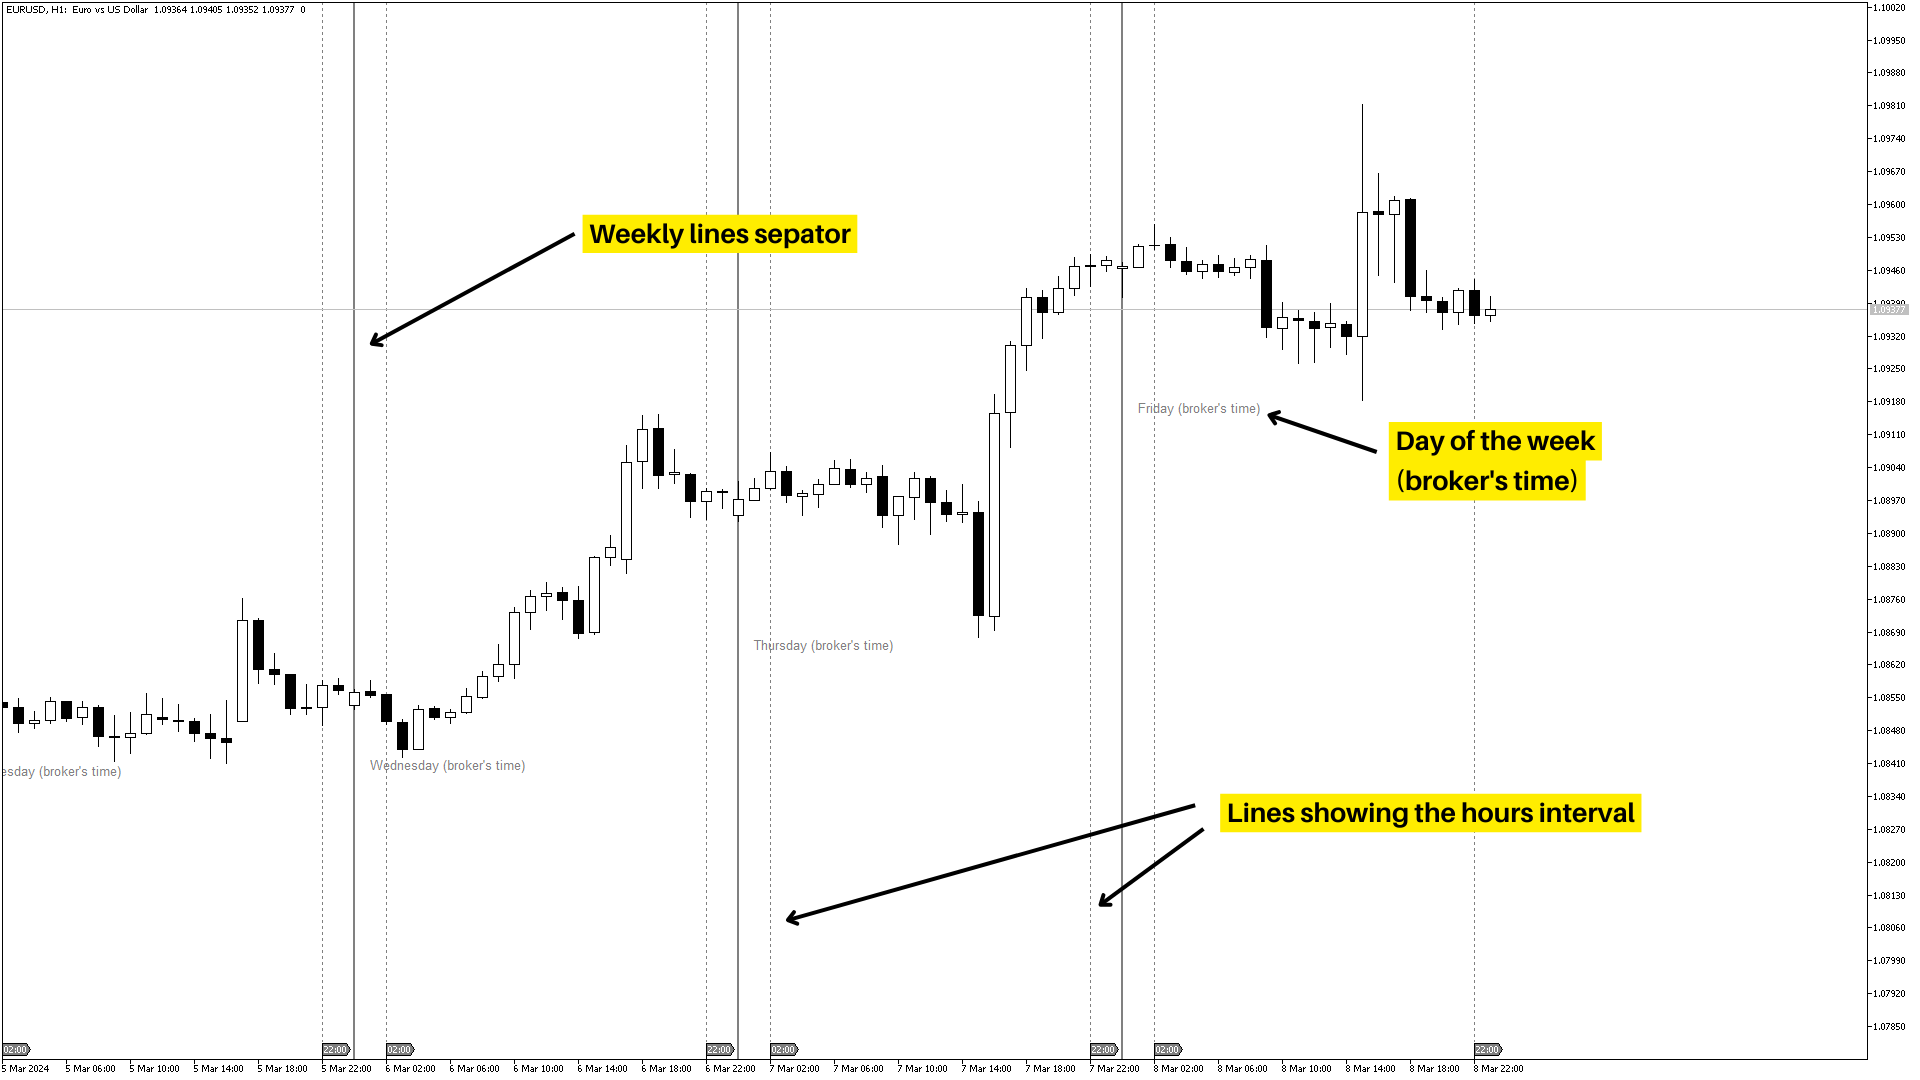
The Rayol Code Hour Interval Lines indicator was designed to assist your trading experience. It draws the range of hours chosen by the user directly on the chart, so that it enables traders to visualize price movements during their preferred trading hours, providing traders a more comprehensive view of price movements and market dynamics.
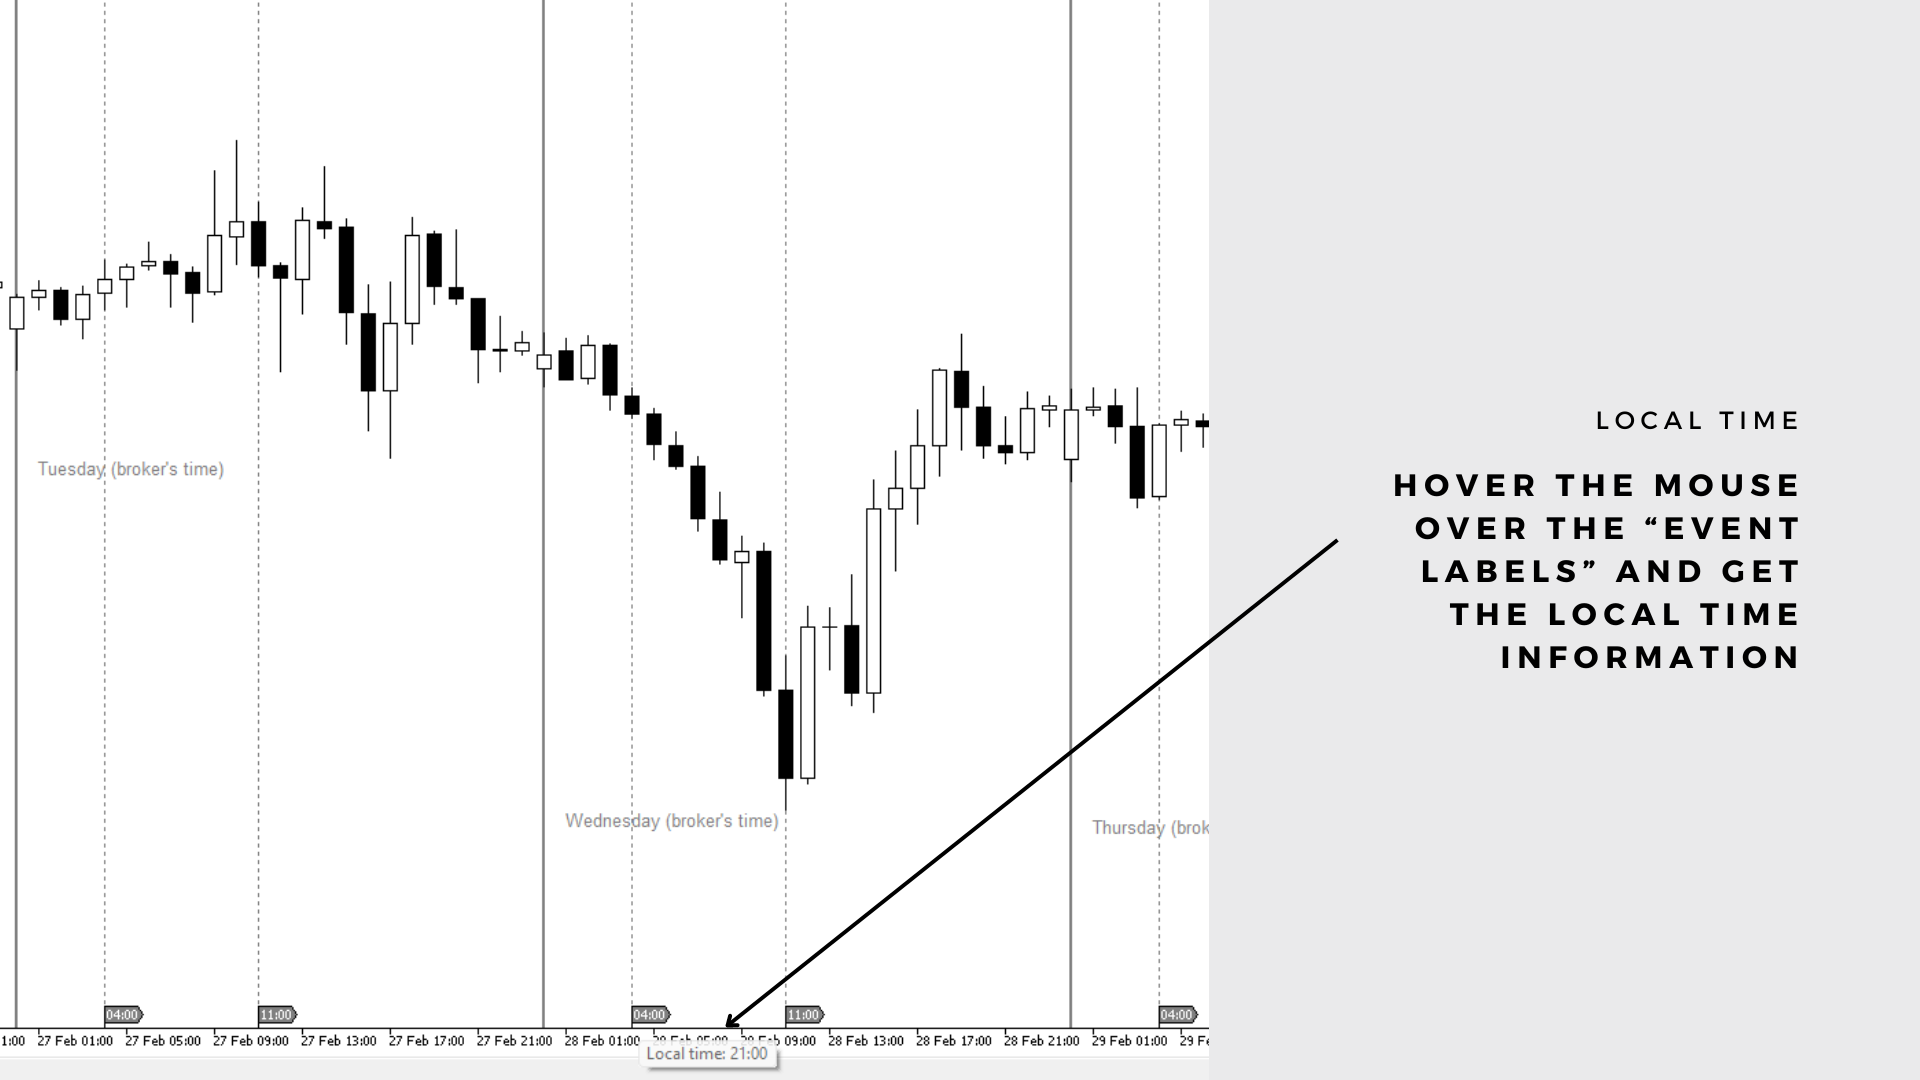
This indicator allows the user to choose not only the Broker's time, but also the Local time. This way, the user no longer needs to calculate local time in relation to the broker's time. With this indicator you choose the way to see the range of hours that best fits your analysis strategy.
FOR MT4 VERSION: CLICK HERE
Key Features:
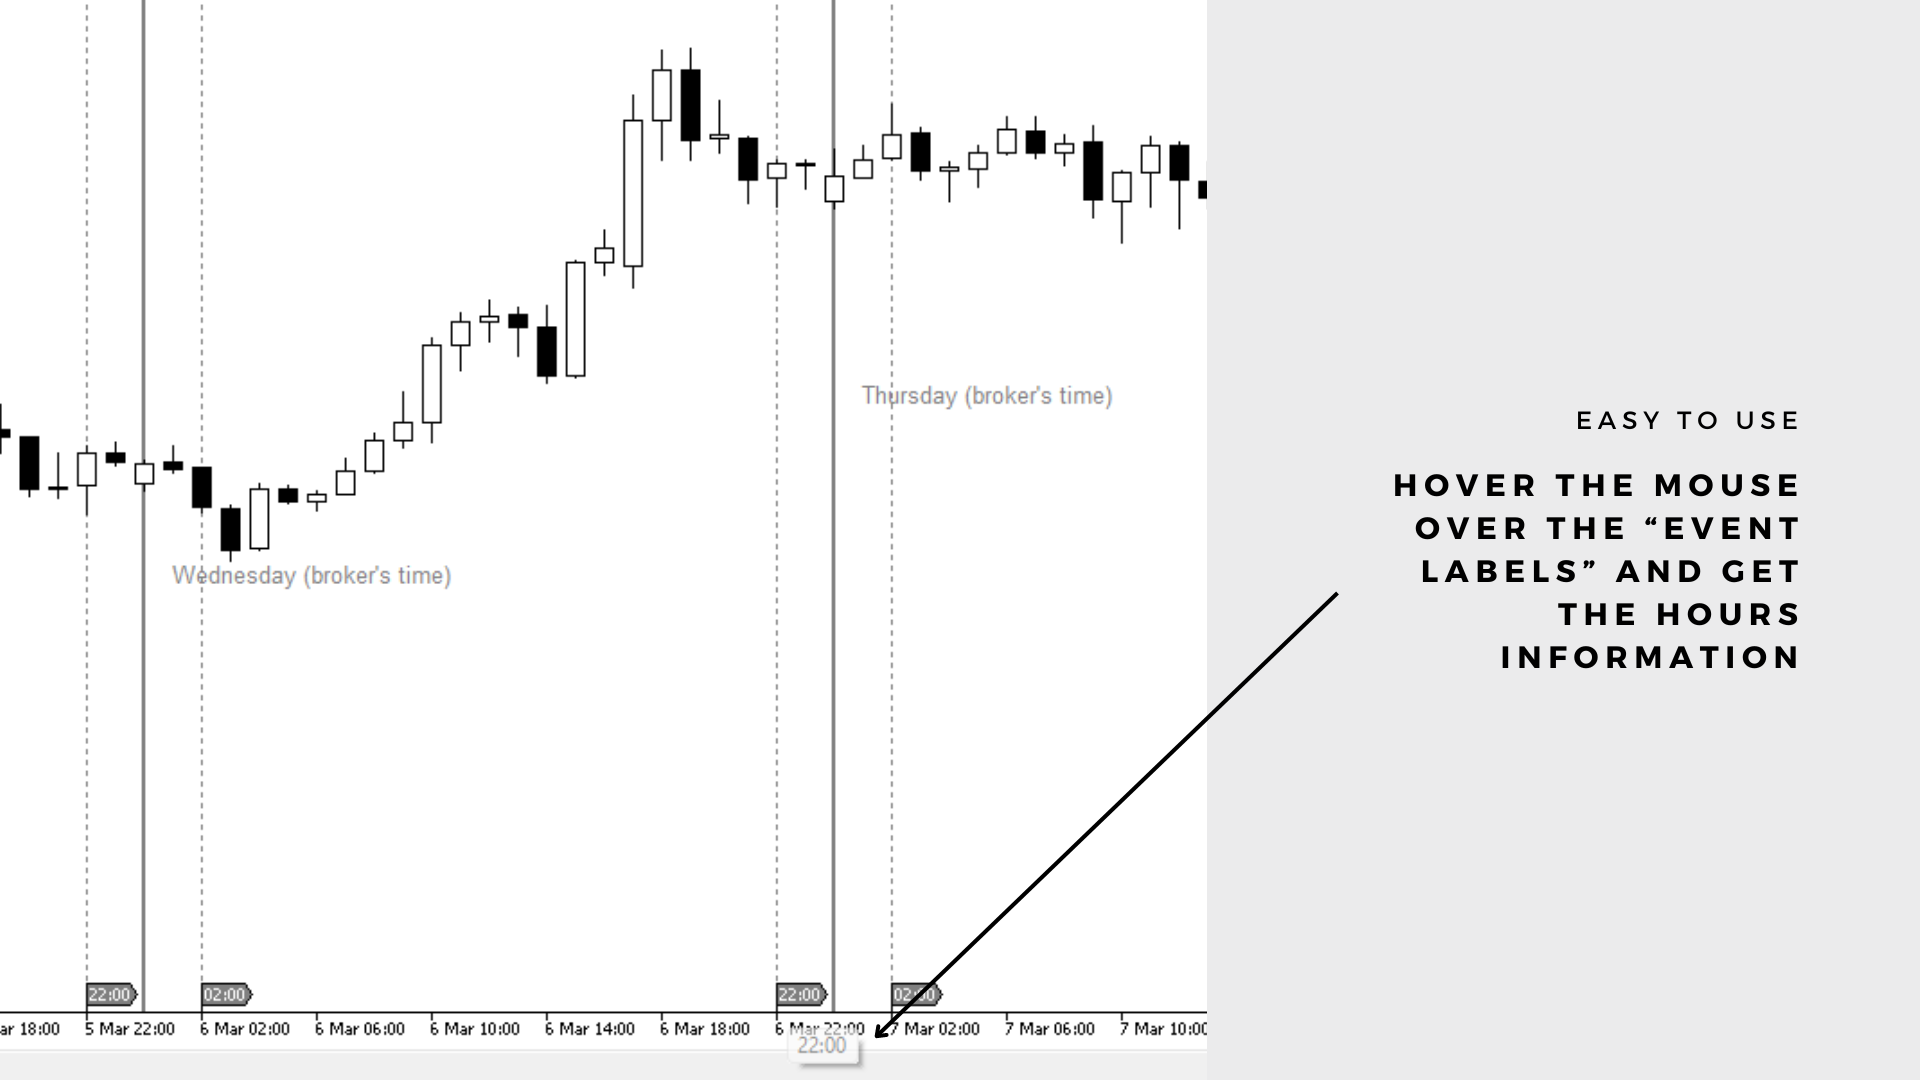
- Hourly Interval Lines: Gain granular insights into price movements with customizable hourly interval lines drawn directly on the chart. Choose specific range of hours to focus on, enabling precise analysis and informed decision-making.
- Broker's time or Local time: You can choose for the lines that show the range of hours to be based on the Broker's time or on your Local time for better visualization according to your strategy or analysis.
- Weekly Interval Lines: Navigate market trends effortlessly with weekly interval lines, strategically placed on the chart for clear visualization of weekly price fluctuations. Identify key support and resistance levels with ease, enhancing your trading strategy.
- User-Friendly Interface: Designed with simplicity in mind, this indicator boasts an intuitive interface, making it accessible to traders of all skill levels. Effortlessly adjust settings and parameters to tailor the indicator to your unique trading preferences.
- Enhanced Backtesting: Elevate your backtesting process with comprehensive visualization of price movements within your preferred trading hours. By focusing on specific timeframes, traders can effectively assess the effectiveness of their strategies and optimize their trading approach for maximum profitability.
- Improved Strategy Refinement: Streamline your strategy refinement process by leveraging the insights provided by this indicator. Understand how price behaves during your available trading hours, allowing you to fine-tune your approach and mitigate the impact of signals occurring outside your trading window.
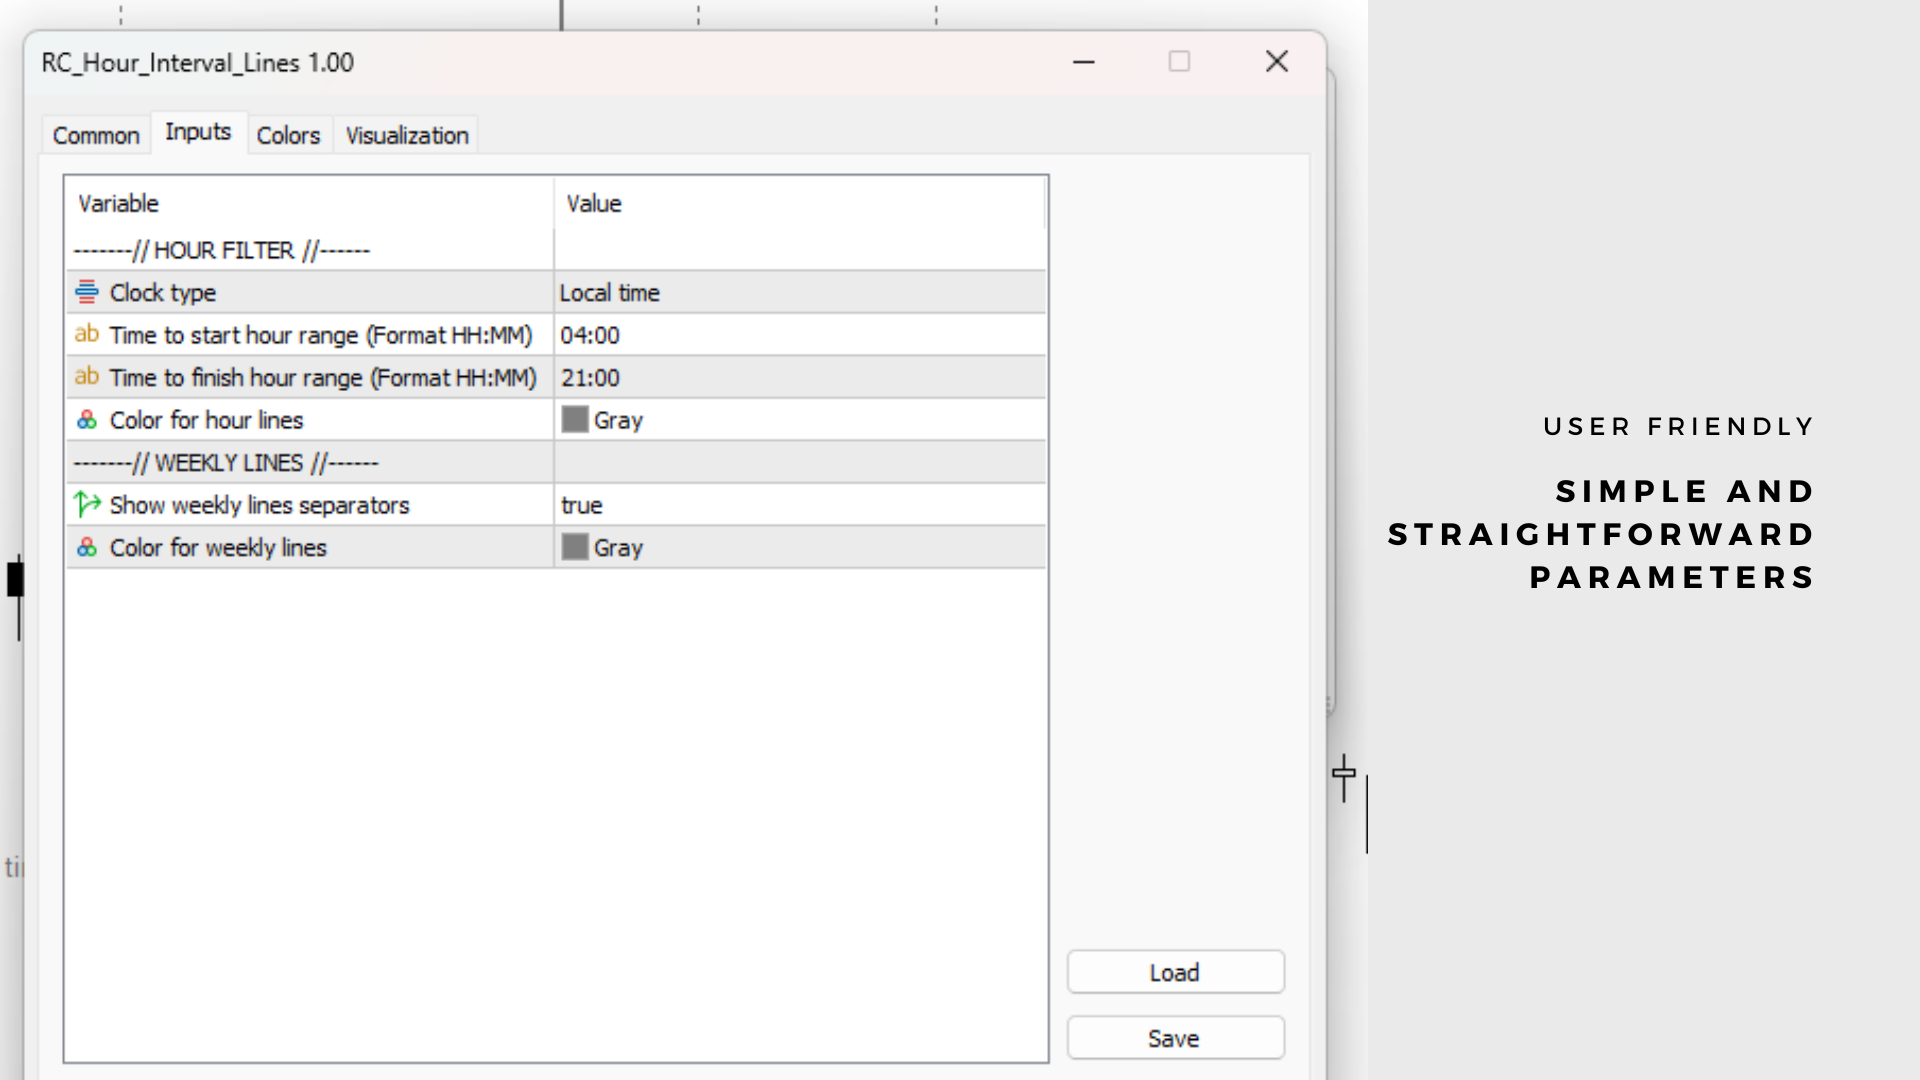
Input parameters
- Clock type: choose Broker's time or Local time for the hour lines to be drawn on the chart.
- Time to start hour range (Format HH:MM): Define the start hour for the indicator lines.
- Time to finish hour range (Format HH:MM): Define the final hour for the indicator lines.
- Color for the hour lines: Define the color for the hour lines.
- Show weekly lines separators: Choose to show (true) or not (false) the weekly lines separators on the chart.
- Color for weekly lines: Define the color for the weekly lines.
Disclaimer
By purchasing and using this indicator, users agree to indemnify and hold harmless its author from any and all claims, damages, losses, or liabilities arising from the use of the indicator. Trading and investing carry inherent risks, and users should carefully consider their financial situation and risk tolerance before using this indicator.
Kullanıcı değerlendirmeye herhangi bir yorum bırakmadı