YouTube'dan Mağaza ile ilgili eğitici videoları izleyin
Bir alım-satım robotu veya gösterge nasıl satın alınır?
Uzman Danışmanınızı
sanal sunucuda çalıştırın
sanal sunucuda çalıştırın
Satın almadan önce göstergeyi/alım-satım robotunu test edin
Mağazada kazanç sağlamak ister misiniz?
Satış için bir ürün nasıl sunulur?
MetaTrader 5 için yeni teknik göstergeler - 69
Boom and Crash Sniper Spike Detector - Boom 900 Unlock the potential of spike trading on Boom 900 with the Boom and Crash Sniper Spike Detector. This cutting-edge indicator provides precise and clear signals, helping you identify high-probability trades and capture spikes effortlessly. Designed for traders who want to enhance their trading performance, this tool simplifies the process of detecting spike opportunities. Key Features: Multi-Timeframe Compatibility : The indicator works across multi
This is Multiple Timeframe of Malaysia SNR Levels and Storyline. The single timeframe version here Features: + Display level on multiple timeframe (higher or lower) + Turn on/off level on timeframe + Alert when price touch level 1. if high > resistance level but close of candle < resistance level , this level become unfresh - Name of level will have "(m)" meaning mitigated if close of candle > resistance level , this level become invalid and can be removed in chart (there is setting for keep/rem

This indicator converted from Squeeze Momentum Indicator [LazyBear] version on TradingView [---- Original Notes ----]
This is a derivative of John Carter's "TTM Squeeze" volatility indicator, as discussed in his book "Mastering the Trade" (chapter 11). The Squeeze Momentum Indicator (or TTM Squeeze) is an indicator that measures volatility and momentum, based on price movement within a tight range for a period of time and then breaking out sharply to initiate large moves.
The most popular versi
Boom 600 Sniper Spike Detector - MQL5 Listing Description Introducing the Boom 600 Sniper Spike Detector – a cutting-edge, non-repainting indicator designed to help you effectively capitalize on spikes in the Boom 600 market. Ideal for both seasoned traders and beginners, this indicator offers precise, actionable signals to enhance your trading strategy and maximize your profit potential. Key Features: Non-Repainting Signals : Guarantees reliable and consistent signals that do not repaint, provi

The Super Trend Extended Indicator is a powerful tool designed to assist traders in identifying market trends and making informed trading decisions. It combines a robust trend-following algorithm with advanced filtering options to provide precise entry and exit signals. Key Features: Trend Identification : The indicator effectively highlights the current market trend, whether bullish or bearish, helping traders stay on the right side of the market. Customizable Parameters : Users can adjust sens
This indicator managge all kind of ICT FVG include: FVG, SIBI, BISI, Inverse FVG. The advantage point of this indicator is mangage FVG on all timeframe. FVG - Fair value gap ICT Fair value gap is found in a “three candles formation” in such a way that the middle candle is a big candlestick with most body range and the candles above & below that candle are short and don’t completely overlap the body of middle candle. * This indicator allow filter FVG by ATR. So you can just show valid FVG which

Visualize seu histórico de negociações de forma estruturada e detalhada, com taxas de acertos e lucro separados por dia, semana, mês e total, além de detalhes sobre o ativo, horário do servidor e posições/ordens em andamento. Este painel foi criado visando o uso em contas do tipo HEDGE, porém pode ser utilizado em contas do tipo NETTING sem nenhum problema. Na versão PREMIUM deste Painel você tem opção de utilizar uma micro boleta com botões para facilitar o tratamento e execução de ordens em an
FREE

Stratos Pali Indicator is a revolutionary tool designed to enhance your trading strategy by accurately identifying market trends. This sophisticated indicator uses a unique algorithm to generate a complete histogram, which records when the trend is Long or Short. When a trend reversal occurs, an arrow appears, indicating the new direction of the trend.
Important Information Revealed Leave a review and contact me via mql5 message to receive My Top 5 set files for Stratos Pali at no cost !
Down

Yenilikleri görmek için "Neler Yeni" bölümüne göz atın. v1.4 sadece küçük düzenlemeler içeriyor, özel bir şey yok.
Bu göstergede özelleştirilebilir bir fraktal göstergesine ihtiyaç duyduğum için bunu oluşturdum. Aynı zamanda azalan hacimleri kontrol ederek bir tür onay sağlar. Aşağıda detaylar mevcut: Genel Bakış Bu gösterge, fiyat hareketi ve hacim dinamiklerini analiz ederek piyasadaki anahtar dönüm noktalarını belirlemeye yardımcı olur. Özellikler Gösterge stratejisinin temeli, genellikle öne
FREE
Nadaraya Watson Envelope Çoklu Para Birimi Tarayıcı MT5 , birden fazla döviz çifti ve zaman diliminde önemli ters dönüş sinyallerini izlemek için kolaylaştırılmış bir yol sunar. TradingView’de doğru ters dönüş sinyalleriyle tanınan popüler bir göstergeye dayanan bu tarayıcı, aynı temel mantığı MT5 uyumlu bir formata uyarlar. Daha düşük zaman dilimlerinde kısa vadeli fırsatlara ve daha yüksek zaman dilimlerinde güçlü trend sinyallerine odaklanarak, traderların piyasa dönüşlerine karşı tetikte olm

CustomRSI50 - 50 Seviyeli Özelleştirilmiş RSI Göstergesi Açıklama CustomRSI50, popüler Göreceli Güç Endeksi (RSI) temel alınarak oluşturulmuş özelleştirilmiş bir teknik göstergedir. Bu gösterge, birçok trader için momentum analizinde kritik öneme sahip olan 50 seviyesine özel vurgu yaparak, RSI'nin net ve özelleştirilebilir bir görselleştirmesini sunar. Ana Özellikler Yapılandırılabilir RSI periyodu Vurgulanan 50 seviyesi referans çizgisi Özelleştirilebilir uygulanan fiyat türü Ayrı pencerede gö
FREE

Imbalance DOM Pro: Emir defteri dengesizlikleriyle işlemlerinizi güçlendirin MT5'TE EMİR DEFTERİNE ERİŞİMİNİZ VAR MI? İŞLEMLERİNİZİ YENİ BİR SEVİYEYE TAŞIMAK İSTER MİSİNİZ? Eğer emir akışına dayalı işlem yapıyorsanız, Imbalance DOM Pro analizlerinizi devrim niteliğinde değiştirebilir. Scalperlar ve kısa vadeli traderlar için mükemmel olan bu araç, emir defterindeki dengesizlikleri tespit eder ve hızlı ve doğru giriş-çıkışlar için değerli işlem fırsatları sunar. Küçük fiyat hareketlerinde

Trilliant trend göstergesi.
Trilliant trend, trendi erken tespit etmek için gizli saygın göstergeleri birleştiren gelişmiş bir forex göstergesidir. Adının gösterdiği gibi bu bir trend göstergesi ama neredeyse tüm forex stratejileri (her biri) ticaret için birleştirilmiştir, göstergede ayarları, bantları ve satırları manipüle eder.
Her forex stratejisi trilyonluk eğilimi kullanarak ticaret edilebilir. Koşullar oluşturan mumlar bir satın alma sinyali okunuşu vermek için trilliant üst bantı ve

Radius Trend by ChartPrime MT5 ile ticaret stratejinizi yükseltin, fiyat aksiyonuna ve volatiliteye dayalı dinamik trend bantlarını gerçek zamanlı olarak ayarlayan gelişmiş bir teknik analiz aracı, trend yönü, gücü ve potansiyel dönüşler hakkında insights sağlar. ChartPrime tarafından geliştirilen bu gösterge, statik trend hatlarından farklı olarak, grafiği bir radar gibi tarayan benzersiz bir radius tabanlı yöntem kullanır ve piyasa koşullarına uyarlanır. MQL5'te yenilikçi yaklaşımıyla popüler,

Merhaba yatırımcılar, HiperCube size yeni bir gösterge olan MTF MA'yı sunmaktan mutluluk duyuyorum! Darwinex Zero'da %25 indirim kodu: DWZ2328770MGM HiperCube Çoklu Zaman Çerçevesi Hareketli Ortalaması veya MTF MA, MA'yı daha yüksek zaman çerçevesinden ve diğer daha düşük zaman çerçevesinden görüntülemenize izin veren bir göstergedir, çok basit.
Özellikler: Açılır menüden Zaman Çerçevesini seçin Özel Dönem MA Özel MA türü (EMA, SMA...) MTF MA'nın Özel Rengi Geliştirmek için Chat gpt ve AI kull
FREE

Forex için manuel ticaret ve teknik analiz göstergesi.
İşlem gününün açılış seviyesini gösteren bir trend göstergesi ve giriş noktalarını belirlemek için bir ok göstergesinden oluşur.
Gösterge yeniden renklenmez; mum kapandığında çalışır.
Sinyal okları için çeşitli uyarı türleri içerir.
Herhangi bir grafikte, alım satım aracında veya zaman diliminde çalışacak şekilde yapılandırılabilir.
Çalışma stratejisi trend boyunca fiyat hareketlerini aramaya dayanmaktadır.
" Buy " işlemleri yapabilmek

Introducing Volume Orderflow Profile , a versatile tool designed to help traders visualize and understand the dynamics of buying and selling pressure within a specified lookback period. Perfect for those looking to gain deeper insights into volume-based market behavior! MT4 Version - https://www.mql5.com/en/market/product/122656/ The indicator gathers data on high and low prices, along with buy and sell volumes, over a user-defined period. It calculates the maximum and minimum prices during t

Ekom Spike Detector Pro
Take your trading to the next level with the Ekom Boom and Crash Spike Detector Indicator Pro, designed for serious traders who demand more. This advanced version provides: Key Features: Accurate Spike Detection: Identify high-probability spike patterns in real-time using price action Clear Visual Signals: Displays clear buy and sell arrows on the chart for easy decision-making Alert options : MT5 Alert/Notification to receive alerts on your mobile when signal

This is an advanced indicator used with success rate.Unlock the secrets of trading Boom and Crash spikes with our powerful MT5 indicator! This spike detection tool provides accurate buy and sell signals, trade alerts, and High success rate entries. Perfect for scalping, day trading, and swing trading. Get the best Boom and Crash strategy with our Deriv Boom and Crash spike indicator. Indicator does not redraw or repaint. Recommendation
· Use a Virtual Private Server (VPS) for 24/7 alerts on mob
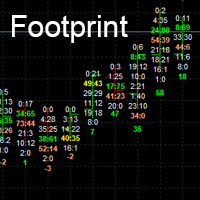
Footprint charts can add a level of depth to your visuals that standard charts cannot achieve.
Footprint charts are a powerful way to visualize the ups and downs of the market, helping you potentially to make better trading decisions. Orderflow Footprint in MT5. show # of market orders at each tick.
Inputs
Point Scale *1 to *10000
Number of candle to show. Font Size Max Bid Color (Top Seller) Max Ask Color (Top Buyer) Max Bid and Ask Color
Normal color

ATR Bands with Take-Profit Zones for MT5 Optimize your risk management and trading strategy with the ATR Bands indicator for MT5 – a powerful tool designed to help you navigate market volatility, identify key price levels, and set realistic stop-loss and take-profit targets. Key Features: ATR-Based Bands : The core of this indicator relies on the Average True Range (ATR) to calculate dynamic upper and lower bands that adapt to market volatility. The bands provide a clear indication of potential
FREE
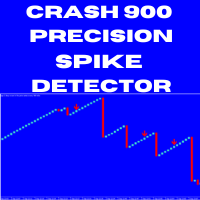
Crash 900 Precision Spike Detector The Crash 900 Precision Spike Detector is your ultimate tool for trading the Crash 900 market with precision and confidence. Equipped with advanced features, this indicator helps you identify potential sell opportunities and reversals, making it an essential tool for traders aiming to capture spikes with minimal effort. Key Features: Non-Repainting Signals: Accurate, non-repainting signals that you can trust for reliable trading decisions. Audible Alerts: Stay

1. What is this Due to the limitation of MT5 software, we can only see the minimum 1-minute candlestick chart. Sometimes this is not enough for high-frequency traders, or we want to see a more detailed candlestick chart. This tool allows you to see: A candlestick chart composed of N ticks, which allows you to better understand the price fluctuations. For example, each candle line has 20 ticks, or 70 ticks.
2. Parameters: NTick = 70; // The tick cnt for one candle BandsPeriod = 20;

1. What is this Due to the limitation of MT5 software, we can only see the minimum 1-minute candlestick chart. Sometimes this is not enough for high-frequency traders, or we want to see a more detailed candlestick chart. This tool allows you to see: A candlestick chart composed of N seconds, which allows you to better understand the price fluctuations. For example, each candle line has 20 seconds, or 30 seconds.
2. Parameters: SecondCandle = 20; // The second cnt for one candle, Needs
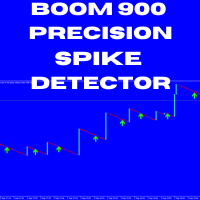
Boom 900 Precision Spike Detector The Boom 900 Precision Spike Detector is a powerful tool designed to help traders accurately identify spike opportunities in the Boom 900 market. With advanced features and precise alerts, this indicator takes the guesswork out of trading, enabling you to maximize your profits with confidence. Key Features: Non-Repainting Signals: Get reliable signals without repainting, ensuring your trading decisions are based on accurate, real-time data. Audible Alerts: Stay
Engulfing Pattern is a free indicator available for MT4/MT5 platforms, its work is to provide "alerts" when a "Bullish" or "Bearish engulfing pattern forms on the timeframe. This indicator comes with alerts options mentioned in the parameter section below. Join our MQL5 group , where we share important news and updates. You are also welcome to join our private channel as well, contact me for the private link. Engulfing Pattern Indicator MT4 Other Products Try our Martini EA with 2 years of liv
FREE
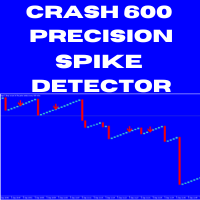
Crash 600 Precision Spike Detector The Crash 600 Precision Spike Detector is an essential tool designed to help traders navigate the Crash 600 market with accuracy and efficiency. Packed with advanced features, this indicator provides precise alerts that allow traders to capture spikes and reversals with confidence. Key Features: Non-Repainting Signals: Dependable, non-repainting signals that ensure your trading decisions are based on real-time, accurate data. Audible Alerts: Receive sound notif
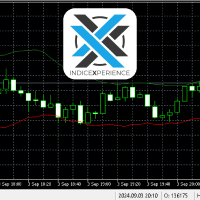
Indicador para mercado de Índice Futuro Brasileiro (WIN) __________________________________________________________________________________________________
O indicador trabalha com rompimento de canal indicando o sentido do movimento e os 3 possíveis TP e o SL baseado no ATR.
Indicação de utilização em TimeFrame de 5M, mas pode ser utilizado em qualquer tempo gráfico de sua preferencia. __________________________________________________________________________________________________

The Multi Pairs Forex Indicator is an advanced trading too l that allows traders to track and analyze the performance of multiple currency pairs in real-time on a single chart. It consolidates data from various Forex pairs, providing an at-a-glance overview of market conditions across different currencies and helps you save time. Useful for various trading styles, including scalping, day trading, and swing trading. Whether you're monitoring major pairs like EUR/USD, GBP/USD, or more exoti
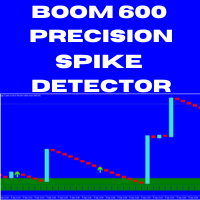
Boom 600 Precision Spike Detector The Boom 600 Precision Spike Detector is your ultimate tool for trading the Boom 600 market with precision and confidence. Equipped with advanced features, this indicator helps you identify potential buy opportunities and reversals, making it an essential tool for traders aiming to capture spikes with minimal effort. Key Features: Non-Repainting Signals: Accurate, non-repainting signals that you can trust for reliable trading decisions. Audible Alerts: Stay on t

In the context of trading, Malaysia SNR (Support and Resistance) refers to the technical analysis of support and resistance levels in financial markets, particularly for stocks, indices, or other assets traded. This is single timeframe version. Multiple timeframe version is avaiable here . There are three type of Malaysia SNR level Classic , GAP and Flipped 1. Classic Support is the price level at which an asset tends to stop falling and may start to rebound. It acts as a "floor" where demand is
MA Öldürücü Göstergesi, hareketli ortalamaları kullanan yatırımcılar için nihai silahtır. Doğrudan bir yönetim paneli tarafından erişilebilen çeşitli araçları kullanan eksiksiz bir sistemdir. Araçları sayesinde piyasa hakkında genel bir bakışa sahip olursunuz ve bir pozisyona giriş için karar vermede değerli yardıma sahip olursunuz.
Şunlardan oluşur:
- Bir renk kodu kullanarak trendi doğrudan grafik üzerinde görüntüleyen Trend grafiği Ana göstergesi. Bu eğilim, iki hareketli ortalama ve birkaç

Ticaret breakout'lerinizi Trendlines with Breaks by LuxAlgo MT5 ile geliştirin, pivot tabanlı yenilikçi bir gösterge ki dinamik trend hatlarını otomatik çizer ve gerçek zamanlı breakout'leri vurgular, TradingView'daki popüler LuxAlgo suite'inden esinlenerek 100.000'den fazla kullanım ve olumlu incelemeler toplamış, destek/direnç seviyelerini tespit etmedeki doğruluğu için. Reddit ve YouTube gibi ticaret topluluklarında non-repainting seçeneği ve özelleştirilebilir eğimler için kutlanan, bu araç

Genel Bakış Multi Level ATR ve Hareketli Ortalama Bandı göstergesi, fiyat hareketlerini volatiliteyi göz önünde bulundurarak kapsamlı bir analiz sunar. Çeşitli bantlar aracılığıyla görsel temsil, trend ve konsolidasyon aşamalarını, ayrıca potansiyel tersine dönme noktalarını belirlemeyi kolaylaştırır. Özelleştirme seçenekleri sayesinde kullanıcılar, göstergeleri ticaret ihtiyaçlarına göre uyarlayabilirler. Özellikler Birden Fazla Bant Görselleştirmesi: Fiyat seviyeleri, yüksek, orta ve düşük değ
FREE

Trade Sniper'ı Tanıtıyoruz: Piyasalardaki Avantajınız.
MT4 Sürümü: https://www.mql5.com/en/market/product/122371
Kârlı işlemleri kaçırmaktan veya piyasanın yanlış tarafında yakalanmaktan bıktınız mı? Ticaretinizde size keskin bir avantaj sağlamak için trendlerin gücünden yararlanan son teknoloji gösterge Trade Sniper ile tanışın.
Trend Sniper sıradan bir gösterge değil. Gelişmiş algoritmaları zamanla test edilmiş ticaret prensipleriyle birleştiren ve yüksek olasılıklı ticaret fırsatlarını ol

TK - Rainbow Indicator Description: The TK - Rainbow indicator is a robust tool for technical analysis, designed to provide a clear view of market trends through a multi-line approach. With 30 lines calculated at different periods, it offers an extensive analysis of price movements. The indicator uses a dual-color scheme to highlight upward and downward trends, making it easy to interpret market conditions at a glance. Key Features: 30 Lines: Each line represents a different smoothing period to
FREE

Smart Fibo Zones are powerful, auto-generated Fibonacci Retracements that are anchored to key market structure shifts . These zones serve as critical Supply and Demand levels, guiding you to identify potential price reactions and confirm market direction. Fibonacci calculations, widely used by professional traders, can be complex when it comes to identifying highs and lows. However, Smart Fibo Zones simplify this process by automatically highlighting order blocks and key zones, compl

Hydra Trend Rider is a non-repainting, multi-timeframe trend indicator that delivers precise buy/sell signals and real-time alerts for high-probability trade setups. With its color-coded trend line, customizable dashboard, and mobile notifications, it's perfect for traders seeking clarity, confidence, and consistency in trend trading. Setup & Guide: Download MT4 Version here. To learn how to use the Indicator: Indicator Manual & Guide - Read Here
Follow our MQL5 channel for daily market ins
Ekom Spike Detector
Navigate the volatile world of Boom and Crash indices with the Ekom Spike Detector Indicator. This powerful tool detects explosive price movements, providing traders with precise buy and sell signals 24/7.
Key Features:
Spike Detection : Identify high-probability spike patterns in real-time Clear Visual Signals : Displays clear buy and sell arrows on the chart for easy decision-making Customizable : Easily switch from either Boom based on individuals choice Reliable : Te
FREE

Note from Developer:
This is the lite version of the Double TMA with Bands Indicator.
You can find the paid version that comes with alerts and on screen signal arrows built in here .
I will also be selling an EA based on this trading system soon once all backtesting and optimization have been completed.
Unlock your trading potential with the Double TMA Indicator with Reversal Detection!
Designed for swing and reversal trading, this versatile tool integrates two Triangular Moving Averages (
FREE

Volume Delta Candles offer a straightforward way to analyze trading activity within each candle, making it easier to see what's happening without needing an extra volume indicator. This tool uses lower timeframe or real-time data to show the percentage of buying and selling volume within a candle as a colored bar. Make sure you understand Volume and Volume Delta before jumping in. If you’re not sure, reach out to me first for a quick rundown. But if you're already familiar, you're good to go! Ke
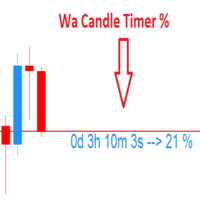
Wa Candle Timer Percentage MT5 is an indicator which shows the user how much time is remaining until the next candle will form. The percentage of the evolution of the current candle is also displayed. The user can set the percentage that the candle timer will change the color. These are the settings: 1- The percentage that the candle timer will change the color. 2- Color of Candle Timer when it's BELOW the percentage set by the user. 3- Color of Candle Timer when it's ABOVE the percentage set b
FREE

MACD ADX Oscillator – a powerful indicator that combines the best of the Moving Average Convergence Divergence (MACD) and the Average Directional Index (ADX) to provide unparalleled insights into market momentum and trend strength.
Key Features: Dual Momentum Analysis: This indicator merges MACD's ability to detect changes in market momentum with ADX's strength measurement, giving you a comprehensive view of the market's direction and power. Customizable Settings: Tailor the indicator to your t

Percentage Price Oscillator (PPO) for MT5 – a dynamic tool designed to measure price momentum and trend direction with precision. Core Features: Flexible Configuration : Customize the PPO to match your trading approach by adjusting the Fast Length, Slow Length, and Signal Length. The indicator is also versatile enough to adapt to any market condition with various source inputs. Intuitive Histogram Display : Choose to visualize the difference between the PPO and Signal lines with a histogram, pro

TheCubeTheory - Seu Indicador de Análise de Mercado em Cubos Descrição Completa O Que é o TheCubeTheory? O TheCubeTheory é um indicador exclusivo para MetaTrader 5 que mapeia os níveis de suporte e resistência usando uma abordagem inovadora baseada em cubos de tempo e Fibonacci . Desenvolvido pela Ethernal , ele combina: Análise de Máximas e Mínimas em períodos personalizáveis Níveis Automáticos (8 níveis ajustáveis) Visualização em Tempo Real com retângulos e linhas col
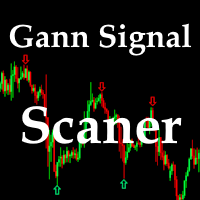
This indicator is based on a certain algorithm and acts as a market scanner. All you need to do is fill in the selected currency pairs in the settings and that’s it. Next, the indicator itself will view all these currency pairs and time frames from M5 to D1 simultaneously. When a new signal appears, the indicator will give you an Alert and also draw the letter N where this new signal will be.
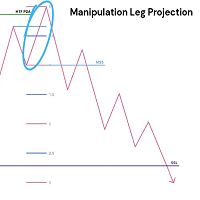
This indicator delves into using standard deviations as a tool in trading, specifically within the Inner Circle Trader (ICT) framework. Standard deviations are a statistical measure that helps traders understand the variability of price movements. These projections is use to forecast potential price targets, identify support and resistance levels, and enhance overall trading strategies. Key Concepts: Understanding Standard Deviations : Standard deviations measure how much a set of values (in thi
Stochastic Alert Indicator for MetaTrader 5
The Stochastic Alert Indicator is a powerful and customizable tool designed for the MetaTrader 5 platform, perfect for traders who want to monitor overbought and oversold conditions while staying informed of potential buying and selling pressure. Key Features: Overbought/Oversold Detection: Automatically detects when the market reaches overbought (above 80) or oversold (below 20) levels, providing you with timely alerts for potential reversal points.

Moving Average Crossover Alerts by Chart Walker
The Moving Average Crossover Alerts Indicator is designed to help traders identify potential trend reversals and entry/exit points in the market. By tracking two moving averages—typically a faster (short-term) and a slower (long-term) one—the indicator generates alerts whenever these moving averages cross. Key Features: Customizable Moving Averages: Choose from various types of moving averages (SMA, EMA, WMA, etc.) and set your desired periods for

Coral trend is a trend-following indicator that is widely popular among FOREX traders . It is usually used as a confluence with other indicators. It uses combinations of moving averages with complex smoothing formulas! It has two configurable parameters: Coefficient - smoothing ratio (*)
Applied price Calculation: Coral = (-0.064) * B6 + 0.672 * B5 - 2.352 * B4 + 2.744 * B3
FREE

The true strength index is a technical indicator used in the analysis of financial markets that attempts to show both trend direction and overbought/oversold conditions. It was first published William Blau in 1991. The indicator uses moving averages of the underlying momentum of a financial instrument. The True Strength Index (TSI) is a momentum oscillator that ranges between limits of -100 and +100 and has a base value of 0.
FREE

The SpreadTracer and TimeLeft indicator is a powerful yet straightforward tool designed for traders who want to keep a close eye on market conditions directly on their chart. This custom indicator provides essential real-time information about the spread and candle time, making it easier to make informed trading decisions. Key Features: Current Spread Monitoring : The indicator constantly displays the current spread of the trading pair, helping you assess the cost of entering or exiting a positi
FREE

Trendline Wizard Overview: The Trendline Wizard is a powerful and versatile MetaTrader 5 indicator designed for traders who rely on trendlines for their technical analysis. This indicator automatically monitors specified trendlines and provides real-time alerts when price action interacts with these critical levels. Whether you’re a swing trader, day trader, or long-term investor, the Trendline Wizard is an essential tool to enhance your trading strategy. Key Features: Customizable Alerts : Set
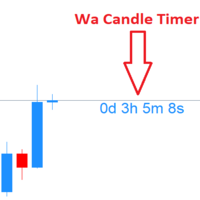
Wa Candle Timer MT5 , MT5 grafiğinizde bir sonraki mum oluşana kadar kalan süreyi gösteren güçlü ve kullanıcı dostu bir göstergedir. Mum kapanış sürelerinin farkında olmanıza yardımcı olarak daha iyi işlem yürütme ve karar verme sağlar. Temel Özellikler :
Mevcut mum için geri sayım sayacı gösterir.
Kalan süre, kullanıcı tarafından tanımlanan yüzde seviyesinin altına düştüğünde renk değiştirir.
Belirli bir yüzdeye ulaşıldığında özelleştirilebilir uyarı verir.
Yazı tipi ve renkler tama
FREE

HiperCube AutoTrend Lines Darwinex Zero'da %20 indirim kodu: DWZ2328770MGM_20 Bu gösterge, destekleri ve dirençleri kolayca belirlemenize, grafikte çizgiler çizmenize ve piyasada önemli bir noktanın nerede olduğunu bilmenize yardımcı olur. Bu araç, işinizin bir kısmını sizin için yaparak, ticaretinizi yarı otomatik hale getirmenin en iyi yoludur. Direnç veya Destek, bazen belirlenmesi zor olan önemli seviyelerdir, ancak artık bu size daha fazla kafa karışıklığı yaratmayacaktır HiperCube Autotre
FREE
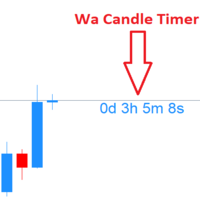
Wa Candle Timer MT5 , ana grafikte mevcut mumun kapanmasına kalan süreyi canlı geri sayım olarak gösterir. Bar sonuna yaklaştıkça zamanlayıcının rengi değişir (varsayılan: mum süresinin ~%95’i geçtiğinde, yani ~%5 süre kaldığında).
Hafif, net ve işlemleri mum kapanışına göre senkronize eden trader’lar için idealdir. Öne çıkan özellikler Her sembol ve zaman dilimi için kapanışa kadar gerçek zamanlı geri sayım . Mum bitime yaklaştığında renk değişimi (varsayılan eşik ≈ %95 geçildi). Temiz ve göze
FREE

HiperCube Renko Mumlarına Hoş Geldiniz Darwinex Zero'da %25 indirim kodu: DWZ2328770MGM Bu gösterge size gerçek piyasa bilgisi sağlar ve onu Renko Mum Stiline dönüştürür.
Tanım Renko grafikleri, fiyat hareketlerini temsil etmek için tuğlalar (veya çubuklar) kullanarak fiyat değişimlerini ölçen ve çizen bir tür finansal grafiktir. Geleneksel mum grafiklerinin aksine, Renko grafikleri yalnızca fiyat dalgalanmalarına odaklanarak zaman tabanlı bilgileri görüntülemez.
Özellikler: Ayrı pencerelerde
FREE

"HiperCube USD ENDEKSİ (DXY /USDX) ", hisse senetleri, tahviller veya emtialar gibi belirli bir varlık grubunun performansını temsil eden ve değerleri ABD doları cinsinden olan bir finansal kıyaslama ölçütüdür. Bu endeksler yatırımcıların belirli sektörlerin veya piyasaların performansını zaman içinde takip etmelerine ve karşılaştırmalarına yardımcı olur. Endeks, ABD doları cinsinden ifade edilerek, varlıkların yerel para birimi veya coğrafi konumundan bağımsız olarak yatırımları değerlendirmek
FREE

ATLogic ATLogic Göstergesi: Tüm Alım Satım Araçları için Çok Yönlü Bir Araç ATLogic, tüm döviz çiftleri, endeksler ve kripto paralar dahil olmak üzere geniş bir yelpazedeki finansal araçlar için tasarlanmış kapsamlı ve kullanıcı dostu bir teknik analiz aracıdır. Bu çok yönlü gösterge, çeşitli piyasalarda tüccarlar için güçlü içgörüler sunar:
Satın aldıktan sonra bir mesaj bırakın ve özel bir bonus hediye alın.
"Bu göstergeyi daha etkili kullanmayı öğrenmek için AI eğitmenimle bağlantı kurmak

CVD SmoothFlow Pro - Her Varlık İçin Sınırsız Hacim Analizi! CVD SmoothFlow Pro , hassas ve sınırsız bir hacim analizi arayan trader'lar için nihai çözümüdür. Cumulative Volume Delta (CVD) hesaplamasını ve gelişmiş gürültü filtrelemesini kullanarak, Pro sürümü herhangi bir finansal varlık için gereken esneklik ve doğruluğu sağlar. CVD SmoothFlow Pro Neler Sunar? Açık Analiz : Pazar gürültüsünü filtreler ve her finansal varlıkta önemli hacim hareketlerini vurgular. ️ Kesin Hesaplama : Alım

Süper Gösterge, yeni ve deneyimli yatırımcılar için özel olarak tasarlanmış kapsamlı bir ticaret çözümüdür. Uyarı vermek için 5'ten fazla göstergeyi birleştirir
Sinyal Netliği: Açık giriş ve çıkış noktaları için ok sinyalleri sunar. Gerçek Zamanlı Uyarılar: Yatırımcıları ticari giriş ve çıkış uyarılarıyla bilgilendirir. Özellikler:
Yeniden boyanmaz Maksimum aktivasyon 7'den fazla strateji 5 Gösterge hepsi bir arada Giriş ve çıkış noktaları ve oklar Telefon ve e-postaya uyarılar Önerile
Cm Ultimate Ma Mtf MT5 ile ticaret kararlarınızı geliştirin, çoklu zaman dilimi analizi için geniş özelleştirme sunan güçlü bir hareketli ortalama göstergesi. TradingView'in popüler araçlarından ilham alınarak MT5 için optimize edilmiş bu gösterge, SMA, EMA, WMA, HullMA, VWMA, RMA, TEMA ve Tilson T3 dahil çeşitli MA türlerini destekler, 2010'lardan beri farklı zaman dilimlerinden dual MA plot etme yeteneğiyle popülerlik kazanmıştır. Yeniden boyama yapmayan ve kullanıcı dostu olan bu gösterge, fi

HiperCube VIX'e hoş geldiniz Darwinex Zero'da %25 indirim kodu: DWZ2328770MGM Bu gösterge size sp500 / us500 hacimli piyasa hakkında gerçek bilgi sağlar
Tanım HiperCube VIX, CBOE Volatilite Endeksi olarak bilinir ve piyasa korkusu veya stresinin yaygın olarak bilinen bir ölçüsüdür. Geniş piyasa için bir vekil olarak S&P 500 endeksini kullanarak hisse senedi piyasasındaki belirsizlik ve volatilite seviyesini işaret eder. VIX Endeksi, S&P 500 endeksindeki opsiyon sözleşmelerinin fiyatlarına göre
FREE

HiperCube DonChian'a hoş geldiniz Darwinex Zero'da %20 indirim kodu: DWZ2328770MGM_20 Bu gösterge, fiyatın muhtemelen ne zaman yukarı veya aşağı gideceğini gösteren çok kullanışlı bir fiyat bilgisi sağlar.
Özellikler: Ana pencerelerdeki gösterge Mumlarınızın Renklerini özelleştirin Göstergenin Özel Dönemi Set Off Ayar parametreleri
Nasıl yorumlanır: Yukarı trend: Bazı mumlar üst banttan yukarı çıkarsa, bir boğa koşusunun gelmesi olasıdır. Düşüş trendi: Bazı mumlar alt banttan aşağı inerse, bi
FREE

HiperCube Piyasa Profili! Darwinex Zero'da %20 indirim kodu: DWZ2328770MGM_20 Piyasa Profili, fiyat ve zaman bilgilerini bir dağıtım biçiminde birleştiren grafiksel bir gösterimdir. Fiyat bilgilerini dikey ölçekte (y ekseni) ve hacim bilgilerini yatay ölçekte (x ekseni) görüntüler. Bu grafik türü, piyasa aktivitesine ilişkin içgörüler sunarak, yatırımcıların adil piyasa değerini gerçek zamanlı olarak görselleştirmelerine ve değerlendirmelerine olanak tanır.
Özellikler: Özel Renkler Özel Grafik
FREE

HiperCube ADX Histogramı burada! Darwinex Zero'da %25 indirim kodu: DWZ2328770MGM Bu göstergeler piyasada güçlü bir trend olup olmadığını anlamanıza yardımcı olur. ADX çok popüler ve kullanışlı bir göstergedir, bu nedenle birçok üst düzey yatırımcı kötü işlemlere filtre olarak veya diğer analizlerin kombinasyonlarında kullanılmasını önermektedir. HiperCube ADX ile ticaretiniz için güzel ve harika bir gösterge kullanarak birinci sınıf bir deneyim yaşayacaksınız.
ÖZELLİKLER: Tamamen Özelleştiril
FREE
The Omega Trend Indicator is an advanced tool that has been specifically designed to detect market trends early, and follow them efficiently. The indicator draws two lines. The main (thicker) Trend Line represents the presumed lower or upper volatility limits of the current market trend. A break in the main Trend Line indicates a potential reversal or shift in the movement of the trend. The Trend Line also indicates the best point to place a stop loss order. In Omega Trend Indicator, the Trend L
FREE

Previous Candle Levels MT5 shows the previous candle levels, it shows the previous candle Open High Low Close levels (OHLC Levels) in different time frame. It's designed to help the trader to analyse the market and pay attention to the previous candle levels in different time frame. We all know that the OHLC Levels in Monthly, Weekly and Daily are really strong and must of the time, the price strongly reacts at those levels. In the technical analysis, the user can use them as a support and res
FREE

!!!This Free Version just works on EURUSD!!! Wa Previous Candle Levels MT5 shows the previous candle levels, it shows the previous candle Open High Low Close levels (OHLC Levels) in different time frame. It's designed to help the trader to analyse the market and pay attention to the previous candle levels in different time frame. We all know that the OHLC Levels in Monthly, Weekly and Daily are really strong and must of the time, the price strongly reacts at those levels. In the technical anal
FREE

DYJ SmoothedMA Strategy is a very simple but powerful system to get forex and s ynthetic market trend direction. This indicator is actually a moving average indicator containing 10 smoothing algorithms in a file . The indicator can help you to see the whole trend break out/rebound signal. And these BUY and SELL signals are sent out. You can use DYJ GameDevice follow-up software to receive these signals and realize automatic opening and closing of positions. And can use the game strategy fu
MetaTrader mağazası, geliştiricilerin alım-satım uygulamalarını satabilecekleri basit ve kullanışlı bir sitedir.
Ürününüzü yayınlamanıza yardımcı olacağız ve size Mağaza için ürününüzün açıklamasını nasıl hazırlayacağınızı anlatacağız. Mağazadaki tüm uygulamalar şifreleme korumalıdır ve yalnızca alıcının bilgisayarında çalıştırılabilir. İllegal kopyalama yapılamaz.
Alım-satım fırsatlarını kaçırıyorsunuz:
- Ücretsiz alım-satım uygulamaları
- İşlem kopyalama için 8.000'den fazla sinyal
- Finansal piyasaları keşfetmek için ekonomik haberler
Kayıt
Giriş yap
Gizlilik ve Veri Koruma Politikasını ve MQL5.com Kullanım Şartlarını kabul edersiniz
Hesabınız yoksa, lütfen kaydolun
MQL5.com web sitesine giriş yapmak için çerezlerin kullanımına izin vermelisiniz.
Lütfen tarayıcınızda gerekli ayarı etkinleştirin, aksi takdirde giriş yapamazsınız.