YouTube'dan Mağaza ile ilgili eğitici videoları izleyin
Bir alım-satım robotu veya gösterge nasıl satın alınır?
Uzman Danışmanınızı
sanal sunucuda çalıştırın
sanal sunucuda çalıştırın
Satın almadan önce göstergeyi/alım-satım robotunu test edin
Mağazada kazanç sağlamak ister misiniz?
Satış için bir ürün nasıl sunulur?
MetaTrader 5 için yeni teknik göstergeler - 64

Fibonacci'nin gücünü Adaptive Fibonacci Trend Ribbon (AFTR) ile serbest bırakın! Ticaret stratejinizi devrim niteliğinde değiştirmeye hazır mısınız? AFTR, sadece bir gösterge değil; eğilimleri yakalamak, ters yönleri analiz etmek ve benzersiz bir netlik ile kesin hamleler yapmak için nihai aracınızdır. Fibonacci dizilerinin güçlü uyumu ve gelişmiş hareketli ortalamalar serisi ile inşa edilen bu gösterge, hem hassasiyet hem de esneklik isteyen traderlar için tasarlanmıştır. Sizi öne çıkaran Ana
Trend Risk Göstergesi PRT, fiyat hareketinin trend kısımlarını bulur ve tampondaki bir değerle trendin varlığını gösterir. D1 için önerilen, işlemlerin gerçekleştirildiği kanaldan fiyat çıkma olasılığı olduğunda ticareti devre dışı bırakmak için düz ticaret için kullanılabilir.
İki giriş parametresi vardır:
• Bant aralığı — bant hesaplama aralığı • Sapma — sapma değeri (izin verilen kanalın genişliği)
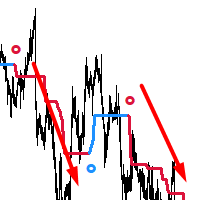
AdaptiveTrendHunter - Adaptif Trend Tespit Göstergesi
Temel Özellikler: Renk kodlaması ile kolay trend tespiti (yükselen trend için mavi, düşen trend için kırmızı) Oklarla işaretlenmiş net giriş sinyalleri Piyasa volatilitesine akıllı uyum Özelleştirilebilir trend doğrulama ayarları Yeni işlem sinyalleri için isteğe bağlı uyarılar Kullanım Kılavuzu: Trend Takibi: Potansiyel yükselen trendler için mavi çizgileri gözlemleyin Potansiyel düşen trendler için kırmızı çizgileri gözlemleyin Trend dönüşl

Smart Volume Box is designed to give MetaTrader users a powerful, analytical tool for uncovering the hidden dynamics in the market. This precision-built tool, complete with user-friendly settings, integrates essential volume insights and advanced features like Volume Profile, VWAP (Volume Weighted Average Price), and Point of Control (POC) levels. Unlike typical indicators, Smart Volume Box doesn’t provide specific trade signals but instead offers a clearer perspective on market trends, makin
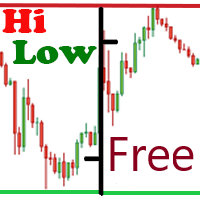
The free version of the Hi Low Last Day indicator . The Hi Low Levels Last Day indicator shows the high and low of the last trading day . The ability to change the color of the lines is available . Try the full version of the Hi Low Last Day indicator , in which additional indicator features are available : Displaying the minimum and maximum of the second last day Displaying the minimum and maximum of the previous week Sound alert when crossing max . and min . levels Selecting an arbitrary audio
FREE

Makuchaku Super Order Block
Introducing the "Makuchaku Super Order Block" – an all-in-one, powerhouse trading tool that combines the market’s most effective indicators in one, intuitive interface. This is more than just an indicator; it's a comprehensive market intelligence solution. Engineered for peak performance and precision, OBFVG is the best indicator of 2024 and a must-have for every serious trader. Let's dive into the key features of this indicator and how each can enhance your trading
GannTools Indicator
The GannTools Indicator is a powerful trading tool inspired by W.D. Gann's strategies. This indicator provides traders with dynamic support and resistance levels, trend analysis, and key price patterns using Gann angles and cycles. Key Features: Customizable Gann Fans, Angles, and Cycles for precise market analysis. Automatic identification of key price levels and trend directions. Works on all timeframes and instruments for flexible trading strategies. Integrated visualiza
The indicator shows the price change of the current or any other instrument since the beginning of the day / week . You can choose to display it in points or as a percentage relative to the opening price of the beginning of the period . The indicator is made in the form of a histogram with two colors , for ascending and descending price changes . You can also choose which tool to show the data for . The data will be displayed on the current chart .
FREE

Sliding Average with Bollinger Bands General Information: The indicator combines two popular technical analysis tools: Moving Averages (Simple Moving Average and Smoothed Moving Average) to assess the trend. Bollinger Bands to analyze market volatility. Main Components: SMA (Simple Moving Average): The simple moving average is calculated as the arithmetic mean of prices over a specified period. Formula: = (1 + 2 + ⋯ + ) / Where: 1, 2, …, are the closing prices for p

Copytrading en Tiempo Real – Comunidad Ola Trading Si ya probaste nuestras operaciones en modo demo , ahora podés dar el siguiente paso y comenzar a copiar operaciones en tiempo real junto a nuestra comunidad. En esta sección, tendrás acceso a señales reales de trading operadas por el equipo de Ola Trading , activo de lunes a domingo . Una vez que te suscribas, vas a poder copiar nuestras operaciones directamente en tu cuenta real . ¿Cómo comenzar? Suscribite en nuestra página a través de

Introducing the Fair Value Gap Indicator : A Simple and Effective Trading Tool The Fair Value Gap Indicator is designed to help traders easily identify and utilize Fair Value Gaps (FVGs) in their trading strategies. FVGs highlight price imbalances that the market often revisits, offering potential trade entry or exit opportunities. Whether you're a beginner or an experienced trader, this indicator simplifies the process of spotting these valuable zones, allowing you to trade with clarity and co
FREE

This indicate will set the global variable GlobalVariableSet(" G_News ",1); when there is news. You can add this indicator to any char, it is not necessary that the char has your EA
Just add this code to your EA ( file mq5) to identify when there is news
int news=0; if(GlobalVariableGet("G_News")==1) {news=1;}
This is the identification code when there is news, how to handle it is up to you You can customize the pause time, customize the country you want to get news from...
FREE
The Percentage Average True Range (ATR) indicator measures market volatility by calculating the ATR of a selected asset and expressing it in one of three customizable formats: Percentage (%) relative to the current price, enabling easy comparison across assets with different price ranges. Basis Points (bps), where 1 bps equals 0.01%. Real ATR values, representing the raw ATR in price terms. By normalizing ATR values using percentage or basis points, this indicator allows for direct comparison of
FREE

Fibo Daily Channel Indicator The Indicator is a powerful tool for traders, providing precise daily support and resistance levels based on Fibonacci retracement and extension calculations. This indicator automatically draws key pivot points (PP, R1, R2, S1, S2) as well as additional extension levels (R3, R4, S3, S4), helping traders identify potential reversal and breakout zones with ease. It includes customizable alerts and push notifications, allowing traders to receive updates whenever the pr
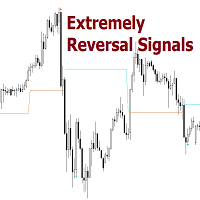
Reversal Signals [AlgoAlpha] – Master Market Reversals with Precision!
Elevate your trading strategy with the Reversal Signals indicator by AlgoAlpha. This advanced tool is designed to pinpoint potential bullish and bearish reversals by analyzing price action and, optionally, volume confirmations. It seamlessly combines reversal detection with trend analysis, giving you a comprehensive view of market dynamics to make informed trading decisions.
Key Features
Price Action Reve
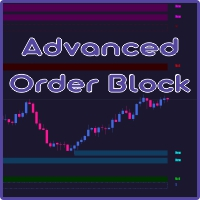
A2 Trade proudly present to you, Advanced and FULLY CUSTOMIZABLE Order Block to assist the traders for find the Supply and Demand or Support and Resistance Levels. The traders could customize of each areas to make it different from another areas, and the traders also can set the Supply and Demand or Support and Resistance timeframes themselves. hope you'll enjoy it.
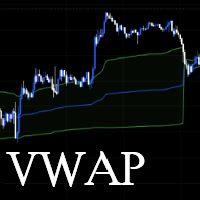
Introducing the Game-Changing SVWAP v2 Expert Advisor! The SVWAP v2 Expert Advisor is not just another tool in your trading arsenal – it’s a revolution in market analysis. Built with precision and cutting-edge technology, this dynamic EA combines the immense power of the Volume Weighted Average Price (VWAP) indicator with intelligently calibrated deviation bands to deliver unparalleled market insights . Designed for traders who demand excellence , SVWAP v2 is the ultimate indicator for dominatin

This is the MT5 Ichimoku Dashboard. This dashboard will scan multiple timeframes in MT5 platform, from M1 chart to D1 chart. It will send the buy/sell signals by alert on the platform or sending notification to your phone or message you via a email.
The buy/sell signal can be set by cross of multiple lines: ex: tenkan-sen line, kijun-sen line, the cloud or you can select the price to cross or above/below the kumo cloud... Please discovery in the input setting, You can find the rule that you are

Free for now, price is going to be 30 USD at Jan 1. 2025.
Features: Pin Bar Detection : The indicator is designed to identify bullish and bearish pin bars based on specific criteria, including the relative size of the candle’s body and shadow, as well as the position of the candle's body in relation to the 38.2% Fibonacci level. Customizable Labels : Custom text is displayed above each identified bullish or bearish pin bar, such as "[38.2]" for bullish and "[-38.2]" for bearish, helping traders
FREE
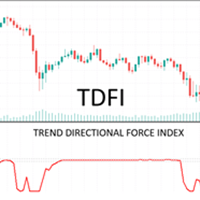
Trade Directional Force Index (TDFI) v1.0 One of the greatest challenges for trend traders lies in effectively timing entries and exits during periods of consolidation. These phases are often characterized by lower-than-average trading volume, making them tricky to navigate. In markets where volume data is unavailable, such as forex, the Trend Direction and Force Index (TDFI) serves as a reliable substitute. This is because volatility and volume are closely intertwined. What if you had an indica

The Optimized MACD Divergence indicator is a powerful tool designed to identify potential trading opportunities by detecting divergences between price action and the MACD indicator. It combines classic divergence analysis with candlestick pattern recognition and volume filtering to provide more accurate and reliable signals. How it Works The indicator operates on the following principles: MACD Calculation: It calculates the MACD indicator using user-defined parameters for fast EMA, slow EMA,
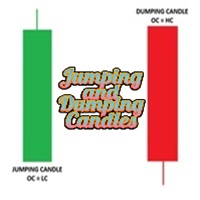
Jumping and Dumping Candles Detector Also known as Pumping and Dumping Candles Detector. Multi - timeframe. Scans historical candles. For MT5 program. With this amazing indicator, adopt your own strategy. Note: Share your strategy with us and we automate it.
Check out my 98% win rate signal : https://www.mql5.com/en/signals/2278767?source=Site +Profile (Expired)

Berma Bantları (BB'ler) göstergesi, piyasa trendlerini belirlemeyi ve bunlardan yararlanmayı amaçlayan yatırımcılar için değerli bir araçtır. Fiyat ile BB'ler arasındaki ilişkiyi analiz ederek, yatırımcılar bir piyasanın trend veya aralıklı fazda olup olmadığını ayırt edebilir. Daha fazla bilgi edinmek için [ Berma Home Blog ] adresini ziyaret edin. Berma Bantları üç belirgin çizgiden oluşur: Üst Berma Bandı, Orta Berma Bandı ve Alt Berma Bandı. Bu çizgiler fiyatın etrafına çizilir ve genel tren

The Market Sessions indicator is a popular tool among forex and stock traders for visually representing global trading sessions on a price chart. It highlights the time periods for major trading sessions — such as the Asian (Tokyo) , European (London) , and American (New York) sessions — directly on the chart. This helps traders identify when markets open and close, allowing for better decision-making based on session-specific trading behavior. - Asian Session (Default: 00:00-09:00) - London Se
FREE

ProEngulfing'in ücretsiz versiyonu, QualifiedEngulfing, günde bir sinyal sınırlaması ve daha az özellik sunmaktadır. Koala Trading Solution kanalına MQL5 topluluğunda katılmak için, tüm Koala ürünleri hakkında en son haberleri öğrenmek için aşağıdaki bağlantıyı kullanın:
https ://www .mql5 .com /en /channels /koalatradingsolution Bu ürünün MT4 versiyonu aşağıdaki bağlantıdan indirilebilir:
https ://www .mql5 .com /en /market /product /52023 ProEngulfing Tanıtımı – MT4 için Profesyonel Engulfing
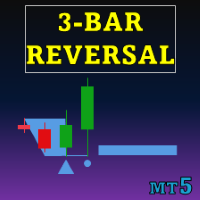
Special offer : ALL TOOLS , just $35 each! New tools will be $30 for the first week or the first 3 purchases ! Trading Tools Channel on MQL5 : Join my MQL5 channel to update the latest news from me Üç Çubuklu Tersine Dönüş Deseni Göstergesi , üç çubuklu tersine dönüş modellerini otomatik olarak tanımlayıp fiyat grafiğinde vurgulayan güçlü bir araç sunar. Bu gösterge, potansiyel trend tersine dönüşlerini tespit etmek için değerli bir kaynaktır ve kullanıcıların entegre edilmiş trend
Special offer : ALL TOOLS , just $35 each! New tools will be $30 for the first week or the first 3 purchases ! Trading Tools Channel on MQL5 : Join my MQL5 channel to update the latest news from me Liquidity Pools göstergesi, potansiyel likidite bölgelerini yüksek ve düşük seviyelerdeki sık fitil temasları, tekrar ziyaret sayısı ve her bölgedeki işlem hacmini analiz ederek grafik üzerinde belirleyen ve işaretleyen gelişmiş bir araçtır. Bu araç, yatırımcılara likiditenin biriktiği p
Special offer : ALL TOOLS , just $35 each! New tools will be $30 for the first week or the first 3 purchases ! Trading Tools Channel on MQL5 : Join my MQL5 channel to update the latest news from me Gelişmiş makine öğreniminin gücünü, değişen piyasa koşullarına sorunsuz bir şekilde uyum sağlamak için tasarlanmış olan Machine Learning Adaptive SuperTrend göstergesiyle keşfedin. Bu gösterge, k-ortalama kümeleme ile SuperTrend metodolojisini entegre ederek, kesin trend belirleme ve vol
TW Volume Signal Pro MT5 , gelişmiş yapay zeka teknolojileri ve özel akıllı algoritmalar kullanarak altın piyasasında daha güvenli işlem yapmanıza olanak tanır ve size benzersiz ve eşi benzeri olmayan bir işlem deneyimi sunar.
Altın piyasasında yüksek doğrulukta ve olağanüstü işlem sinyalleri mi arıyorsunuz? TW Volume Signal Pro MT5 ile profesyonel bir yatırımcı olabilir ve altın piyasasında büyük başarı elde edebilirsiniz. Öyleyse, ücretsiz deneyin!
TW Volume Signal Pro MT5'in Temel Özellikl
Special offer : ALL TOOLS , just $35 each! New tools will be $30 for the first week or the first 3 purchases ! Trading Tools Channel on MQL5 : Join my MQL5 channel to update the latest news from me Trend Levels göstergesi, piyasa hareketleri sırasında kritik trend seviyelerini — Yüksek, Orta ve Düşük — belirlemek için titizlikle tasarlanmıştır. Özelleştirilebilir bir bakış periyodu boyunca en yüksek, en düşük ve orta değerlerine dayalı gerçek zamanlı hesaplamalarla, bu araç yatırım

Nro Lines göstergesi, çizgi çizimi yoluyla, temel fiyat seviyelerinin hassas ve dinamik bir görselleştirmesini sunar. Bu işlevsellik, tüccarların optimize edilmiş teknik analiz gerçekleştirmesine olanak tanır, bu da etkili ticaret stratejileri geliştirmek ve piyasaya giriş ve çıkış konusunda kararlı kararlar almak için esastır. Ana özellikler: - Piyasa değişikliklerine göre ayarlanan dinamik referans çizgileri, tüccar için güncellenmiş ve ilgili görsel bir temsil sunar. - İlgili seviyelerin ot

Göstergenin Hakkında Bu gösterge, bir finansal aracın kapanış fiyatları üzerinde yapılan Monte Carlo simülasyonlarına dayanmaktadır. Tanım olarak, Monte Carlo, daha önce gözlemlenen sonuçlara dayalı rastgele sayılar kullanarak bir süreçteki farklı sonuçların olasılıklarını modellemek için kullanılan bir istatistiksel tekniktir.
Nasıl Çalışır? Bu gösterge, tarihsel verilere dayanarak zaman içinde rastgele fiyat değişikliklerini modelleyerek bir menkul kıymet için birden fazla fiyat senaryosu olu

The indicator colors the candles relative to their volume delta. The calculation of the candles delta is based on the tick history or on the deals tape history (see below for a description of the input variable "Volumes").
Coloring is performed by two parameters : by delta sign, as candle color, by delta value, as candle color contrast against chart window background color.
In addition to coloring the candles, the indicator also displays the delta profile on the interval specified by the user
ADX-Based Candle Color Indicator for MT5
Description: Enhance your trading experience with the ADX-Based Candle Color Indicator for MT5! This powerful tool colors candlesticks based on the Average Directional Index (ADX) indicator, helping you quickly assess market strength and direction at a glance.
Key Features: - Color-Coded Candles: - Green (Bullish) when D+ > D-. - Red (Bearish) when D- > D+. - Intensity Mapping: The color intensity reflects the ADX value—stronger col

G-Labs Market Maker Dashboard MT5 | BT MM Scanner with Peak Formation, AD R Cycles and Asian Range Real -time multi-currency Market Maker scanner for MetaTrader 5. Tracks BTMM peak formations, Asian session ranges, ADR cycle progression, stop hunt activity, cycle projections, and RSI entry timing across 28+ pairs from a single dashboard. The entry-level BTMM dashboard for traders learning and applying the Banks Track Market Maker method . Provides all the core cycle data yo

Hurst Cycles Diamonds Description This indicator is an alternative version inspired by the pioneering work of David Hickson and the Hurst Cycles Notes indicator developed by Grafton. The main objective is to provide a clear and intuitive view of the Hurst cycles. Credits Original Concept : David Hickson - Hurst Cycles Theory Inspiration : Grafton - Hurst Diamond Notation Pivots Alternative Version : Fillipe dos Santos Main Features Identifies and displays pivots in multiple time cycles Visual t

The First Dawn indicator uses a unique mechanism to search and plot signals.
This keeps searching for signals, making it a great indicator for scaping and identification of changes in direction, swing trading and trend trading.
The First Dawn helps you get early signals. The backtest gives the true picture of how the indicator works with real/demo accounts.
Although this is a tiny indicator it is packed with advantageous settings that will help you whether you desire to: Snap the Peaks a
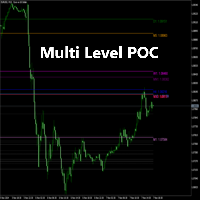
Detailed Description:
The Multi Level POC Indicator is designed for traders who want to identify critical price levels based on volume analysis across multiple timeframes. Key Features:
Multi-Timeframe POC Calculation: Automatically calculates and displays the POC from multiple timeframes, including M1, M5, H1, D1, and more. Intermediate Levels Display: In addition to the primary POC levels, the indicator also plots intermediate levels based on the POC. Custom Precision and Depth Settings: Us
FREE

All-In-One Supertrend Indicator for MT5 A comprehensive multi-source trend-following system that combines 20 different data sources with customizable Supertrend calculations to deliver robust trend analysis and trading signals. ======================================================================================== Key Features Multi-Source Architecture 20 diverse data sources working in perfect harmony Fully customizable parameters for each individual source Non-repainting signals with lightnin
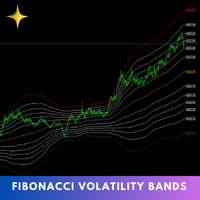
The Fibonacci Volatility Bands indicator is a refined tool designed to enhance your market analysis by integrating Fibonacci retracements with the Bollinger Bands concept. This indicator visually highlights potential areas of support and resistance, providing traders with a clearer understanding of price fluctuations and volatility. MT4 Version - https://www.mql5.com/en/market/product/126421/ The core of the Fibonacci Volatility Bands is built around a Volume Weighted Moving Average (VWMA) that
FREE
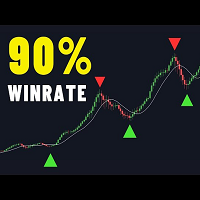
There are many linear regression indicators out there, most of them draw lines or channels, but this one actually draws a chart. This indicator also alow user show MA line on chart. So buy signal is when red candle and crossdown with MA line and vice versal. Following MA type is supported: SMA EMA RMA WMA This simple mineset but powerfull KISS - Keep it simple, stupid :D

This indicator identifies and visually displays Support and Resistance zones on a financial chart, providing traders with critical insights into market structure and potential price action areas. Here's how it operates: Key Features: Zone Identification: Detects Support Zones (price levels where buying pressure is historically strong). Detects Resistance Zones (price levels where selling pressure is historically strong). Categorizes zones into: Weak Zones Untested Zones Turncoat Zones (previousl
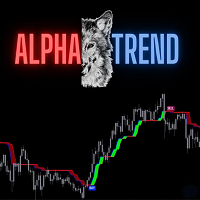
AlphaTrend is a brand new indicator which inspired by Trend Magic. In Magic Trend we had some problems, Alpha Trend tries to solve those problems such as:
1-To minimize stop losses and overcome sideways market conditions.
2-To have more accurate BUY/SELL signals during trending market conditions.
3- To have significant support and resistance levels.
4- To bring together indicators from different categories that are compatible with each other and make a meaningful combination regarding momen
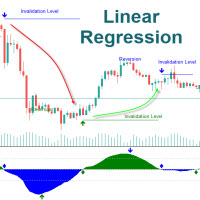
The Linear Regression Oscillator (LRO) is a technical indicator based on linear regression analysis, commonly used in financial markets to assess the momentum and direction of price trends. It measures the distance between the current price and the value predicted by a linear regression line, which is essentially the best-fit line over a specified period. Here’s a breakdown of how it works and its components: Key Components of the Linear Regression Oscillator Linear Regression Line (Best-Fit Lin
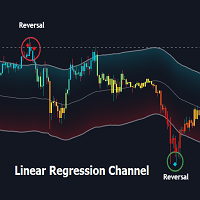
Overview:
The Linear Regression Channel Indicator is a versatile tool designed for Metatrader to help traders visualize price trends and potential reversal points. By calculating and plotting linear regression channels, bands, and future projections, this indicator provides comprehensive insights into market dynamics. It can highlight overbought and oversold conditions, identify trend direction, and offer visual cues for future price movements.
Key Features:
Linear Regression Bands: ( figur

Description :
The "MVRV by Age Approximation" indicator offers traders a unique on-chart visualization of the Market Value to Realized Value (MVRV) ratio, segmented by holding periods, or "age cohorts." This indicator is designed to approximate the MVRV metric by categorizing assets into short-term, mid-term, and long-term holders, providing a clear view of the relative unrealized profit or loss across different holding periods. Using simple moving averages over adjustable periods, this indicato

Here I bring you the Binary Boss OT1.0 MT5 indicator that provides signals for trading the rise or fall, higher or lower, call or put and more different options on the binary brokers.
This arrow indicator uses the technical trading rules, the candle patterns .The arrow appears at the opening of the candle for quick entries and the indicator provides multiple signals a day for more chances.
Instructions: On Deriv or Iqoptions, set time duration between 40 sec and 5 minutes.(According to your

Advanced Volume Flow Indicator A professional volume analysis tool that helps traders identify potential market reversals and trend confirmations through advanced volume flow calculations and smart filtering algorithms. Main Features Advanced volume analysis with precision filtering Real-time trade signals with price levels Smart alert system for automated trade detection Clear visual representation with color-coded volume bars Multi-timeframe optimization Professional-grade calculat
FREE

GTrendDetector Индикатор GTrendDetector предоставляет сигналы на покупку и продажу. Индикатор рассчитывает границы канала по рекурсивному методу, а также среднее, полученное из этих границ. Выход цены закрытия за границы канала генерирует сигналы на покупку/продажу. Индикатор рисуте границы канала, окрашивает область между средней и ценой закрытия, и выводит на график значки в местах смены тенденции. Входные параметры: Source - тип цены для расчета границ канала. Length - количество баров для ра
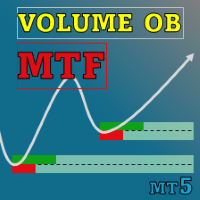
Special offer : ALL TOOLS , just $35 each! New tools will be $30 for the first week or the first 3 purchases ! Trading Tools Channel on MQL5 : Join my MQL5 channel to update the latest news from me Volumetrik Sipariş Blokları Çoklu Zaman Çerçevesi göstergesi, önemli piyasa katılımcılarının siparişleri biriktirdiği kilit fiyat bölgelerini belirleyerek piyasa davranışına daha derin bir içgörü arayan tüccarlar için tasarlanmış güçlü bir araçtır. Bu bölgeler, Volumetrik Sipariş Bloklar

Merhaba arkadaşlar ben Rangers Fx Boom 1000 Endeksi, Boom 500 Endeksi ve Boom 300 Endeksi'nde ani yükselişleri yakalamak için bir gösterge oluşturmayı başardık, bu gösterge sözcüklerini mevcut tüm Boom'lar ve gelecekte gelecek olan diğer Boom'lar için de geçerli kıldık. Bu Gösterge nasıl kullanılır? Öncelikle zaman diliminizi M1/M5 zaman dilimine çevirmelisiniz, bu gösterge size Alım işlemlerinizi ne zaman yapacağınız ve işlemlerinizden ne zaman çıkacağınız/kapatacağınız (X) konusunda bir uyarı

Merhaba arkadaşlar ben The Rangers Fx Crash 1000 Index, Crash 500 Index ve Crash 300 Index'te ani yükselişleri yakalamak için bir gösterge oluşturmayı başardık, bu gösterge kelimeleri mevcut tüm Crash'ler ve gelecekte gelecek olan diğer Crash'ler için de geçerlidir. Bu Gösterge nasıl kullanılır Öncelikle zaman diliminizi M1/M5 zaman dilimine çevirmelisiniz, bu gösterge size Satış işlemlerinizi ne zaman yapacağınız ve işlemlerinizden ne zaman çıkacağınız/kapatacağınız (X) konusunda bir uyarı gönd
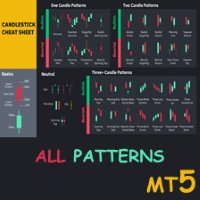
Special offer : ALL TOOLS , just $35 each! New tools will be $30 for the first week or the first 3 purchases ! Trading Tools Channel on MQL5 : Join my MQL5 channel to update the latest news from me Mum çubuğu formasyonlarını öğrenmek, piyasada bilinçli kararlar almak isteyen her tüccar için önemlidir. İşte All Candlestick Patterns – teknik analizlerinizi geliştirmek ve piyasa eğilimleri ve olası ters dönüşler hakkında güçlü bilgiler sağlamak için tasarlanmış kapsamlı bir araç. Bu h
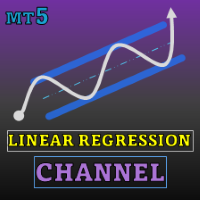
Special offer : ALL TOOLS , just $35 each! New tools will be $30 for the first week or the first 3 purchases ! Trading Tools Channel on MQL5 : Join my MQL5 channel to update the latest news from me Doğrusal Regresyon Kanal Göstergesi , yatırımcılara fiyat trendlerini ve potansiyel dönüş noktalarını yakalamada yardımcı olan güçlü bir teknik analiz aracıdır. Doğrusal regresyon kanalları, bantlar ve gelecek projeksiyonlarını hesaplayıp göstererek, bu gösterge piyasa dinamikleri hakkın

Belirtilen zaman dilimindeki Yüksek ve Düşük fiyatlara dayanarak otomatik olarak Fibo seviyelerini çizer Çoklu çubuklar birleştirilebilir: örneğin, 10 günlük Yüksek ve Düşük fiyatlara dayalı bir Fibo elde edebilirsiniz Benim #1 Aracım : 66+ özellik, bu gösterge dahil | Sorularınız için iletişime geçin | MT4 sürümü Potansiyel dönüş seviyelerini görmeye yardımcı olur; Fibo seviyelerinde oluşan formasyonlar genellikle daha güçlüdür; Manuel çizim için harcanan zamanı önemli
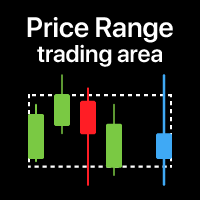
Fiyat bölgesi: seçilen zaman dilimi için işlem aralığının görselleştirilmesi Özellikle düşük zaman dilimlerinde işlem yaparken kullanışlıdır , böylece daha yüksek bir ZD'den aralığı görebilirsiniz . Benim #1 Aracım : Bu gösterge dahil 66+ özellik | Sorularınız için iletişime geçin | MT4 versiyonu Ne zaman kullanışlı olabilir: Çoklu zaman dilimleri kullanırken Farklı bir dönemin genel görünümünü görmek için Seçilen dönemin tüm aralığını görmek için Ayarlar: Bölge rengi Bölge dolgusu:

ICT Liquidity Levels , kurumsal seviyelerle hassas ticaret odaklı traderlar için tasarlanmış gelişmiş bir göstergedir. Bu gösterge, günlük ve seans bazlı temel fiyat seviyelerini gösterir ve netlik için ICT Silver Bullet stratejisiyle uyumlu yapısal bir görünüm sunar. Özellikler: Kapsamlı Kilit Seviyeler: Gösterge, stratejik ticareti desteklemek için temel fiyat seviyelerini işaretler, şunları içerir: Günlük Yüksek ve Düşük (Mevcut ve Önceki Gün) Londra Oturumu Yüksek ve Düşük (Mevcut ve Önce

Supertrend Göstergesi, yükseliş ve düşüş trendlerini belirlemede netlik arayan yatırımcılar için tasarlanmış güçlü bir trend takip aracıdır. MQL5 için geliştirilmiştir ve gerçek zamanlı analiz sağlar, giriş ve çıkış noktalarını vurgulayarak kullanıcıların bilinçli ticaret kararları almasına yardımcı olur. Özelleştirilebilir ayarları sayesinde, bu gösterge farklı piyasa koşullarına uyum sağlar ve ticaret stratejilerinde esneklik ve doğruluk sunar.

Daily VWAP Indicator (Volume Weighted Average Price) Special Deal! Leave a review and get the indicator Long & Short Cointegration Analyzer for free — just send me a message!
Description The Daily VWAP (Volume Weighted Average Price) indicator is an essential tool for traders seeking to identify the true average price of an asset throughout the day, adjusted by traded volume. Primarily used by institutional and professional traders, the daily VWAP serves as a reference point to identify the av
FREE

Overview The Smart Money Structure Markup Indicator for MetaTrader 5 is a powerful tool designed to help traders identify key market structures based on popular Smart Money Concepts (SMC) strategies. This indicator detects micro-market structures, providing insights into price movements and potential trend changes. It highlights important elements such as valid Break of Structure (BOS), Change of Character (CHoCH), and Inducement (IDM), helping traders to make informed decisions. Key Features Ma
FREE

Ratio Indicator - User Guide
Special Deal! Leave a review and get the indicator Long & Short Cointegration Analyzer for free — just send me a message!
This Ratio indicator between assets allows you to monitor and trade the price relationship between two assets selected by the user. It calculates the ratio between the prices of two assets, referred to as Asset1 and Asset2 (e.g., "GBPUSD" and "EURUSD"), and plots a moving average of the ratio along with Bollinger Bands . These bands are used to
FREE

Please Good Review on this indicator, and i will maybe produce more indicators, Coming soon, EA base on this indicators
Linear Weighted Moving Average with HLCC applied price, and Bollinger bands with LWMA as applied price. Interesing Buy and Sell arrow based on this indicator , non Lag indicator as arrow will appear 1 candle after crossed...............
FREE

This indicator is based on Bollinger Bands and moving averages, and uses ADX to get the turning point of the market trend and display a sign.
It is basically intended for use with currency pairs and futures with high volatility. In our tests we use it on XAUUSD, 5m and 15m. Win rate is more than 80% with 50 pips stop loss and 50 pips gain or more.
The indicator is also a simple indicator that allows you to enable or disable alerts and change the color of the arrows from the indicator settings
FREE
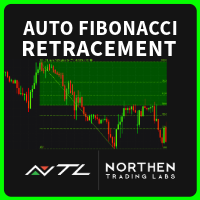
AutoFib: Advanced Fibonacci Retracement for MetaTrader 5 Automate Fibonacci Analysis for Smarter Trading Decisions AutoFib simplifies Fibonacci retracement analysis by automatically identifying key levels of support and resistance directly on your MT5 charts. Whether you're new to Fibonacci analysis or an advanced trader, AutoFib enhances your ability to identify potential reversals, continuations, and critical price levels. Key Features: Automatic Fibonacci Levels – Identify retracement and ext

This is an advanced trend indicator designed to accurately identify reversals and the beginning of trend movements. With this tool, you will be able to receive high-quality signals for entering and exiting the market, minimizing false entry points and increasing the profitability of transactions. The indicator is suitable for any assets (currency pairs, stocks, indices) and time intervals, from minute to daily charts.
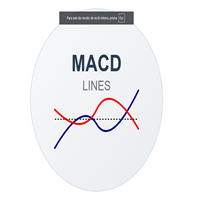
MACD Lines - Indicador MACD com Visualização em Linhas Descrição Este é um indicador MACD (Moving Average Convergence Divergence) modificado que apresenta uma visualização mais limpa e elegante em comparação com o MACD padrão do MT5. A principal diferença é que ele remove o histograma tradicional e mantém apenas as linhas MACD e Signal, permitindo uma melhor visualização dos cruzamentos e tendências. Características Principais Linha MACD em azul escuro com espessura 2 Linha Signal em vermelho co
FREE

TrendFusionXplorer consists of three powerful trend-analyzing indicators — TRP , PMax and OTT — developed by Kivanc Ozbilgic. Each indicator displays the trend's support and resistance levels based on its unique properties and methodology. TrendFusionXplorer assists in determining entry and exit points for markets and can also be used for setting trailing stop-loss (SL) and take-profit (TP) levels on open positions.
Specifications
1. Trend Reversal Predictor (TRP): TRP follows Thomas R. DeMar

PLEASE NOTE THIS IS PROACTIVE PRODUCT, NOT A DONE FOR YOU SET AND FORGET. YOU MUST KNOW ABOUT OTPIMIZATION AND WANT TO BUILD YOUR OWN EA . Prop Trading Code is one of a kind product that lets you build your own prop trading EA to attempt to pass a challenge taking it buy each day. This is a generator that has all the conditions to generate a code that you can then use to build your own prop trading EA in your strategy tester. This empowers the trader to generate, define, build, alter and use
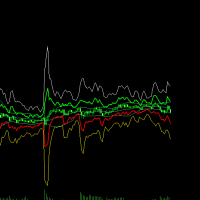
Here's a clearer, more organized description for the indicator: An enhanced ATR Bands indicator that provides flexible, configurable price bands based on Average True Range (ATR). While traditional ATR-based indicators often have limitations in their configurability and functionality, this version offers comprehensive features for both stop-loss and take-profit level calculations. Key Features: Configurable source price (close, high, low) for ATR band calculations Adjustable scaling factors wit
FREE

Hey there! If you are using Moving Average indicator into RSI indicator's window and always wondering if there could be a way to get alerts on your smartphone when those two indicators get a crossover that would be great, right!? Then you have found the right tool for that. This indicator is nothing but a mix of MA indicator and RSI indicator into one indicator window as well as it will give you alerts for crossovers on your smartphone app, email and also on your trading terminal's (desktop) cha
MetaTrader mağazası - yatırımcılar için alım-satım robotları ve teknik göstergeler doğrudan işlem terminalinde mevcuttur.
MQL5.community ödeme sistemi, MetaTrader hizmetlerindeki işlemler için MQL5.com sitesinin tüm kayıtlı kullanıcıları tarafından kullanılabilir. WebMoney, PayPal veya banka kartı kullanarak para yatırabilir ve çekebilirsiniz.
Alım-satım fırsatlarını kaçırıyorsunuz:
- Ücretsiz alım-satım uygulamaları
- İşlem kopyalama için 8.000'den fazla sinyal
- Finansal piyasaları keşfetmek için ekonomik haberler
Kayıt
Giriş yap
Gizlilik ve Veri Koruma Politikasını ve MQL5.com Kullanım Şartlarını kabul edersiniz
Hesabınız yoksa, lütfen kaydolun
MQL5.com web sitesine giriş yapmak için çerezlerin kullanımına izin vermelisiniz.
Lütfen tarayıcınızda gerekli ayarı etkinleştirin, aksi takdirde giriş yapamazsınız.