Nuevos indicadores técnicos para MetaTrader 5 - 69

Открытый интерес (количество открытых позиций) – это количество активных контрактов по фьючерсу. Обычно анализируют не сам открытый интерес, а его изменение. Часто используется трейдерами в дополнение к объему для более полного понимания рыночной ситуации. MetaTrader транслирует открытый интерес со срочного рынка, но не сохраняет его в истории. Поэтому пока единственный вариант, на котором строится большинство подобных индикаторов – это сохранение истории в файл с его последующим воспроизведение

Indicador de líneas importantes (M1 - M15)
Este indicador muestra Líneas pivote, Día anterior alta y baja, Cierre día anterior y el mínimo y máximo de la hora anterior. Simplemente tiene que arrastrar ese único indicador al diagrama para tener todas esas líneas importantes. Puede evitar cargar muchos indicadores individuales.
¿Por qué ciertas líneas son tan importantes cuando se comercia?
El día a día, alto y bajo: estos son observados por los comerciantes que comercian en un gráfico dia
FREE

Introduction Excessive Momentum Indicator is the momentum indicator to measure the excessive momentum directly from raw price series. Hence, this is an extended price action and pattern trading. Excessive Momentum Indicator was originally developed by Young Ho Seo. This indicator demonstrates the concept of Equilibrium Fractal Wave and Practical Application at the same time. Excessive Momentum detects the market anomaly. Excessive momentum will give us a lot of clue about potential reversal and

RSI talking, use all your senses while trading!
The idea When trading your eyes might be very stressed. Therefore I programmed the RSItalking. Trade what you see and what you hear !
Function This indicator says "rsioverbought" when rsi is over a threshold value (default 75%) and "rsioversold" if it is under a lower threshold (default 25%). When you keep a long position be adviced to realize profit when the indicator tells you "rsioverbought" and vice versa. You will find an explanation of th
FREE

ALPS is a multi timeframes trend and momentum indicator that lets your profits run . It combines Gator Oscillator, ADX and RSI over multi timeframes in an innovative way. You can trade with full confidence on a rapid timeframe chart with insight and benefits of trend and momentum over a larger timeframe. To keep the chart clear and comprehensible, you can toggle any timeframe ON/OFF instantly at any time point. Different color trend bars mark slow, normal or strong trend based on ADX. Overbought
FREE

LevelPAttern MT5 is a technical indicator based on the daily levels and Price Action patterns. The indicator is based on the standard ZigZag indicator + reversal candlestick pattens, such as Star, Hammer (also knows as Pin bar), Engulfing and others. The indicator generates audio and text notifications when a pattern is formed and a level is touched. It also supports sending email and push notifications.
Indicator operation features It is suitable for working with any CFD and FOREX trading ins

Order Book, known also as Market Book, market depth, Level 2, - is a dynamically updated table with current volumes of orders to buy and to sell specific financial instument at price levels near Bid and Ask. MetaTrader 5 provides the means for receiving market book from your broker, but in real time only, without access to its history. The indicator OrderBook Cumulative Indicator accumulates market book data online and visualizes them on the chart. In addition, the indicator can show the market

The indicator displays the chart of an arbitrary combination of trading instruments, described by the entered arithmetic formula. Using the indicator. Add an indicator to any chart. Enter the formula as a string in the indicator's parameters. All symbols used in the formula must exactly match the names in the table "Market Overview" of the terminal. Example of the formula: (SIBN + SNGS) / 'RTS-3.19' + 2.5 * GAZP / LKOH Start the indicator The formula must meet the following requirements: The nam
FREE

What was IFM created for Our goal in creating IFM was to provide the tool to manage your Fibonacci Retrecements and other Fibo tools in MetaTrader 5. This indicator allows you to edit all of the settings without getting into it by right click on the tool. That is faster and easiest way to manage objects on your chart.
Inputs Font size - change font size of texts on the IFM panel. This is necessary, because some of users change font size in Windows settings Description of the Fibo levels (varia

The COSMOS4U AdTurtle is an indicator based on the now classic Turtle trading system. The various high and low Donchian lines around the price bars show you when to open or close your positions. These lines indicate levels which result in the opening or closing of a respective position when the price crosses through them. By default, the new position barriers are drawn as solid lines and the exit barriers are drawn as dashed lines. The new long position lines and the close short position lines a

Advanced Stochastic Scalper MT5 is a professional indicator based on the popular Stochastic Oscillator. Advanced Stochastic Scalper is an oscillator with dynamic overbought and oversold levels, while in the standard Stochastic Oscillator, these levels are static and do not change. This allows Advanced Stochastic Scalper to adapt to the ever-changing market. When a buy or a sell signal appears, an arrow is drawn on the chart and an alert is triggered allowing you to open a position in a timely ma

This indicator scans for you up to 15 trading instruments and up to 21 time frames for occurrences of the high probability reversal patterns: Double Tops/Bottoms with fake breakouts . What this indicator detects: This indicator detects a special form of Double Tops and Bottoms, so called Double Tops/Bottoms with fake breakouts . For double tops with fake breakouts the highest price of the right shoulder must be higher than the left shoulder. For double bottoms with fake breakouts the lowest pric

This indicator scans for you up to 15 trading instruments and up to 21 time frames for occurrences of the high probability reversal patterns: Double Tops/Bottoms with fake breakouts . What this indicator detects: This indicator detects a special form of Double Tops and Bottoms, so called Double Tops/Bottoms with fake breakouts . For double tops with fake breakouts the highest price of the right shoulder must be higher than the left shoulder. For double bottoms with fake breakouts the lowest pric
FREE

This indicator identifies short-term, medium-term and long-term highs and lows of the market according to the method described by Larry Williams in the book "Long-term secrets to short-term trading".
Brief description of the principle of identifying the market highs and lows A short-term high is a high of a bar with lower highs on either side of it, and, conversely, a short-term low of a bar is a low with higher lows on either side of it. Medium-term highs and lows are determined similarly: a
FREE
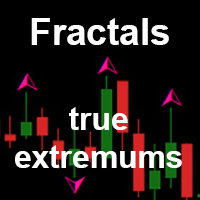
Fractals true extremums is a modification of the Fractals indicator. The indicator sorts out weak fractals leaving only the ones that are significant for searching the chart extreme points. The sorting is performed during fractals construction. The old data does not change. Only the last value can change (just like in the standard Fractals indicator). The indicator can show lines indicating Fractals from higher timeframes.
The product can be used by EAs for comparing price extreme points on cha
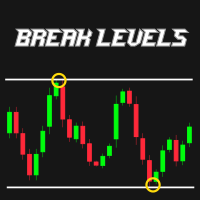
R747 BreakLevels is smart indicator that automatically detects Support and Resistance levels on actual market trend. Strength of levels can be easily adjusted by changing parameter LevelsStrength in range of 2 (weak levels) and 50 (strong levels). This indicator is accessible in EA via iCustom functions and is fully customizable by user. There is possibility to send Push notifications and Alerts of newly found levels.
Follow this link to get all detailed information: >> LINK <<
Features Adju

El Multi-Oscillator es la navaja suiza definitiva para el comercio de múltiples monedas y marcos temporales. Traza su oscilador deseado para muchos pares de divisas y / o marcos de tiempo en un solo gráfico. Se puede utilizar para negociar el arbitraje estadístico, como una herramienta de evaluación del mercado o como un indicador de marco de tiempo múltiple refinado. [ Guía de instalación | Guía de actualización | Solución de problemas | FAQ | Todos los productos ] Fácil interpretación y confi
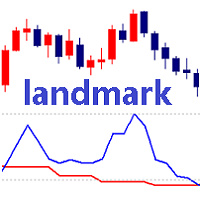
The AirShip indicator can help you to confirm the trend. The red dots mean uptrend, and the green dots mean downtrend. The AirShip indicator provides open and close positions signals when reaching overbought or oversold levels. It has a smart algorithm that detects the trend changes. If the trend reached the end of phase, the yellow dots will send you the notification. The AirShip indicator not only draw the red trend lines and the yellow trend lines using a multicriteria strength engine, but al

This indicator is designed to help traders find the market entry and exit points. The indicator generates signals in the form of arrows, which is a simple and intuitive for use in trading. In spite of apparent simplicity of the indicator, it has complicated analytic algorithms which determine entry and exit points. Its operation is based on moving averages, RSI, candlestick patterns, as well as certain original developments. Open a Buy position when an upward arrow appears, and a Sell position w
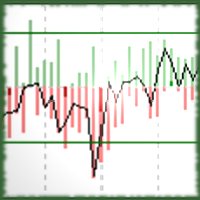
The Signal Noise Indicator is a non-parameterized oscillator generated by high, low and close noises.
Input Period: Reference period of the Low Pass Filter, used for the signal detection.
Values High Noise: maximum high noise; Power High Noise: high signal strength, showed when the smallest noise occurs in the same signal direction; Low Noise: maximum low noise; Power Low Noise: low signal strength, showed when the smallest noise occurs in the same signal direction; Close Noise: noise value

Fractals Direction ST Patterns MT5 is a modification of Bill Williams' Fractals indicator, which allows you to specify any number of bars for finding a fractal. In the settings, it is also possible to set the number of points for determining the trend direction. The upward direction is determined if the last upper fractal is higher than the penultimate upper fractal. The downward direction is determined if the last lower fractal is lower than the penultimate lower fractal. This simple indicator
FREE
The indicator is designed to calculate the correlation between major pairs and display cross-pair of overbought or oversold labels on the price chart.
The idea is that strong divergences of major pairs lead to an exit from the "equilibrium" of the corresponding cross pairs. With sufficiently large divergences, which are displayed by the indicator, the cross-pair is usually corrected by entering the "equilibrium". For example: when working on EURAUD pair, the difference for the period specified

El indicador VR ATR Pro es una potente herramienta profesional para determinar los niveles objetivos en un instrumento financiero. La eficacia del indicador ha sido comprobada por miles de pruebas en cuentas reales y de demostración. El indicador VR ATR Pro funciona con datos reales utilizando estadísticas reales vivas. La estadística es una cosa terca, el uso de datos estadísticos reales en los cálculos matemáticos permite calcular niveles objetivos precisos para un instrumento financiero. Para

I want to present to you my solution in the implementation of automatic drawing of Fibo levels on the whole trend and the last trend leg. The logic of the indicator is based on the principle of swings, and when indicator gets a signal for a trend direction change, the previous key point before reversing is considered the start point of the indicator's drawing. When you test the indicator, note that changing the direction of the whole trend leg of Fibonacci often leads to a reversal of the trend.

This indicator is based on Volumes standard indicator, calculates the average of Volumes based on the last N bars set by users, and if the value of the volume is bigger then a set % respect the average a different color will be used. The indicator is shown in a separate indicator window. This version has now a limitation in setting the % about the threshold.
If you are interested to set threshold consider to buy the PRO version ( https://www.mql5.com/en/market/product/35925 ) If you want to use
FREE

This indicator is designed to detect high probability reversal patterns: Double Tops/Bottoms with fake breakouts . Double top and bottom patterns are chart patterns that occur when the trading instrument moves in a similar pattern to the letter "W" (double bottom) or "M" (double top). The patterns usually occur at the end of a trend and are used to signal trend reversals very early. What this indicator detects: This indicator detects a special form of Double Tops and Bottoms, so called Double To

This indicator is designed to detect high probability reversal patterns: Double Tops/Bottoms with fake breakouts . This is the FREE version of the indicator: https://www.mql5.com/en/market/product/29957 The free version works only on EURUSD and GBPUSD! Double top and bottom patterns are chart patterns that occur when the trading instrument moves in a similar pattern to the letter "W" (double bottom) or "M" (double top). The patterns usually occur at the end of a trend and are used to signal tren
FREE

Do you need to check support and resistance lines? Do you need to find them really fast and automatically? Do you want to set your own settings how to find them? Then this indicator is your right choice! Indicator Lines is developed for finding support and resistance lines on chart. It does its job quickly and fully automatically. Main principle of algorithm is to get all extremes on chart (according to "Density" parameter). Then indicator tries to find minimally 3 points (according to "Minimal

With this system you can spot high-probability trades in direction of strong trends. You can profit from stop hunt moves initiated by the smart money!
Important Information How you can maximize the potential of the scanner, please read here: www.mql5.com/en/blogs/post/718109 Please read also the blog about the usage of the indicator: Professional Trading With Strong Momentum.
With this system you have 3 reliable edges on your side: A strong trend (=high probability of continuation) A deep pu
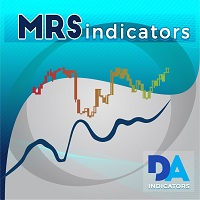
MRS Indicator : Moving Relative Strength. Indicator developed by me to use custom Moving Average and characteristics of Relative Strength in one line. If you have any questions about the indicator, your comments are welcome.
MRS features Works for all timeframes. 100% non-repaint indicator. Settings are changeable as a user needs. Recommend to use this product on smaller timeframes: M5, M15.
Parameters Period RSI - number of bars to calculate a RSI value. Recommended values 5-55 Price RSI :

This scanner shows the trend values of the well known indicator SuperTrend for up to 15 instruments and 21 time frames. You can get alerts via MT5, Email and Push-Notification as soon as the direction of the trend changes.
Important Information You have many possibilities to use the scanner. Here are two examples: With this scanner you can trade a top-down approach easily. If two higher time frames e.g. W1 and D1 are already showing green values (upward trend) but the H12 time frame shows a re

The True channel indicator plots the linear regression channel. The channel consists of two lines of support and resistance, as well as the averaging trend line.
Additional information in the indicator support and resistance price for the current bar channel width channel inclination position of the channel price relative to the channel in percent
Settings Bars for calculation - the number of bars to plot the channel Price for calculation - the price for plotting the channel boundaries (Clos

El indicador identifica cuando ocurre una divergencia entre el precio y un oscilador / indicador. Identifica divergencias tanto regulares como ocultas. Tiene una opción de filtro RSI que permite filtrar solo las configuraciones más fuertes. El indicador también ofrece opciones para esperar una ruptura del canal de Donchian o que el precio cruce una media móvil (ver captura de pantalla n. 3) para confirmar la divergencia antes de señalar la oportunidad comercial. Combinado con sus propi

Supporta is a trading indicator that automatically identifies support and resistance levels and their strengths from price movements and draws them on price charts. The instrument supports both the MetaTrader 4 and MetaTrader 5 terminals and can be used on any financial instrument and any timeframe. The MetaTrader 4 version is available on the market as Supporta MT4 . For full documentation and quick start, please refer to the official guidebook which is available for download in the comments se

The indicator shows the upper, middle and lower price limits for a certain period of time. Also, two Moving Averages (MAs) are displayed.
Parameters
CTType : corridor basis. _Hour : hours, _Day : days, _Bars : bars CTPrice : price type, by bars. OpenClose : Open/Close prices, HighLow : High/Low prices CTShift : corridor shift CTNum : how much to consider for building a corridor, min 2 CTPeriodFast : Fast period, min 2 CTShiftFast : Fast MA shift CTMethodFast : Fast averaging method CTPeriodSl

Este indicador / oscilador múltiple (en adelante indicador), marco de tiempo múltiple e indicador de símbolo múltiple identifica cuando ocurre una divergencia entre el precio y uno, dos o tres indicadores. Identifica divergencias tanto regulares / clásicas (inversión de tendencia) como ocultas (continuación de tendencia). Tiene opciones de filtro de tendencias RSI y MA que permiten filtrar solo las configuraciones más fuertes. Combinado con sus propias reglas y técnicas, este indicador le permit

This indicator calculates the volume profile and places labels that correspond to the VAH, VAL and POC levels, for each candle individually.
Indicator operation features The indicator works on the timeframes from M3 to MN, but it uses the history data of smaller periods: M1 - for periods from M3 to H1, M5 - for periods from H2 to H12, M30 - for the D1 period, H4 - for the W1 period, D1 - for the MN period. The color and location of the VAL, VAH and POC labels on the current candle are consider
FREE

Are You Tired Of Getting Hunted By Spikes And Whipsaws?
Don't become a victim of the market's erratic moves.. Do Something About It!
Instantly make smarter decisions with Impulse Pro's precise balance of filters and accurate statistics.
Timing Is Everything In Trading
To learn more, please visit www.mql5.com/en/blogs/post/718212 Anticipate the next big move before it unfolds in 3 Simple Steps!
Advantages You Get
Early impulse detection algorithm.
Flexible combination to different tr

This indicator shows ratios between extremes on the chart. You can specify your own ratios (e.g. Fibonacci).
Parameters Most important Density - how much in details to search ratios in extremes. Bigger number means less details, smaller number means more details. Base unit is 1 bar on the chart. History - how far to go in history while searching. When you set -1, the indicator processes all bars from history. Base unit is 1 bar on the chart. Range - how far search ratios from given extreme. Ba
FREE

The indicator shows the number and ratio of ticks with the price growth and fall for each candle of the chart. The upper part of the histogram in the form of thin lines shows the number of price growth ticks (bullish strength), while the lower part shows the amount of price fall ticks (bearish strength). The thicker histogram bars is the difference between the strength of bulls and bears. A positive difference is displayed in green, and the negative one is red. The strength of bulls increases wh
FREE
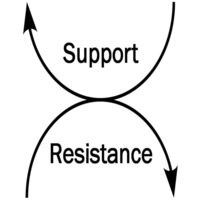
Support and Resistance is a concept that price will tend to stop and reverse at certain predetermined price levels denoted by multiple price touches without breaking those levels. This indicator plots those lines of resistance and support which helps identify points of possible reversal by confirming and marking previous and current price levels. Also, it warns when price approaches latest marked levels.
Input Parameters range - the price period back to check for confirmation. confirmations -

Market Profile helps the trader to identify the behavior if major market players and define zones of their interest. The key feature is the clear graphical display of the range of price action, in which 70% of the trades were performed. Understanding of the location of volume accumulation areas can help traders increase the probability of success. The tool can be used as an independent system as well as in combination with other indicators and trading systems. this indicator is designed to suit

Market Waves marks reversal price points on a chart following the modified Larry Williams method. The price is preliminarily smoothed using Heikin Ashi method. Open positions in the indicator signal direction. Note the patterns formed by reversal point groups. I recommend reading Larry Williams' "Long-Term Secrets to Short-Term Trading" before using the indciator.

This creates a mean-reversion chart using a moving average as a reference, detaching ourselves from the changing value of fiat currencies. [ Installation Guide | Update Guide | Troubleshooting | FAQ | All Products ] Get a mean-based view of the market Find real overbought/oversold situations easily Isolate your perception from the changing value of fiat currencies The center line represents the moving average Your imagination is the limit with this indicator Customizable chart period and Bolling
FREE

You can avoid constant monitoring of computer screen waiting for the DeMarker signal while receiving push notifications to a mobile terminal or a sound alert on the screen about all required events, by using this indicator - DeMarker Alerts. In fact, it is the replacement of the standard indicator with which you will never miss the oscillator signals. If you don't know the benefits of DeMarker or how to use it, please read here . If you need signals of a more popular RSI indicator, use RSI Alert

If you use the MFI (Money Flow Index) indicator, the waiting time till the next signal can be long enough. Now you can avoid sitting in front of the monitor by using MFI Alerts. This is an addition or a replacement to the standard MFI oscillator . Once there appears an MFI signal on the required level, the indicator will notify you with a sound or push, so you will never miss a signal. This is especially significant if you follow the indicator in different timeframes and currency pairs, which ca
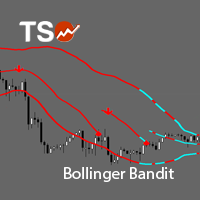
TSO Bollinger Bandit Strategy is an indicator based on the Bollinger Bandit Trading Strategy as presented in the book Building Winning Trading Systems with TradeStation by G. Pruitt and J. R. Hill. SCANNER is included . Now with Scanner you can find trading opportunities and setups easily and faster.
Features A complete entry and exit strategy for trending markets. Get email / push notifications when an entry signal occurs. The indicator is not repainting. Can easily be used in an EA. (see F

The Extremum catcher MT5 indicator analyzes the price action after breaking the local Highs and Lows and generates price reversal signals with the ability to plot the Price Channel. If you need the version for MetaTrader 4, see Extremum catcher . The indicator takes the High and Low of the price over the specified period - 24 bars by default (can be changed). Then, if on the previous candle, the price broke the High or Low level and the new candle opened higher than the extremums, then a signal
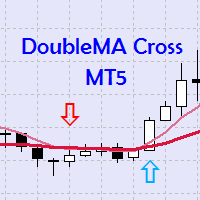
The "DoubleMA Cross MT5" is a typical strategy of investors, which usually indicates a change in trend from bearish to bullish. To establish a double crossing of moving averages, we need a slow moving average and a fast moving average. When the fast moving average crosses the upside to the slow average the bullish signal is triggered. The opposite strategy is also very useful. Everything works in the same way and we use the same indicators and periods: Fast moving average and slow moving average

Este indicador de marco de tiempo múltiple e indicador de símbolo múltiple busca barras de alfiler, estrellas matutinas / vespertinas, envolventes, pinzas, marcas de tres líneas, barras interiores y banderines y triángulos. El indicador también se puede utilizar en modo de gráfico único. Lea más sobre esta opción en el producto blog . Combinado con sus propias reglas y técnicas, este indicador le permitirá crear (o mejorar) su propio sistema poderoso. Características
Puede monitorear todo

Introduction to Harmonic Volatility Indicator Harmonic Volatility Indicator is the first technical analysis applying the Fibonacci analysis to the financial volatility. Harmonic volatility indicator is another level of price action trading tool, which combines robust Fibonacci ratios (0.618, 0.382, etc.) with volatility. Originally, Harmonic Volatility Indicator was developed to overcome the limitation and the weakness of Gann’s Angle, also known as Gann’s Fan. We have demonstrated that Harmonic

Este indicador de marco de tiempo múltiple y símbolo múltiple puede identificar las siguientes 5 cruces: cuando una media móvil rápida cruza una línea de media móvil lenta. cuando el precio ha alcanzado una única media móvil (cerrado por encima / por debajo o simplemente rebotando). cuando ha aparecido una formación de media móvil triple (las 3 MA: s en alineación consecutiva) cuando la línea principal del MACD cruza la línea de señal. cuando la línea de señal cruza la línea MACD cero (0). Combi

El indicador muestra los niveles alto/bajo/apertura/cierre de otros períodos de tiempo (y no estándar): año, 6 meses, 4 meses, 3 meses, 2 meses, mes, semana, día, horas H3-H6-H8-H12. . También puede configurar el turno para abrir velas y construir velas virtuales. Los "separadores de períodos" para uno de estos períodos de tiempo están disponibles en forma de líneas verticales. Las alertas se pueden configurar para rupturas de los niveles actuales o anteriores (ruptura de la línea Máxima/Mínima
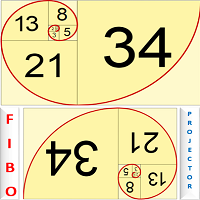
This indicator will automatically draw 4 Fibonacci levels on the chart. Dynamic Fibonacci will be drawn on the last of zigzag line. Static Fibonacci will be drawn on the 3 last of zigzag line. Fibonacci projection 1 and 2 will be drawn on the last zigzag line also. This way, you can see several Fibonacci level to get prediction of next support and resistance of market price. Indicator does not work if less than 500 bars are available.
Parameters Zig_Zag_Parameter Depth - Zig zag depth paramete

This is a demo version of the Candle Absorption Full indicator. It has limitations on operation. This indicator detects the Engulfing candlestick pattern and draws the corresponding market entry signal.
Features It works only with EURUSD on timeframes M1 and M5. The indicator analyzes a combination of 2 or 3 candlesticks depending on settings. The number of pre-calculated bars (signals) is configurable. The indicator can send an alert to notify of a found signal. Signal can be filtered by sett
FREE

ACB Trade Filter indicator provides a way to filtering out the low probability trading entries in a trading strategy. The indicator uses a sophisticated filtration algorithm based on the market sentiment and trend. The MT4 version of the same indicator is available here ACB Trade Filter MT4
Applications Works great with our indicator ACB Breakout Arrows MT5 Filter out low probability signals from any indicator. Avoid over-trading and minimize the losses. Trade in the direction of market sentim

Este indicador es un método de análisis de mercado basado en el artículo "Fórmula matemática para predicciones de mercado" escrito por W.D. Gann según los métodos del cuadrado de nueve y el cuadrado de 144.
Manual de usuario:
Add Your review And contact us to get it
Puede comprar la versión MT4 completa en:
https://www.mql5.com/en/market/product/15316
Puede probar en MT4 gratis:
https://www.mql5.com/en/market/product/15320?source=Site +Profile+Seller#!tab=reviews
Est

The Trail Stops Point indicator shows the deviation from the current price by a certain distance. It has been developed as an additional indicator for Trail Stops by Custom Indicator , to provide a simple trailing of a position stop loss at a specified distance in points.
Indicator Parameters Distance - trailing stop distance in points. Buffer numbers: 0 - Support, 1 - Resistance.
FREE

Easy Relative Smooth Index Easy Relative Smooth Index es un oscilador basado en el indicador de índice de fuerza (RSI). El valor actual de las lecturas del indicador se compara con los valores máximo y mínimo del indicador para el período especificado y se calcula el valor promedio. Las lecturas del indicador también se suavizan utilizando el método de media móvil (MA). Una señal de compra es el cruce de un nivel dado por el indicador de abajo hacia arriba, una señal de venta es un cruce de un

A personal implementation of a famous trend principle known as higher high, higher close, lower low, lower close (HHHC - HHHL). It uses price action alone to determine trend direction, trend changes and pullback zones. [ Installation Guide | Update Guide | Troubleshooting | FAQ | All Products ] Customizable breakout period Customizable colors and sizes It is non-repainting and non-backpainting It implements alerts of all kinds The indicator defines three price zones: Buy zones are blue Sell zon
FREE

Regent Street, rather than an expert or an indicator, is an all-in-one trading assistant easing your trading sessions by providing signals and notifications. It's an assistant rather than a robot - "an assisted steering rather than an autopilot", and now, it autoadjusts itself to any instrument, any timeframe & any circumstance. Note from the author: Regent Street's frontend is exactly the same as an other product Ermou Street , but the backend is different. Performances for each are very relati

This is a general purpose indicator that displays colored lines at fixed and customizable price intervals, entered as parameters. It offers universal, constant, and familiar price ranges that allow quick and precise price analysis of a currency pair. With default parameters, this indicator implements The Quarters Theory , as described originally by Ilian Yotov . [ Installation Guide | Update Guide | Troubleshooting | FAQ | All Products ] Easy to use No optimization needed Customizable price int
FREE

Slope Direction Side Slope Direction Side es un indicador de tendencia basado en promedios móviles. El indicador refleja tendencias en la dinámica de precios en los mercados. Hay tres tendencias principales en la dinámica de precios: movimiento ascendente, movimiento descendente y movimiento lateral de precios. El indicador ayuda a determinar la dirección predominante del movimiento de precios: tendencia, suavizando los datos de precios durante un cierto período de tiempo. En términos simples,

Difícil de encontrar y escasa en frecuencia, las divergencias son uno de los escenarios comerciales más confiables. Este indicador busca y escanea las divergencias regulares y ocultas automáticamente usando su oscilador favorito. [ Guía de instalación | Guía de actualización | Solución de problemas | FAQ | Todos los productos ]
Fácil de comerciar
Encuentra divergencias regulares y ocultas Admite muchos osciladores bien conocidos Implementa señales comerciales basadas en rupturas Muestra n

The Trade Helper indicator is a modification of the Trade Assistant indicator (by Andriy Moraru). The Trade Helper multitimeframe indicator is a good assistant for traders, useful as a filter in most trading strategies. This indicator combines the tactics of Elder's Triple Screen in a single chart, which lies in entering a trade when the same trend is present on three adjacent timeframes. The indicator operation is based on the principle of determining the trend on the three selected timeframes
El indicador "Gap on chart" le permitirá ver las brechas de precios en el gráfico. Los niveles de ruptura se extienden a lo largo del tiempo hasta que el precio cierra la brecha de precios. El indicador le permite ajustar la sensibilidad: qué Tamaño de brecha en los puntos Mostrar y qué profundidad de la historia analizar.
Para su uso en el comercio automático, se utiliza la numeración de las brechas de precios según el método LIFO, es decir, la Última brecha de precios formada tiene el númer

Professional Histogram MT5 ( PH ) is a highly efficient and reliable tool for determining the direction and strength of the trend. PH is easy to use and configure both for beginners and experienced traders. Unlike most indicators, Professional Histogram finds longer trends and gives fewer false signals. When a buy or a sell signal appears, an alert is triggered allowing you to open a position in a timely manner and avoid sitting at your PC all the time. Professional Histogram for the MetaTrad

The CAP Channel Trading is a volatility-based indicator that makes use of the “advanced envelope theory”. These envelopes consist of two outer lines. Envelope theory states that the market price will generally fall between the boundaries of the envelope (or channel). If prices move outside the envelope, it is a trading signal or trading opportunity.
Benefits of the Channel Trading Indicator CAP Channel Trading works with any asset
It can be applied to any financial assets: forex, cryptoc
FREE

EFW Pattern Trader is a powerful pattern scanner for Forex and Stock trading. The pattern detection in EFW Pattern Trader uses the Fractal Wave Theory, which captures the endless up and down movement of the market. Therefore, EFW Pattern Trader can be considered as the robust price action indicator. Any patterns in EFW Pattern Trader can be backtested visually in your strategy tester. Visual backtesting with pattern will show you how pattern will likely behave in the live trading. Therefore, you

Compruebe lo fácil y sencillo que es comprar un robot en la MetaTrader AppStore, la tienda de aplicaciones para la plataforma MetaTrader.
El Sistema de pago MQL5.community permite efectuar pagos con ayuda de PayPal, tarjeta bancaria y los sistemas de pago más populares. Además, le recomendamos encarecidamente testar el robot comercial antes de la compra, para así hacerse una idea más completa sobre él.
Está perdiendo oportunidades comerciales:
- Aplicaciones de trading gratuitas
- 8 000+ señales para copiar
- Noticias económicas para analizar los mercados financieros
Registro
Entrada
Si no tiene cuenta de usuario, regístrese
Para iniciar sesión y usar el sitio web MQL5.com es necesario permitir el uso de Сookies.
Por favor, active este ajuste en su navegador, de lo contrario, no podrá iniciar sesión.