Neue technische Indikatoren für den MetaTrader 5 - 69
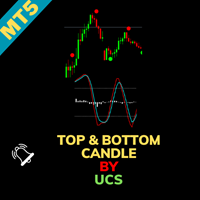
UCS_Top & Bottom Candle Indikator für MetaTrader 5 Der UCS_Top & Bottom Candle ist ein innovativer, experimenteller Indikator für MetaTrader 5. Basierend auf dem Momentum identifiziert dieser Indikator die Top- und Bottom-Kerzen für die meisten Swing-Bewegungen und hilft Händlern, präzise Marktein- und -ausstiege zu tätigen. Hauptmerkmale: Momentum-basierte Analyse: Nutzt das Momentum, um die Top- und Bottom-Kerzen für Swing-Trading-Gelegenheiten zu erkennen. Anpassbare Einstellungen: Prozent K:

Name des Indikators: G-Kanal-Trend-Erkennung Überblick: Der G-Channel Trend Detection Indikator bietet einen einzigartigen Ansatz zur Trendanalyse, der die G-Channel-Methodik von AlexGrover nutzt. Dieser Indikator bietet eine klare und vereinfachte Sicht auf Markttrends, indem er bullische und bärische Bedingungen auf der Grundlage von Preisinteraktionen mit den G-Channel-Grenzen identifiziert. Hauptmerkmale: Trend-basierte Marktanalyse: Der Indikator bestimmt die Trendrichtung durch Beobachtung
Der Day Trading Price Pattern-Indikator ist ein Indikator für Einstiegspunkte, der für Dutzende von Handelsinstrumenten und für alle gängigen Zeitrahmen (m1, m5, m15, m30, H1, H4, D1, Wk, Mn) Price Action System-Muster sucht und anzeigt. Zeigen Sie alle wichtigen Price Patterns sind in der Ebook Day Trading With Price Action - Galen Wood eingeführt Sie werden kein potenzielles Trading-Setup mehr verpassen.
Möchten Sie alle Signale an Ihren Telegram-Kanal senden? Sehen Sie sich diesen Leitfaden
FREE

Verbessern Sie Ihr Trading mit dem Buraq Bars Indikator! Bringen Sie Ihr Trading auf die nächste Stufe mit Buraq Bars ! Dieser einfach zu bedienende Indikator zeichnet Balken auf Ihrem Chart, wenn der RSI (Relative Strength Index) die von Ihnen gewählten Werte über- oder unterschreitet. So erhalten Sie klare Signale, die Ihnen helfen, besser zu handeln. Hauptmerkmale: Legen Sie Ihre eigenen RSI-Niveaus fest: Wählen Sie die Werte für überkauft und überverkauft, die für Sie am besten geeignet sind

Heiken Ashi MT5 Indikator Verbessern Sie Ihre Marktanalyse mit dem Heiken Ashi MT5 Indikator. Dieses leistungsstarke Tool verwandelt Standard-Preisdaten in glattere, trendorientierte Kerzen, wodurch die Identifizierung von Markttrends und potenziellen Umkehrpunkten erleichtert wird. Hauptmerkmale: Klare Trendidentifikation: Unterscheiden Sie visuell zwischen Aufwärts- und Abwärtstrends durch unterschiedliche Kerzenfarben. Rauschreduktion: Filtern Sie Preisschwankungen heraus und erhalten Sie ei
FREE

Überblick SwingVolumePro ist ein fortschrittlicher und vielseitiger Indikator, der für eine breite Palette von Finanzinstrumenten entwickelt wurde und verschiedene Handelsstile unterstützt. Basierend auf strengen Analysen von Volumen und Preis bietet er klare und präzise Signale, die es Händlern aller Erfahrungsstufen ermöglichen, informierte Entscheidungen auf Grundlage hochwertiger Daten zu treffen.
SwingVolumePro.PDF
Hauptmerkmale Vielseitigkeit: SwingVolumePro kann auf verschieden

„Der Ultimate Bot Alerts-Indikator ist ein leistungsstarkes Tool für MetaTrader 5, das Händlern dabei hilft, potenzielle Ein- und Ausstiegspunkte im Markt zu identifizieren. Dieser Indikator verwendet einen ausgeklügelten Algorithmus, der auf Average True Range (ATR) und Preisbewegungen basiert, um Kauf- und Verkaufssignale zu generieren.
Wenn Sie den Ultimate Bot Alerts-Indikator auf Ihr Diagramm anwenden, sehen Sie grüne Pfeile für Kaufsignale und rote Pfeile für Verkaufssignale. Diese Signa

Aufgrund technischer und logischer Manipulationen durch Brokerage habe ich einen langen Weg zurückgelegt, um diesen Indikator zu entwickeln, der zahlreiche Strategien mit den folgenden Fähigkeiten kombiniert:
Identifizierung von Markttrends: Verstehen Sie den allgemeinen Trend des Marktes.
Umkehrpunkte: Identifizieren Sie potenzielle Punkte, an denen der Markt die Richtung ändern könnte.
Einstiegs- und Ausstiegspunkte: Bestimmen Sie optimale Zeitpunkte für den Einstieg und Ausstieg aus Trade

Adaptive Volatility Range [AVR] - ist ein leistungsstarkes Instrument zur Identifizierung wichtiger Trendumkehrungen. AVR - zeigt die durchschnittliche wahre Volatilitätsspanne unter Berücksichtigung des volumengewichteten Durchschnittspreises genau an. Der Indikator ermöglicht es Ihnen, sich an absolut jede Marktvolatilität anzupassen, indem er die durchschnittliche Volatilität über einen bestimmten Zeitraum berechnet - dies liefert einen stabilen Indikator für positive Transaktionen. Dank dies
Perfekt gestaltet für Trader, die Klarheit, Präzision und Benutzerfreundlichkeit schätzen, bietet dieser hochmoderne Renko-Chart-Indikator alles, was Sie benötigen, um Ihre Handelsstrategie zu verbessern. Im Gegensatz zu herkömmlichen Generatoren, die Offline-Charts erstellen, liefert dieser Indikator Renko-Charts in Echtzeit direkt auf Ihrer Live-Handelsplattform. Der Live Renko-Indikator funktioniert auch nahtlos auf Synthetic Indices wie Volatility 75, Step Index, Boom und Crash.

DTFX Algo Zones sind automatisch generierte Fibonacci-Retracements, die auf Marktstrukturverschiebungen basieren.
Diese Retracement-Levels sollen als Unterstützungs- und Widerstandslevels verwendet werden, an denen der Preis abprallen kann, um die Richtung zu bestätigen.
ANWENDUNG Abbildung 1 Da die Retracement-Levels nur aus identifizierten Marktstrukturverschiebungen generiert werden, sind die Retracements darauf beschränkt, nur aus Bereichen zu ziehen, die aufgrund des technischen Brea

Der SMC ICT-Indikator integriert die Schlüsselkonzepte von Smart Money Concepts und Inner Circle Trader in einem praktischen und präzisen Werkzeug.
Er zeigt die wichtigsten Niveaus und Muster auf dem Chart für eine klare Analyse nach dem ICT-Ansatz an.
Optimiert für eine agile Verarbeitung, ermöglicht er ein reibungsloses Backtesting ohne Repainting, Freezes oder Verzögerungen - für Präzision und Effizienz in Ihrem Handel.
Enthaltene Konzepte Es umfasst Fair Value Gap (FVG), Orderblöcke, Ungle

Mit dem Indikator Volume Order Blocks stellen wir Ihnen ein revolutionäres Tool vor, das für Händler entwickelt wurde, die bei ihrer Marktanalyse Präzision und Klarheit verlangen. Dieser fortschrittliche Indikator identifiziert nicht nur Orderblöcke, sondern integriert auch wichtige volumetrische Daten, die es Ihnen ermöglichen, die Stärke dieser Blöcke mit unvergleichlicher Genauigkeit zu beurteilen. MT4-Version - https://www.mql5.com/en/market/product/121237/ Hauptmerkmale der Volume Order

Orderblock-Jäger-Indikator ist der beste Indikator für die Jagd nach Orderblöcken, d.h. nach Bereichen, in denen eine große Konzentration von Limit-Orders auf ihre Ausführung wartet. Orderblöcke werden auf einem Chart identifiziert, indem frühere Kursbewegungen beobachtet werden und nach Bereichen gesucht wird, in denen der Preis signifikante Bewegungen oder plötzliche Richtungsänderungen erfahren hat.Dieser Indikator macht das für Sie, indem er sehr komplizierte Codes verwendet und Ihnen hilft,

Channel Vertex ist ein Preis-Aktions-Muster, das durch den Preis Chanel und ein Dreieck-Muster gebildet wird. Preiskanäle zeigen grundsätzlich mögliche Unterstützungs- und Widerstandszonen um eine Preisbewegung an und ein Rückfall oder Ausbruch auf diesen Ebenen kann eine mögliche Trendfortsetzung oder -umkehr anzeigen.
In den meisten Fällen bilden Preisschwankungen Dreiecksmuster, die durch 3 Scheitelpunkte definiert sind, diese Dreiecksmuster definieren meistens eine Trendfortsetzung. Ein Dre
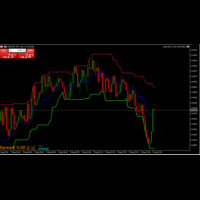
Der von mir entwickelte Donchian-Channel-Indikator ist ein leistungsfähiges Instrument zur Analyse von Preistrends und Volatilität. Durch die Darstellung des höchsten Hochs und des niedrigsten Tiefs über einen bestimmten Zeitraum hilft er, potenzielle Ausbruchschancen und Trendumkehrungen zu erkennen. Dieser Indikator ist wertvoll für Händler, die die Marktdynamik verstehen und fundierte Entscheidungen auf der Grundlage von Kursbewegungen treffen wollen. Seine Einfachheit und Effektivität machen
FREE

Der Market Structure Analyzer ist ein leistungsstarkes Tool für Händler, die sich mit Marktstrukturen und Smart-Money-Konzepten beschäftigen. Dieser umfassende Indikator bietet eine Reihe von Funktionen, die dabei helfen, wichtige Marktniveaus, potenzielle Einstiegspunkte und Liquiditätsbereiche zu identifizieren. Das bietet er:
1. Erkennung von Hoch-/Tiefständen : Identifiziert und markiert präzise Hochs und Tiefs und bietet so einen klaren Überblick über die Marktstruktur.
2. Dynamische Ang

Dieser Indikator identifiziert und hebt Marktineffizienzen, sogenannte Fair Value Gaps (FVG), auf Kurscharts hervor. Mithilfe eines benutzerdefinierten Algorithmus erkennt der Indikator diese Bereiche des Ungleichgewichts, in denen sich der Preis stark bewegt, was potenzielle Handelsmöglichkeiten schafft. Parameter des Indikators: Bullish FVG Farbe (clrBlue) : Farbe, mit der bullische Ineffizienzen hervorgehoben werden. Der Standardwert ist blau. Bearish FVG Farbe (clrRed) : Farbe zur Hervorhebu
FREE

Session Box Indikator für MetaTrader 5 WICHTIGER HINWEIS: **Ein neuer Eingabeparameter ( Skip weekends ) wurde eingeführt, der für 24/7 geöffnete Märkte auf false gesetzt werden muss** Version 1.00 Freigabe Version 1.01 Vollständige Überarbeitung des Codes Version 1.02 Fix: fehlende Schriftart hinzugefügt und Emoji als Session-Name entfernt, Label-Positionierung hinzugefügt Version 1.03 Fix: korrekte Wochenendbehandlung, vollständige Minutenunterstützung für alle Sitzungen, unabhängige Labelpos
FREE

Überblick: Der US-Dollar-Index (DXY) ist ein wichtiger Finanzindikator, der die Stärke des US-Dollars gegenüber einem Korb von sechs wichtigen Weltwährungen misst. Dieser Index ist für Händler und Anleger von entscheidender Bedeutung, da er einen umfassenden Überblick über die allgemeine Marktstimmung gegenüber dem US-Dollar und seine relative Performance bietet. Alle Produkte | Kontakt Zusammensetzung: Der DXY setzt sich wie folgt zusammen: Euro (EUR): 57,6% Japanischer Yen (JPY): 13,6% Britisc
FREE

STAUAUSBRUCH PRO
Dieser Indikator scannt den Ausbruch von Stauzonen. Dieser Indikator unterscheidet sich von allen anderen Stau-Indikatoren, die Sie derzeit auf dem Markt finden. Er verwendet einen fortschrittlichen Algorithmus, der den meisten traditionellen Stau-Indikatoren, die heute verfügbar sind, nicht eigen ist. Der fortschrittliche Algorithmus, der zur Definition der Staus verwendet wird, ist in hohem Maße für die hohe Rate echter Stauzonen und die niedrige Rate falscher Stauzonen vera
Indikator für MT5, der den Spread, BUY SWAP (BS) und SELL SWAP (SS) in einem Unterfenster anzeigt.
Die Größe und Farbe der Schriftart der Anzeige kann eingestellt werden, und die Spread-Anzeige kann zwischen PIPS und POINTS umgeschaltet werden, so dass Sie sie je nach den Farbeinstellungen des Charts verwenden können. Die Anzeige ist auf die Größe des Unterfensters zentriert.
(Bitte kooperieren Sie!) Dies ist ein kostenloser Service. Sie können ihn gerne nutzen. Wenn Sie möchten, können Sie au
FREE

Der Indikator identifiziert die Beziehung zwischen dem Index und der Summe der wichtigsten Vermögenswerte, funktioniert für jeden Markt in der Welt , hat einen WPR-Oszillator mit der Summe der wichtigsten Vermögenswerte gewählt, was die Antizipation der Bewegung in Bezug auf den Index. Merkmale WPR mit der Summe der gewählten Wertpapiere - weiß WPR des aktuellen Papiers - rot Trend-Kanal Der Indikator kann auf kommende Bewegungen hinweisen: Kreuzung der Linien Kreuzung der Multi Symbols Linie b
FREE

Elder-Impuls-Indikator Überblick: Der Elder-Impuls-Indikator ist ein leistungsstarkes Instrument für Händler, die die Stärken von Trendfolge- und Momentum-Strategien kombinieren möchten. Der von Dr. Alexander Elder entwickelte Indikator hilft Händlern, potenzielle Einstiegs- und Ausstiegspunkte zu identifizieren, indem er sowohl die Kursrichtung als auch das Momentum analysiert. Er ist ein unverzichtbares Instrument, um unter verschiedenen Marktbedingungen fundierte Entscheidungen zu treffen, e
Das Delta-Volumen ist ein leistungsstarkes Instrument, das in verschiedenen Handelsstrategien eingesetzt wird, insbesondere beim Handel mit Futures, Aktien und Kryptowährungen. Hier sind einige der wichtigsten Strategien, bei denen Delta-Volumen häufig eingesetzt wird: Trendidentifizierung : Das Delta-Volumen hilft dabei, die Richtung des vorherrschenden Trends zu erkennen, indem es anzeigt, ob es einen größeren Kauf- oder Verkaufsdruck gibt. Dies kann nützlich sein, um die Stärke eines Trends z
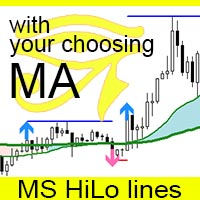
Der MS High Low Lines-Indikator ist ein Tool zur Verbesserung der Trendvisualisierung für MT5. Er zeigt Höchst- und Tiefstkurse als Linien an, wobei die von Ihnen bevorzugten Einstellungen für gleitende Durchschnitte (MA) verwendet werden (entweder SMA oder EMA, mit anpassbaren Zeiträumen). Der Indikator zeigt konfigurierte Signale an, wenn die Kurse über oder unter diese MAs brechen. Durch die Einrichtung mit hochfunktionalen MAs können Händler Markttrends besser verstehen und Geschäfte mit ein
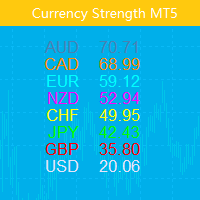
Dieser Indikator zeigt die relative Stärke von acht Hauptwährungen (USD, EUR, GBP, AUD, NZD, CAD, CHF, JPY). Kraftwerte werden im Bereich von 0 bis 100 normalisiert. Werte über 60 bedeuten stark. Ein Wert unter 40 deutet auf Schwäche hin.
Fahrkarte Only Show Current Pair - Bei „true“ wird nur das aktuelle Diagrammpaar angezeigt. Ansonsten werden alle acht Kurven angezeigt. Bars To Show – Anzahl der Balken zur Anzeige der Kraftkurve. Ma Periods To Smooth Curves : Gleitende Durch

VolaMetrics VSA | Ein Mächtiger Verbündeter in der Technischen Analyse Der VolaMetrics VSA ist ein technischer Analyseindikator, der die Volume Spread Analysis (VSA) Methode mit einer detaillierten Analyse des Handelsvolumens kombiniert. Entwickelt, um signifikante Preisbewegungen zu identifizieren und zu verfolgen , nutzt der VolaMetrics VSA die Interaktion zwischen Volumen und Preisspread , um wertvolle Einblicke zu bieten, die bei Handelsentscheidungen unterstützen können. Grundlagen der V

Support Resistance Breakout Indicator MT5でブレイクアウト取引を向上させましょう。このZigZagを基盤とした強力なツールは、サポートとレジスタンスゾーンを動的に特定し、外国為替、株式、暗号通貨、商品市場で高確率のエントリーポイントを提供する確認済みのブレイクアウトシグナルを配信します。InvestopediaやBabyPipsなどのサイトで説明されている確立されたプライスアクションの原則に基づき、サポート/レジスタンスのブレイクアウトは、買い手と売り手のダイナミクスの変化によりトレンドの反転または継続を示すと評価されており、このインジケーターはRedditのr/Daytradingやr/Forex、Forex Factoryのフォーラムなどの取引コミュニティで高い評価を得ています。ユーザーは有効なブレイクアウトを特定する精度が最大75%に達し、クローズベースのトリガーにより偽のシグナルが減少し、基本的な確認を組み合わせることで勝率が15-30%向上し、しばしば不安定なセッションを収益機会に変えると報告しています。主な利点には、モメンタムを活用す

Fractals Aydmaxx 2024 Überblick: Fractals Aydmaxx 2024 ist ein von Aydmaxx entwickelter Indikator für die Handelsplattform MQL5. Dieser Indikator identifiziert und zeigt fraktale Muster auf Ihrem Trading-Chart an, die für die Erkennung potenzieller Marktumkehrungen unerlässlich sind. Der Indikator hebt sowohl Bullen- als auch Bärenfraktale hervor, was es für Händler einfacher macht, wichtige Unterstützungs- und Widerstandsebenen zu erkennen. Merkmale: Anpassbare Fraktale : Der Benutzer kann die
FREE
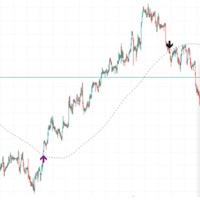
Wenn der Kurs über dem gleitenden Durchschnitt langsamer Länge liegt, kann es zu einem Ausbruch kommen. Wenn der Kurs unter den gleitenden Durchschnitt fällt, kann es zu einem Pullback auf dem Markt kommen. Dies ist schon seit langem bekannt, aber es gibt nicht viele Indikatoren, die auf dieses Ereignis hinweisen. Bei diesem Indikator wird auch eine Candlestick-Muster-Validierung verwendet, so dass bei Doji-Kerzen oder kleinen "Unsicherheitskerzen" keine Signale gezeichnet werden. Die Länge der
FREE
KLICKEN SIE HIER, UM UNSERER WHATSAPP-GRUPPE BEIZUTRETEN.
Dieser Handelsindikator identifiziert und zeichnet automatisch Kontraktblöcke ein, d.h. wesentliche Zonen, die durch bedeutende Unterstützungs- und Widerstandsniveaus gekennzeichnet sind. Dieses leistungsstarke Tool bietet Händlern eine klare und intuitive Visualisierung von kritischen Marktpunkten, an denen die Kurse wahrscheinlich abprallen oder umkehren werden. Die Kontraktblöcke, die durch unterschiedliche farbige Rechtecke dargeste
FREE
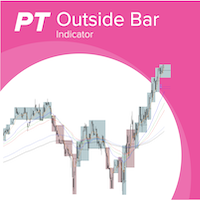
Aussenstab are important in professional price action trading and were made popular by Michael Voigt. Highs and lows of outside bars ( Aussenstäbe ) can be utilized as entry and exit for trades following different strategies. Examples for strategies with inside/outside bars are Reversal Trend continuation Breakout Ranges This indicator allows to displays outside bars on the current and configurable higher timeframes. E.g. you can display the M5 outside bars on a M1 timeframe to see the bigg

Durchschnittliche Sitzungsspanne: Berechnen und mitteln Sie die Hoch-Tief-Spanne bestimmter Zeitabschnitte über mehrere Tage. Die Session Average Range ist ein ausgeklügeltes und präzises Tool zur Berechnung der Volatilität bestimmter Zeitabschnitte innerhalb eines Handelstages. Durch die sorgfältige Analyse der Spanne zwischen den Höchst- und Tiefstkursen einer bestimmten Handelssitzung über mehrere Tage hinweg bietet dieses Tool Händlern eine klare und umsetzbare Durchschnittsspanne. **Hinweis
FREE

Wir stellen den BOOM CRASH MASTER Indikator vor: Entfesseln Sie die Kraft des Präzisionshandels! Treten Sie ein in die Welt des unvergleichlichen Handels mit dem BOOM CRASH Master Indicator, der exklusiv für die Boom- und Crash-Indizes von Deriv Broker entwickelt wurde. Mit diesem innovativen Tool beherrschen Sie die Kunst der Spike-Erkennung und des Anti-Spike-Einstiegs und sind damit jeder Marktbewegung voraus. Empfehlungen: Symbole: Jeder Boom- oder Crash-Index
Zeitrahmen: 1 Minute / 5 Minut
Der VSA Scanner Dashboard ist ein Multi-Symbol, Multi-Timeframe Scanner, der VSA Signale anzeigt. Er basiert auf dem Indikator Volume Plus und VSA Signals . Merkmale Zeigt das VSA-Signal der letzten geschlossenen Kerze an. Überwacht 28 anpassbare Instrumente (Symbole) und bis zu 21 Timeframes gleichzeitig. Einfache Anordnung der Symbole in beliebiger Reihenfolge. Jedes Signal hat einen Tooltip, der den Namen und den Zeitpunkt des Auftretens anzeigt. Klicken Sie auf jedes Signal, um ein neues Dia

Dieser Indikator/Dashboard wird auf ein einzelnes Symbol gesetzt. Er zeigt die prozentuale Bewegung innerhalb aller Zeitrahmen von M1 bis W1 an, wobei der Text grün wird, wenn alle % im positiven Bereich sind, was ein Kaufsignal darstellt, und rot, wenn alle % unter Null und im negativen Bereich sind, was ein Verkaufssignal darstellt. Es gibt akustische Benachrichtigungen sowie Benachrichtigungen auf dem Bildschirm zusammen mit Push-Benachrichtigungen, die in den Einstellungen ein- und ausgescha
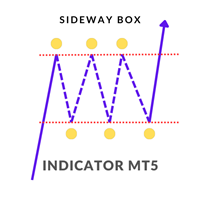
Sideway Box-Indikator
Der Sideway Box Indicator ist ein fortschrittliches Handelsinstrument, das Händlern hilft, seitwärts tendierende Märkte zu erkennen und zu nutzen. Dieser leistungsstarke Indikator erkennt Zeiträume, in denen sich der Markt in einer Seitwärtsphase (Range) befindet, und gibt Händlern klare visuelle Hinweise. Hauptmerkmale
Erkennung von Seitwärtsmärkten : Der Sideway Box-Indikator erkennt genau, wenn sich der Markt in einer Seitwärtsphase befindet, so dass Händler erkennen kö

Dieses MQL5 Speed Indicator Skript berechnet die durchschnittliche Geschwindigkeit der Preisbewegungen für ein ausgewähltes Finanzinstrument über einen bestimmten Zeitraum. Es verwendet das arithmetische Mittel, um die Durchschnittsgeschwindigkeit zu bestimmen, die berechnet wird, indem der Abstand (Preisänderung) durch das Zeitintervall dividiert wird. Der Indikator zeigt diesen Wert dann als Histogramm in einem separaten Fenster an. Berechnung der Durchschnittsgeschwindigkeit : Die Geschwindig
Der "Orderblock-Indikator für MetaTrader 5" ist ein fortschrittliches Handelsinstrument, das Händlern helfen soll, wichtige Orderblockzonen auf den Finanzmärkten zu erkennen. Orderblöcke sind Bereiche, in denen institutionelle Käufe und Verkäufe stattfinden. Sie markieren oft wichtige Kursniveaus, in denen Marktumkehrungen oder Fortsetzungen wahrscheinlich sind. Dieser Indikator stellt diese Zonen direkt auf dem Chart visuell dar und ermöglicht es Händlern, fundiertere Handelsentscheidungen zu t

Überblick Der Breakout- und Retest-Indikator wurde entwickelt, um potenzielle Handelsgelegenheiten zu identifizieren, indem er Kursausbrüche aus signifikanten Unterstützungs- und Widerstandsniveaus erkennt, gefolgt von einem Retest des durchbrochenen Niveaus. Wie funktioniert er? Der Indikator analysiert die Kursdaten, um wichtige Unterstützungs- und Widerstandsbereiche zu ermitteln. Wenn der Kurs eines dieser Niveaus entscheidend durchbricht und es dann erneut testet, wird ein potenzieller Ausb

Preis- und Spread-Indikator
Version: 1.0 Entwickler: Creative Tech Lösungen Website: https: // www.creativetechsolutions.co.uk
Überblick Der Preis- und Spread-Indikator ist ein großartiges Tool für MetaTrader 5, das den Geld- und Briefkurs zusammen mit dem Spread direkt auf dem Chart anzeigt. Dieser Indikator bietet Echtzeit-Updates und ermöglicht es Händlern, fundierte Entscheidungen auf der Grundlage genauer Preisinformationen zu treffen.
Funktionen - Preisaktualisierungen in Echtzeit: Kon
FREE
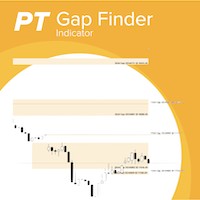
Mit dem Gap-Finder-Indikator werden Gaps zwischen den Handelssitzungen automatisch zu Ihrem Chart hinzugefügt und Sie verpassen nie wieder ein Gap, das Sie in Ihren Handelsstrategien verwenden können. Gaps wirken oft wie ein Magnet, zu dem die Märkte zurückkehren, oder wenn eine Lücke geschlossen wird, stellt dies oft einen Umkehrpunkt dar. Hauptmerkmale: Unterstützung für mehrere Handelssitzungen in einem einzigen Chart, z.B. Marktsitzung und Futuresitzung Konfigurierbare Anzahl von Tagen für d
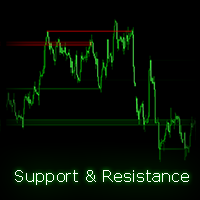
Dieser Indikator findet und plottet automatisch Support- und Widerstandskanäle auf Ihrem Chart, um wichtige Level einfach zu identifizieren. Der Indikator unterstützt mehrere Zeitrahmen, sodass Sie Kanäle aus verschiedenen Zeitrahmen auf Ihrem aktuellen Chart anzeigen können. Darüber hinaus bietet er transparente Farben für verbesserte visuelle Klarheit und ermöglicht es Ihnen, die Farben der Kanäle nach Ihren Wünschen anzupassen. Wie funktioniert dieser Indikator? Der Indikator findet Schwingun

AtBot: Wie es funktioniert und wie man es benutzt ### Wie es funktioniert Der "AtBot"-Indikator für die MT5-Plattform generiert Kauf- und Verkaufssignale mithilfe einer Kombination von technischen Analysetools. Er integriert den einfachen gleitenden Durchschnitt (SMA), den exponentiellen gleitenden Durchschnitt (EMA) und den Durchschnitt der wahren Reichweite (ATR)-Index, um Handelsmöglichkeiten zu identifizieren. Darüber hinaus kann er Heikin Ashi-Kerzen verwenden, um die Signalgenauigkeit zu
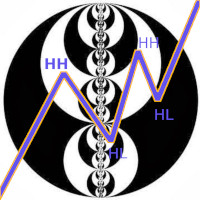
Der Indikator für die Marktstruktur im aktuellen Zeitrahmen findet:
1. Trend (aufsteigende und absteigende Wellen). Die Änderung der Richtung der Welle erfolgt nach dem Ausfall des Extremums (Liquiditätsabzug von der gegenüberliegenden Seite). Das Rendern eines Trends erfolgt unter Berücksichtigung der äußeren Balken (es kann 2 Extreme an einer äußeren Leiste geben). Der Trend kann sich mit der minimalen Anzahl von Balken in der Welle (2 oder mehr) abbilden. Wird durch den Parameter QTY_bars_f

Kerzenzeit CountDown Von BokaroTraderFx Der Candle Timer Countdown Indikator ist ein vielseitiges Tool, das für die Handelsplattform MetaTrader 5 (MT5) entwickelt wurde. Er bietet Händlern einen visuellen Countdown der verbleibenden Zeit für die aktuelle Kerze in einem Chart. Die wichtigsten Merkmale sind:
Anpassbare Position: Platzieren Sie den Countdown-Timer in einer beliebigen Ecke des Charts für optimale Sichtbarkeit. Standard-Textfarbe: Zur besseren Sichtbarkeit auf Rot eingestellt, mit O
FREE

Balanced Work-Indikator: Ihr Tor zum Trendhandel Balanced Work ist ein Trendfolgeindikator, der Marktanalysen und Handelsentscheidungen vereinfachen soll. Dieses algorithmische Tool zeichnet zweifarbige Punkte entlang des Preisdiagramms, die durch Linien verbunden sind und eine klare visuelle Darstellung der Markttrends bieten. Die Einfachheit dieses Indikators liegt in seinen farbkodierten Signalen: Kaufen, wenn ein blauer Punkt erscheint, und verkaufen, wenn ein roter Punkt erscheint. Er eign
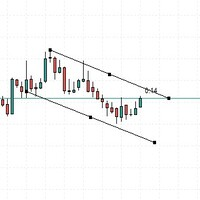
Dieser Indikator dient dazu, akustische Warnungen zu geben, wenn der Kurs die manuell gesetzte Linie passiert. Ein sehr nützliches Werkzeug, mit dem Sie nicht zu viel Zeit vor dem Computer verbringen müssen.
Beachten Sie, dass sich der ausgegebene Alarm immer auf die aktuelle Kerze bezieht, Sie können mehrere Linien im vergangenen Chart zur Analyse verwenden.
Dieser Indikator wird immer besser aktualisiert.
FREE

Gleitender Pivot Durchschnitt Fibonacci
Der Indikator vergleicht die gewählte Periode mit dem Gegenstück der vorherigen Periode. Der Indikator bestimmt die gleitenden Fibonacci-Levels für den Tag oder ein beliebiges Zeitintervall, um den Bereich der Preisbewegung vom Zeitdurchschnitt aus zu bewerten. Der Indikator hilft bei der Vorhersage des erwarteten Tageshochs oder -tiefs auf der Grundlage historischer Zeitdaten. Die Pivot-Linie kann als durchschnittliche Trendlinie betrachtet werden und in

Der Insight Flow Indicator zeichnet sich in erster Linie dadurch aus, dass er nicht nachzeichnet, nicht nachzieht und nicht verzögert. Dies macht ihn zur ersten Wahl sowohl für den manuellen als auch für den algorithmischen Handel und gewährleistet zuverlässige und konsistente Signale. Benutzerhandbuch: Einstellungen, Eingaben und Strategie Der Insight Flow-Indikator nutzt die Preisbewegung, die Stärke und das Momentum, um einen klaren Vorsprung auf dem Markt zu erzielen. Ausgestattet mit fortsc
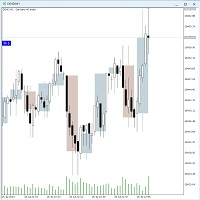
Der Twotimeframe-Candles (RFrame) - Indikator für MT5 zeigt die Kerzen eines höheren Zeitrahmens als Overlay auf dem aktuellen Zeitrahmen.
Sie können die Anzahl der Candles und die Farbe der Overlays wählen.
Der Indikator berechnet die aktuelle Kerze bei jedem Tick.
Wenn Ihnen der Indikator gefällt, hinterlassen Sie bitte einen Kommentar. Version 1.1: Der zweite Timeframe kann jetzt eingestellt werden.
Stichwörter: Candlestick, Multitimeframe, Two Timeframes
FREE

Übersetzer MeraMera Custom Indicator für MetaTrader 5
Übersicht:
Der MeraMera-Indikator ist ein leistungsfähiges Tool für MetaTrader 5, das sich an Händler richtet, die eine entschlossene, risikoreiche und ertragreiche Handelsstrategie bevorzugen. Sein Motto "GO Full Margin or GO Home" bringt seinen aggressiven Ansatz beim Handel auf den Punkt. Dieser benutzerdefinierte Indikator analysiert die Marktbedingungen, um potenzielle Hausse- und Baisse-Signale zu erkennen, und hilft Händlern, fundier

Das ICT Immediate Rebalance Toolkit ist ein umfassendes Paket von Werkzeugen, die Händlern dabei helfen sollen, entscheidende Handelszonen und -muster im Markt zu erkennen.
Das ICT Immediate Rebalance wird zwar häufig übersehen, erweist sich aber als eines der einflussreichsten Konzepte der ICT, insbesondere wenn es in einem bestimmten Kontext betrachtet wird. Das Toolkit integriert gängige Price-Action-Tools, die in Verbindung mit den Immediate Rebalance-Mustern verwendet werden können und di
Ein einfacher Indikator für die Darstellung eines Tick-Charts.
Mit diesem Indikator können Sie die Spread-Dynamik und das Preisverhalten im Allgemeinen verfolgen.
In den Einstellungen können Sie den Preis auswählen, der im Chart angezeigt werden soll - Bid, Ask oder beide Preise gleichzeitig.
Der Tick-Chart-Indikator wird Ihnen bei der Anwendung von Scalping-Strategien sicherlich nützlich sein. Die MT4-Version ist hier verfügbar. Wir wünschen allen viel Glück und erfolgreiches Trading!
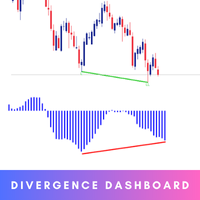
Das Smart Divergence Dashboard ist Ihr ultimatives Werkzeug zur Identifizierung von Handelsgelegenheiten mit hoher Wahrscheinlichkeit. Dieser hochmoderne Indikator wurde sorgfältig entwickelt, um regelmäßige Divergenzen zu erkennen und bietet Händlern einen klaren und umsetzbaren Vorteil. MT4-Version - https://www.mql5.com/en/market/product/120702/ Hauptmerkmale: Erkennung von Divergenzen in Echtzeit : Sofortige Erkennung von Divergenzen zwischen höherem Hoch und niedrigerem Tief sowie zwischen

Der Indikator zeigt die Gesamtzahl der Ticks während der Bildung eines einzelnen Balkens an. Er kann zur Analyse der Marktaktivität im Finanzhandel verwendet werden. Die Höchst- und Tiefstwerte des Indikators zeigen potenzielle Umkehrpunkte in den Kursbewegungen auf. Dieses Instrument ist besonders nützlich für Händler, die Perioden hoher Volatilität erkennen wollen, da sie auf der Grundlage der Tick-Volumen-Muster fundierte Entscheidungen treffen können. Durch die Beobachtung von Veränderungen

Dynamischer Bereich und Zielindikator: Ihr zuverlässiger Handelspartner
Wir stellen Ihnen einen innovativen Indikator vor, der die Art und Weise, wie Sie Märkte analysieren und Handelsentscheidungen treffen, revolutioniert. Ganz gleich, ob Sie ein Anfänger sind, der eine klare Anleitung sucht, oder ein erfahrener Händler, der seine Strategie verbessern möchte - dieses Tool ist genau auf Ihre Bedürfnisse zugeschnitten.
Hauptmerkmale:
1. Dynamische Bereichsermittlung: Der Indikator analysiert

Der Indikator gibt ein Kauf- oder Verkaufssignal, wenn die Bedingungen der Strategie, mit der er entwickelt wurde, erfüllt sind. Die Strategie ist garantiert, stark, und wurde für 9 Jahre getestet. Der Indikator ist für binäre Optionen und kann in einen Bot umgewandelt werden, indem man ihn mit MT2Trading verknüpft, wo er das Signal an diese Plattform sendet. Diese Plattform eröffnet automatisch einen Handel auf der Handelsplattform, die Sie verwenden, egal ob es sich um Pocket Option, IQ Option
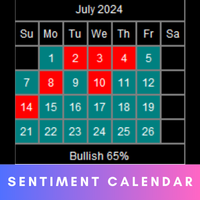
Der Marktstimmungs-Kalender bietet eine visuelle Darstellung der Marktstimmung für jeden Tag oder Monat. Er zeigt den täglichen und monatlichen BIAS an . Der Kalender zeigt auch den Prozentsatz der bullischen Tage oder Monate innerhalb eines bestimmten Monats oder Jahres an. MT4-Version - https://www.mql5.com/en/market/product/120767/ Eingaben Häufigkeit: Wählen Sie zwischen den Kalenderansichten "Täglich" und "Monatlich". Sentiment-Methode: Wählen Sie die Methode zur Ermittlung des täglichen od

Der Trendlinien mit Unterbrechungen-Indikator liefert pivotpunktbasierte Trendlinien mit hervorgehobenen Unterbrechungen. Der Benutzer kann die Steilheit der Trendlinien sowie die Methode zur Berechnung der Steigung einstellen.
Trendlinienausbrüche erfolgen in Echtzeit und unterliegen keinem Backpainting. Trendlinien können jedoch neu gezeichnet werden, es sei denn, dies ist in den Benutzereinstellungen deaktiviert.
Der Indikator enthält integrierte Warnungen für Trendlinienausbrüche . Jede
Wir stellen Ihnen den Goldmarkt-Pfeilindikator vor, der speziell für den 15-Minuten-Chart entwickelt wurde. Dieses fortschrittliche Tool liefert klare und umsetzbare Kauf- und Verkaufspfeile, die es Händlern ermöglichen, zeitnahe und fundierte Entscheidungen auf dem Goldmarkt zu treffen. Egal, ob Sie ein erfahrener Händler oder ein Anfänger sind, unser Indikator vereinfacht komplexe Marktdaten in klare Signale und stellt sicher, dass Sie keine Gelegenheit verpassen, von Goldpreisbewegungen zu pr

Trend Stop Einführung Trend Stop ist ein einfaches, aber leistungsstarkes Trendfolge- und Stop-Placement-Tool für MetaTrader 5.
Es berechnet das höchste Hoch oder das niedrigste Tief der letzten N Perioden und zeichnet eine dynamische Linie, die sofort auf Trendänderungen reagiert. Das Ergebnis ist ein sauberer, zuverlässiger Trendfilter und ein praktischer Leitfaden für die Platzierung optimaler Stop-Levels - ohne unnötiges Rauschen oder Verzögerung. Egal, ob Sie Trendhändler, Swingtrader oder
Dieser noch nie dagewesene Indikator ist ein Histogramm der sich kreuzenden MACD-Linien. Noch nie war es so einfach, eine Trendumkehr im Voraus zu erkennen. Er fixiert die Kreuzungspunkte der MACD-Linien auf dem Chart entsprechend Ihren Parametereinstellungen. Ideal für die Vorwegnahme von Trends und das Studium des Aktienmarktes. Detaillierte Beschreibung des Indikators: Er zeigt die Kreuzung der MACD- und der Signallinie genau an und wird später vom MACD-Indikator als Trendbestätigung bestäti

Easy Fibonacci ist ein Indikator für MT5, mit dem Sie Fibonacci-Retracements einfach zeichnen können. Funktionen Bis zu 10 Fibonacci-Level können in den Indikatoreinstellungen festgelegt werden. Jedes Level kann einen anderen Linienstil, Linienfarbe, Linienbreite und andere anpassbare Einstellungen haben. Sie können eine Maus mit zusätzlichen Tasten verwenden, um die Tasten V und B zuzuweisen und bequem Fibonacci zu zeichnen. Tastenaktionen: B und V: Fibonacci oben/unten im sichtbaren Bereich de
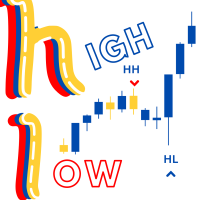
Swing Hoch/Tief Kennung
Der Swing High/Low Identifier ist ein benutzerdefinierter MetaTrader 5 (MT5) Indikator, der entwickelt wurde, um signifikante Swing-Punkte auf Ihrem Chart hervorzuheben. Dieser Indikator identifiziert und markiert Swing-Hochs und Swing-Tiefs auf der Grundlage einer konfigurierbaren Reihe von Bars.
- Swing Highs werden mit roten Pfeilen oberhalb der jeweiligen Kerzen markiert. - Schwungtiefs werden mit blauen Pfeilen unterhalb der entsprechenden Kerzen markiert.
Dieses
FREE

Finanzindikator SolarTrade Suite: Pluto Market Indicator – Ihr zuverlässiger Führer in der Welt der Finanzmärkte!
Es handelt sich um einen Volatilitätsoszillator, der spezielle innovative und fortschrittliche Algorithmen zur Berechnung seines Wertes verwendet und zudem ein ansprechendes Design aufweist.
Die Messwerte dieses Indikators sind sehr einfach zu verstehen: grüne Farbe – geringe Volatilität und der beste Zeitpunkt zum Eröffnen eines Handelsgeschäfts, orange Farbe – hohe Volatilität u

Finanzindikator SolarTrade Suite: Mercury Market Indicator – Ihr zuverlässiger Führer in der Welt der Finanzmärkte! Unser Forex-Handelsprogramm ist mit einer leistungsstarken künstlichen Intelligenz ausgestattet, die Marktdaten in Echtzeit analysiert. Es sagt Preisbewegungen genau voraus und hilft Händlern, fundierte Entscheidungen zu treffen. Mit fortschrittlichen Algorithmen optimiert unser Indikator Strategien und minimiert Risiken für Händler. Es handelt sich um einen gleitenden Durchschnit

Volume Break Oscillator ist ein Indikator, der Preisbewegungen mit Volumentrends in Form eines Oszillators in Einklang bringt.
Ich wollte Volumenanalysen in meine Strategien integrieren, war aber von den meisten Volumenindikatoren wie OBV, Money Flow Index, A/D, aber auch Volume Weighted MACD und vielen anderen immer enttäuscht. Deshalb habe ich diesen Indikator für mich selbst geschrieben, bin zufrieden mit seiner Nützlichkeit und habe mich daher entschieden, ihn auf dem Markt zu veröffentlic
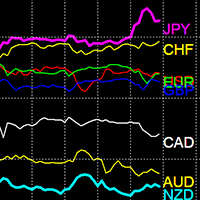
Währungsstärkeindikator
Der Währungsstärkeindikator ist ein leistungsstarkes Tool zur Erkennung von Trends. Er vergleicht die Stärke und Schwäche verschiedener Währungen und erleichtert das Auffinden trendiger Währungspaare.
Verkaufspreis: 49 $
Funktionen
Unterscheidet effektiv zwischen starken und schwachen Währungen Erkennt automatisch trendige Währungen Mehrere Zeitrahmen Lädt 28 Währungspaare Leistungsoptimiert
Indikatorverwendung Starke Währungen: Währungen über 80 gelten als stark.
MetaTrader Market - der einzige Shop, in dem man Handelsroboter als Demoversion herunterladen und testen sowie anhand historischer Daten optimieren kann.
Lesen Sie die Beschreibung und Bewertungen anderer Kunden über das gewünschte Produkt, laden Sie es direkt ins Terminal herunter und erfahren Sie, wie man einen Handelsroboter vor dem Kauf testet. Nur bei uns können Sie ein Programm testen, ohne dafür zu bezahlen.
Sie verpassen Handelsmöglichkeiten:
- Freie Handelsapplikationen
- Über 8.000 Signale zum Kopieren
- Wirtschaftsnachrichten für die Lage an den Finanzmärkte
Registrierung
Einloggen
Wenn Sie kein Benutzerkonto haben, registrieren Sie sich
Erlauben Sie die Verwendung von Cookies, um sich auf der Website MQL5.com anzumelden.
Bitte aktivieren Sie die notwendige Einstellung in Ihrem Browser, da Sie sich sonst nicht einloggen können.