Elder Ray Confluence
- Göstergeler
- Sürüm: 1.10
- Güncellendi: 29 Ekim 2026
- Etkinleştirmeler: 5

Elder Ray Confluence MT5
Six readings, one confluence score, non-repainting closed-candle signals
Elder Ray Confluence builds on Dr. Alexander Elder’s classic Bull Power / Bear Power study. Instead of reading two histograms by eye and guessing whether a move is real, you get six separate readings that are checked against each other. When enough of them agree, you see it as one clear score and one clear arrow.
Non-repainting
- STRONG BUY / SELL arrows are decided when the candle closes, using closed candles only. Nothing is drawn on the candle that is still forming.
- Once drawn, arrows and divergence lines never move or disappear. Reloading the chart or switching timeframe shows exactly what you saw live.
- Divergence lines appear as soon as a swing is confirmed, two candles after it, and connect the two swing points.
Why confluence
One signal on its own is often noise. A setup is more convincing when several different readings point the same way at the same time, and that agreement is what confluence means.
Elder Ray Confluence does that checking for you:
- It reads six things separately: buyer pressure, seller pressure, the signal-line cross, divergence, trend alignment and momentum.
- It works out how many of them agree with the current direction, and how strongly.
- It shows the result as one confluence score, and draws an arrow only when that score is high enough.
What you see
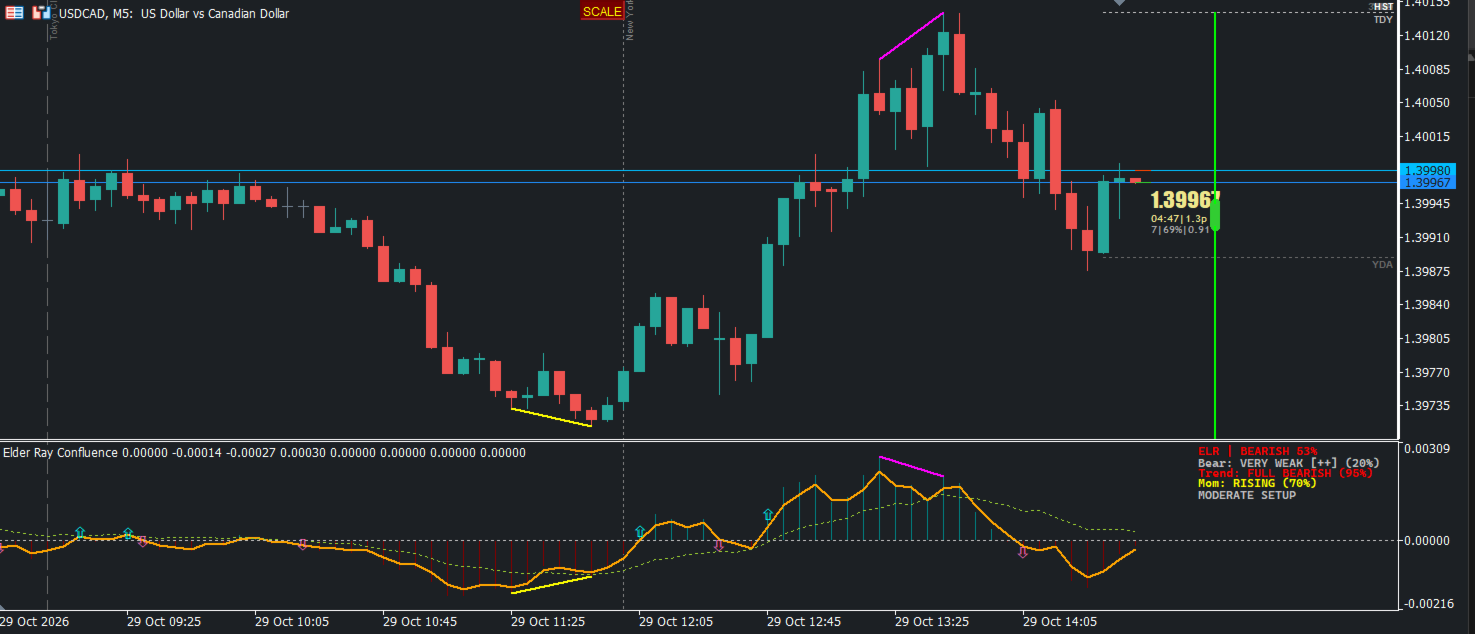
- Elder Ray histogram: teal above zero, maroon below
- Fast signal line (orange) and slow trend line (dotted)
- Divergence lines between confirmed swings, in the indicator window and on the price chart: yellow = bullish, magenta = bearish
- STRONG BUY (aqua) and STRONG SELL (pink) arrows, one arrow per move instead of a cluster
- Live confluence panel inside the indicator window
The confluence panel
Six readings, each with a status and a strength percentage:
- Bull – buyer pressure, with a tag showing whether it is building or fading
- Bear – seller pressure, with the same tag
- Cross – the histogram crossing its fast line, rated weak / normal / strong
- Div – divergence between price and the indicator at confirmed swings
- Trend – how well histogram, fast line and slow line agree (FULL, partial or MIXED)
- Mom – momentum rising, falling or accelerating
Pressure tags: [++] strongly building, [+] building, [=] flat, [-] fading, [--] strongly fading.
The top line shows the overall bias (BULLISH / BEARISH) and the confluence score. The bottom line rates the setup, from WAIT FOR CONFIRMATION up to EXCELLENT ENTRY. The panel follows the forming candle live, so you can watch a setup build. Arrows are only placed once the candle has closed.
How the arrows work
- An arrow is placed when a candle closes with a confluence score at or above the strong signal level (default 75%).
- No second arrow in the same direction appears until the score has closed below the re-arm level (default 65%). You get one arrow per move.
- A qualifying signal in the opposite direction is shown at once.
Main settings
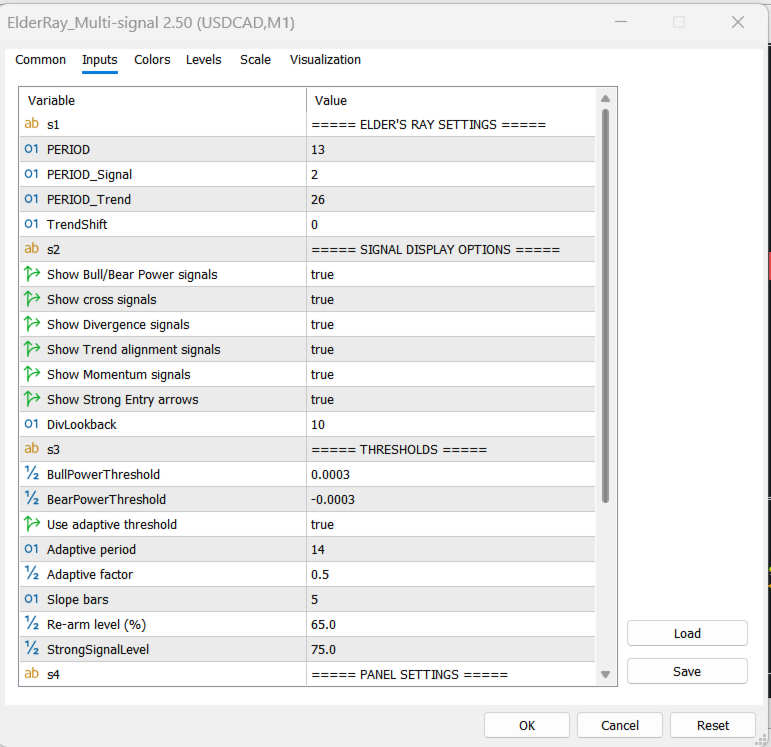
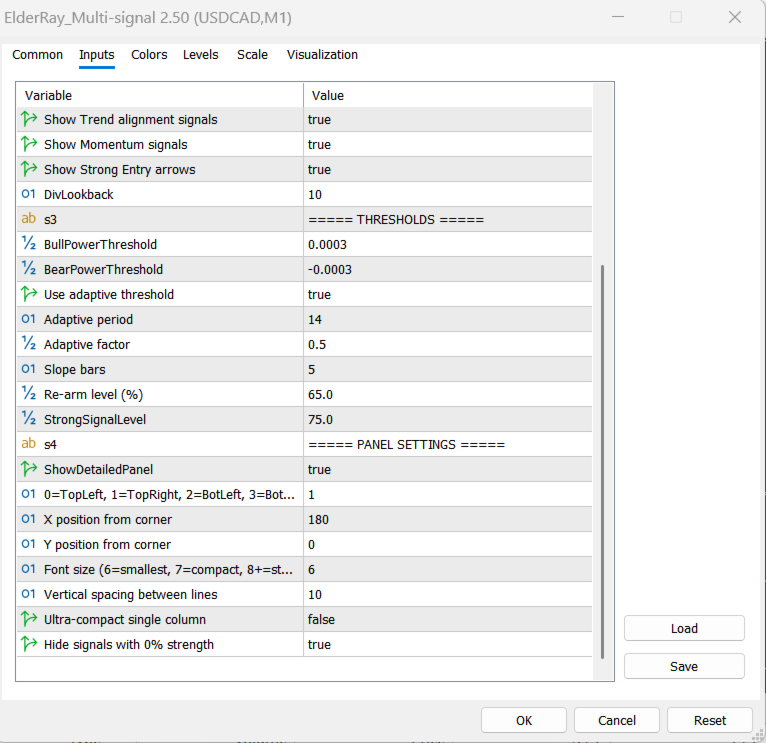
| Setting | Default | What it does |
|---|---|---|
| PERIOD | 13 | Base period |
| PERIOD_Signal | 2 | Fast line period |
| PERIOD_Trend | 26 | Slow line period |
| TrendShift | 0 | Slow line offset, in bars back |
| Show buyer/seller pressure | true | Show or hide the Bull and Bear readings |
| Show cross signals | true | Show or hide the Cross reading |
| Show divergence | true | Show or hide divergence lines and the Div reading |
| Show trend alignment | true | Show or hide the Trend reading |
| Show momentum | true | Show or hide the Mom reading |
| Show strong entry arrows | true | Show or hide STRONG BUY / SELL arrows |
| DivLookback | 10 | How far back the previous swing is searched |
| Divergence lines on price chart | true | Also draw divergence lines on price |
| Bullish / Bearish divergence colour | yellow / magenta | Line colours |
| Divergence lines kept | 100 | Number of recent lines kept on the chart (0 = all) |
| Use adaptive threshold | true | Pressure levels adjust automatically to each symbol and timeframe |
| Adaptive period | 14 | Tunes the adaptive levels |
| Adaptive factor | 0.5 | Tunes the adaptive levels |
| BullPowerThreshold / BearPowerThreshold | 0.0003 / -0.0003 | Fixed levels, used only when adaptive threshold is off |
| Slope bars | 5 | Candles used for the building / fading tag |
| StrongSignalLevel | 75 | Confluence score needed for an arrow |
| Re-arm level (%) | 65 | Score the move must drop below before a new same-direction arrow |
| Panel settings | — | Show/hide, corner, X/Y position, font size, line spacing, compact mode, show only active readings |
Good to know
- Works on any symbol and timeframe.
- Hiding a reading also removes it from the confluence score, so you can build the score from only the readings you trust.
- Keep Use adaptive threshold on for metals, indices and JPY pairs. The fixed levels are in price units and suit 5-digit FX pairs.
- Divergence and strong-arrow values are available in the Data Window, so an EA can read them on closed candles.
- The indicator draws on the chart only. It has no pop-up, sound, push or e-mail alerts, and it does not place trades.
Trading involves risk. This indicator is an analysis tool and does not guarantee profit. Test it on a demo account before trading live.