Fan sayfamıza katılın
Öyleyse bir link gönderin -
başkalarının da faydalanmasını sağlayın
- Görüntülemeler:
- 30348
- Derecelendirme:
- Yayınlandı:
- Güncellendi:
-
Bu koda dayalı bir robota veya göstergeye mi ihtiyacınız var? Freelance üzerinden sipariş edin Freelance'e git
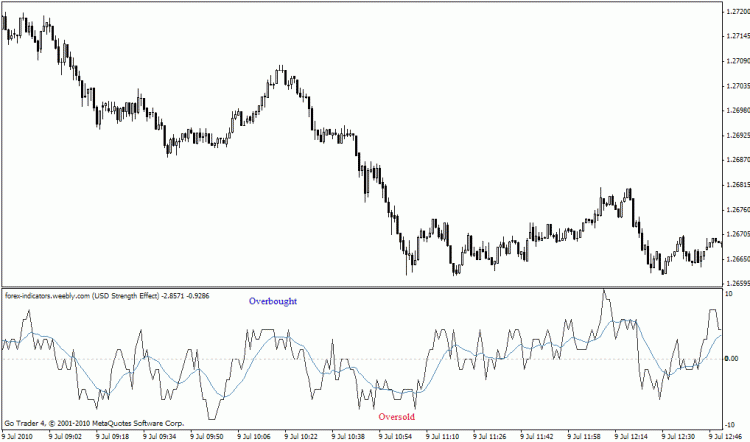
See what effect 7 pairs structured on a single base currency may have on the currency you are trading. Very configurable.
The Indicator assigns a value to each pair depending whether both moving averages are going up or down and a reduced value if the fast ma is moving opposite to the slow ma. There are finite levels with 10 being maximum and -10 being minimum. 10 denotes that your currency is overbought while -10 denotes oversold.
There is a distinction made between a Major pair such as USDCHF (base first) and a Minor pair such as AUDUSD (base last). You can elect 3 major pairs and 4 minor pairs to be used in calculations using the same base currency in all. The defaults work well and you will probably never need to change them.
As an interesting side note, if you wanted to use the AUD as the base currency you could elect three major AUD pairs and 4 minor AUD pairs and you would then get the effect of overall AUD performance. This may be of use if you only traded Tokyo or such.
Works well as a confirming signal to other indicators such as Williams Percent Range etc, and often appears predictive.
You can call the iCustom with the following code line if you want an extra confirmation inside an Expert Advisor or such.
double val=iCustom(NULL, 0, "Brooky_USD_Strength",".",".","USDCHF","USDJPY","USDCAD",".","AUDUSD","EURUSD","GBPUSD","NZDUSD",".",55,34,".",15,".",0,1,0);
Change the 55 and 34 at the end to reflect slow and fast Moving Averages which are used for strength calculations if you want.
if(val>=8) denotes overbought. if(val<=-8) denotes oversold.
 psar bug 3
Opens and closes orders using parabolic SAR
 IFR Trading Page Plotter
Plots price level and open positions from the IFR trading pages provided via the FXNews program offered to accounts registered with OANDA's FXTrade and FXGame platforms.
 Daily Opening EA (needs improvement ideas!)
A slightly different EA based off daily opening breaks.
 RSI Peak & Bottom
It showed the peak/bottom at rsi14
