 MetaTrader 5
 Uzmanlar
 Göstergeler
 Komut dosyaları
 Kütüphaneler
 Depo
Alım-satım robotlarını ücretsiz olarak nasıl indirebileceğinizi izleyin
Bizi Twitter üzerinde bulun!
Fan sayfamıza katılın
Fan sayfamıza katılın
Kodu beğendiniz mi? MetaTrader 5 terminalinde deneyin

Chart Indicators to CSV - MetaTrader 5 için komut dosyası

- Görüntülemeler:
- 46
- Yayınlandı:
-
 Alım-satım fırsatlarını kaçırıyorsunuz:
- Ücretsiz alım-satım uygulamaları
- İşlem kopyalama için 8.000'den fazla sinyal
- Finansal piyasaları keşfetmek için ekonomik haberler
Kayıt Giriş yapWeb sitesi politikasını ve kullanım şartlarını kabul edersiniz
Hesabınız yoksa, lütfen kaydolun -
 Bu koda dayalı bir robota veya göstergeye mi ihtiyacınız var? Freelance üzerinden sipariş edin
Freelance'e git
What it does
Drop Chart Indicators to CSV on a chart. It goes through the main window and every subwindow, takes each indicator on the chart, finds out how many buffers it has, and writes the value of every buffer for the last N bars to a CSV file in the MQL5\Files folder. You do not have to write an iCustom call, know the inputs of the indicator or have its source code; whatever is on the chart is exported.
The file has one row per value, with the indicator, the buffer number, the bar shift, the bar time, the raw value and a flag for EMPTY_VALUE. Typical uses:
- Analysis in a spreadsheet or in Python with pandas: the values of all indicators of a chart side by side, per bar.
- Comparing two versions of an indicator: put both on the chart, export once, and compare the buffers bar by bar. Or export before and after a change and compare the two files.
- Evidence when debugging: the file shows exactly which value each buffer held on each bar at the moment of the export, including EMPTY_VALUE and values that are not drawn, such as calculation buffers.
Because the file lists every buffer with its number, it also shows which buffer number holds which line, which you need when you read a compiled indicator with iCustom and CopyBuffer.
It is a developer tool. It does not trade, does not open or change positions, and gives no signals.
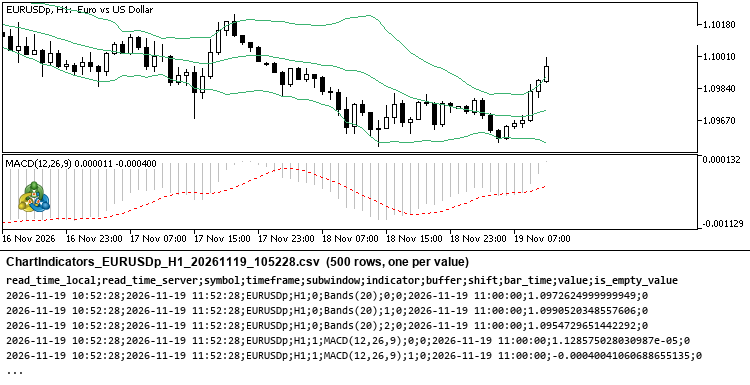
Chart with Bollinger Bands and MACD, and the first rows of the exported file
Inputs
| Input | Default | Meaning |
|---|---|---|
| Bars per buffer | 100 | Number of bars read from every buffer, from 1 to 10000. Other values stop the script with a message in the Experts journal. |
| Include the forming bar (shift 0) | true | true: the bars start at shift 0, the bar that is still forming. false: they start at shift 1, the last closed bar. |
| File name | ChartIndicators_{symbol}_{period}_{time}.csv | Name of the file in MQL5\Files. {symbol}, {period} and {time} are replaced with the chart symbol, the timeframe and the local time (for example ChartIndicators_EURUSD_H1_20261115_190734.csv). A subfolder is allowed (export\macd.csv). The name must stay inside MQL5\Files: no .., no leading \ or /, none of : < > " | ? *. An existing file with the same name is overwritten, and the Experts journal says so. |
| Column separator | Semicolon | Semicolon or comma. |
Output
| Column | Content |
|---|---|
| read_time_local | Local computer time when the indicator was read. |
| read_time_server | Trade server time (TimeTradeServer) when the indicator was read. Empty if the terminal was not connected to the trade server at that moment. |
| symbol | Chart symbol. |
| timeframe | Chart timeframe, for example H1. |
| subwindow | 0 for the main chart window, 1 and up for the subwindows. |
| indicator | Short name of the indicator as the chart shows it, for example MACD(12,26,9). |
| buffer | Buffer number, the number you pass to CopyBuffer. |
| shift | Bar shift, 0 is the newest bar. |
| bar_time | Open time of the bar. |
| value | The raw buffer value as CopyBuffer returns it. |
| is_empty_value | 1 if the value is EMPTY_VALUE, otherwise 0. |
The file is UTF-8 text with Windows line ends. Times are written as 2026-11-15 19:07:34. Numbers use a decimal point and full precision, so a value reads back exactly as the indicator stored it; EMPTY_VALUE appears as 1.7976931348623157e+308. A text field that contains the separator, such as MACD(12,26,9) with the comma separator, is put in double quotes.
How to use it
- Put the indicators you want to export on a chart and wait until they are drawn.
- Drag Chart Indicators to CSV from the Navigator onto that chart, set the inputs and press OK.
- The Experts tab of the Toolbox shows one line per indicator with its number of buffers and rows, and a last line with the full path of the file.
- Open the file in a spreadsheet or text editor, or load it in Python.
To get one column per buffer and one row per bar in pandas:
import numpy as np
import pandas as pd

df = pd.read_csv("ChartIndicators_EURUSD_H1_20261115_190734.csv", sep=";")
df.loc[df["is_empty_value"] == 1, "value"] = np.nan
table = df.pivot(index="bar_time", columns=["subwindow", "indicator", "buffer"], values="value")
To read a buffer you found in the file from your own code:
int handle = iCustom(_Symbol, _Period, "IndicatorName" /*, its inputs */);
double values[];
CopyBuffer(handle, 2 /* buffer number from the file */, 0, 10, values);
How the number of buffers is found
MQL5 has no function that returns the number of buffers of an indicator that another program created. The script reads one value from buffer 0, 1, 2 and so on with CopyBuffer until a read fails, and checks that failure once more after a short pause. Before that it waits up to 5 seconds until the indicator is calculated (BarsCalculated). The number found includes every buffer that CopyBuffer can read: data buffers, color index buffers and calculation buffers. It can therefore be higher than the number of lines on the chart. The limit is 512 buffers, the most an MQL5 indicator can have.
An indicator that is still starting, right after you added it or after the terminal or a template was loaded, can show its file name as short name for a moment and then switch to its final one. The script first waits up to 5 seconds until every indicator on the chart can be found by its short name and is calculated.
The bar times and all buffers of one indicator are read together. If a new bar opens or the indicator recalculates while they are read, the script reads that indicator again, up to five times, so that every value stays on the bar it belongs to.
Every problem goes to the Experts journal with the error code: an indicator that is not calculated in time, a buffer that returns fewer values than asked for, a file that cannot be created or written. The script does not stop silently.
Limits
- MetaTrader 5 only.
- Indicators are read on the chart's own symbol and timeframe.
- Indicators are found by their short name. If two indicators in the same window have the same short name, only the first one can be read; the second one is skipped and named in the Experts journal. This happens, for example, with two Bollinger Bands of the same period and different deviations, because the short name shows only the period. To compare two versions of an indicator, put them in different subwindows or give them different short names.
- The is_empty_value flag only marks EMPTY_VALUE. Some indicators mark "no value" with 0 or another number; those values are written as they are, with the flag 0. The same holds for a NaN or an infinite value: it is written as MQL5 prints it, with the flag 0.
- Short names are written unchanged. A spreadsheet may read a short name that starts with =, +, - or @ as a formula; open the file as text in that case.
- Every row of one indicator has the same read time. The values of the forming bar can change between two runs.
- The file grows with indicators × buffers × bars, by about 100 bytes per row.
 Volatility Regime Indicator (Low, Normal, High) in a Subwindow
Classifies the current market volatility as Low, Normal or High by ranking the ATR against its own recent history. The percent rank is shown as a color-coded histogram in a subwindow, with optional alerts when the regime changes.
Donchian Channel with Breakout Alerts
Donchian Channel (highest high and lowest low of the last N bars) with a middle line, breakout arrows on the chart and alerts by pop-up window, push notification or e-mail when price breaks out of the channel.
Daily Range Budget
Shows how much of the average daily range (ADR) has already been used today, and plots the two prices that today’s high and low could still reach if the day ends with an average range. Shows how much of the average daily range (ADR) has already been used today, and draws the two prices that today’s high and low can still reach if the day ends with an average range.
MACD Signals
Indicator edition for new platform.