 MetaTrader 5
 Uzmanlar
 Göstergeler
 Komut dosyaları
 Kütüphaneler
 Depo
Alım-satım robotlarını ücretsiz olarak nasıl indirebileceğinizi izleyin
Bizi Telegram üzerinde bulun!
Fan sayfamıza katılın
Fan sayfamıza katılın
Kodu beğendiniz mi? MetaTrader 5 terminalinde deneyin

Warm-Up Meter: Measuring Seed Convergence of Recursive Indicators - MetaTrader 5 için gösterge

- Görüntülemeler:
- 21
- Yayınlandı:
-
 Alım-satım fırsatlarını kaçırıyorsunuz:
- Ücretsiz alım-satım uygulamaları
- İşlem kopyalama için 8.000'den fazla sinyal
- Finansal piyasaları keşfetmek için ekonomik haberler
Kayıt Giriş yapWeb sitesi politikasını ve kullanım şartlarını kabul edersiniz
Hesabınız yoksa, lütfen kaydolun -
 Bu koda dayalı bir robota veya göstergeye mi ihtiyacınız var? Freelance üzerinden sipariş edin
Freelance'e git

Warm-Up Meter: Measuring Seed Convergence of Recursive Indicators
The idea behind it
Part 1 (Equivalence Checker) answered one question: does the incremental calculation of an indicator, as it runs tick by tick, give the same numbers as a calculation from scratch? This part answers the next one: how much history does a recursive indicator need before its numbers can be trusted at all?
EMA, Wilder smoothing (used by RSI, ATR and ADX) and everything built on them are recursive. Each value depends on the previous value, so the first bar needs an invented starting value, the seed. That error is never removed. It only shrinks, by a factor of 1 - alpha on every bar. If an EA, a backtest or a freshly attached indicator starts from too little history, its values carry a part of that invented seed, and the same strategy gives different signals than it does on a chart that has been running for months.
The common rule of thumb is "warm up for period × 3". The Warm-Up Meter measures instead of guessing:
- Three chains run over the same closed bars. Chain A (reference) is seeded far in the past and has converged by the time it reaches the area of interest. Chain B (probe) is seeded half way between A and the seed bar. Chain T (tested) is seeded at the seed bar with the chosen starting value, either the first price or zero.
- The seed bar is placed on the real chart. It sits InpCurveBars bars before the last closed bar, so the curve is drawn on the actual bars: "if I had started my indicator here, how wrong would it be on each bar since?"
- The deviation of T from A is measured on every bar, as a relative error. The measured warm-up is the first bar after which the error never exceeds the tolerance again.
- The reference is checked, not assumed. The deviation of B from A at the seed bar bounds the error still left inside A. If it is larger than a tenth of the tolerance, the result is marked INCONCLUSIVE rather than reported as a number.
- Stacked smoothing is visible. For one stage the error falls as (1 - alpha)^k , which has a closed-form estimate: ln(tolerance / e0) / ln(1 - alpha) , where e0 is the error at the seed bar. The panel prints this one-stage estimate next to the measured value. Cascaded stages decay more slowly because every stage passes part of its seed error on to the next one, and the ratio between the two numbers shows how much the stacking costs.
The seeded chain is a cascade of up to three recursive stages ( ChainSeed() and ChainStep() in the source). To test your own recursive indicator, replace the body of these two functions with your calculation and keep the state in the array g_st .
Example results on the fixed series (M15, tolerance 1e-6, first-price seed, period 14, one common seed bar), in bars:
| Smoothing | 1 stage | 2 stages | 3 stages |
|---|---|---|---|
| EMA | 70 (5.0 x period) | 87 (6.2 x period) | 102 (7.3 x period) |
| Wilder (RMA) | 133 (9.5 x period) | 168 (12.0 x period) | 197 (14.1 x period) |
With the starting value set to zero (the typical result of an uninitialized buffer), the same three-stage chains need 133 bars (EMA) and 258 bars (Wilder). The numbers depend on the price at the seed bar and on the tolerance, so they change a little from bar to bar. That is why a safety margin is added to the recommendation.
How to interpret it
- Error index histogram (separate window). Each bar after the seed bar shows 17 + log10(relative deviation) , limited to 0..20, the same scale as Part 1. The relative deviation is |seeded - reference| / max(1, |reference|) . For one stage the bars fall in a straight staircase on this logarithmic scale. Cascaded stages start flatter and have a longer tail.
- Bar color. Gray means within tolerance; white means outside.
- Dotted horizontal level marks the tolerance ( 17 + log10(InpTolerance) , which is 11 for the default 1e-6).
- Dotted vertical segment marks the seed bar. Dashed vertical segment marks the measured warm-up, with the label "warm-up N bars". Both segments stop below the text panel. The dashed segment and the label are not drawn when the error has not converged inside the measured range.
- Empty bars. Everything before the seed bar and the forming bar stay empty. The curve ends on the last closed bar and moves one bar to the right when a new bar opens.
- Data Window. Seeded chain and Reference chain show the two calculated values of the bar under the cursor (no lines are drawn).
- Status panel (six lines):
- Smoothing method, number of stages, period, seed mode and data source.
- Seed bar time, error at the seed bar (e0) and tolerance.
- Measured warm-up in bars and in multiples of the period, with the one-stage estimate and the ratio of the two (or "not converged" if the error is still above tolerance at the end of the curve).
- Recommended warm-up: the measured value plus InpSafetyMargin percent.
- The warm-up you use now ( InpWarmupBars ) with the error it leaves, and a check of the guard used by Part 1 (60 × period bars of history before the digest anchor): OK, TOO SHORT or unknown.
- Reference check (conservative bound of the reference's own error, converged or not) and the verdict.
- Verdict. PASS: your warm-up is at least the measured warm-up. FAIL: it is shorter. INCONCLUSIVE: the reference has not converged, or the error has not converged inside the measured range. n/a: not enough history.
- Experts journal. A one-line summary (measured, recommended, one-stage estimate, verdict) is printed when the indicator is removed from a live chart.
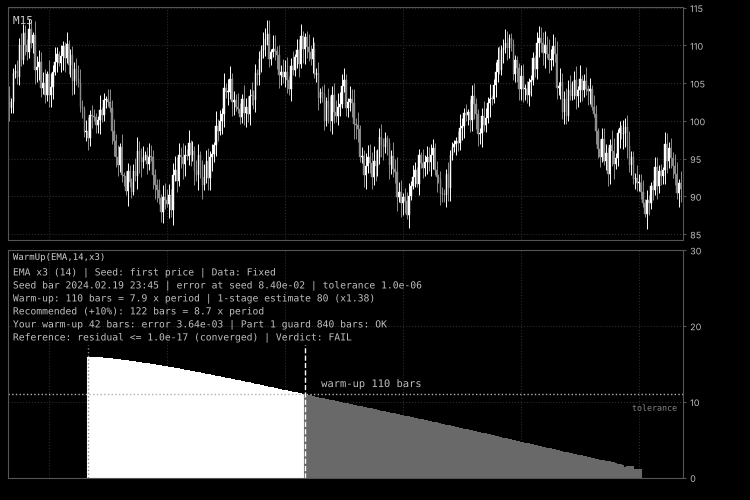
Fig. 1. EMA, 3 stages, period 14 on the fixed M15 series. The histogram shows the error of the chain seeded 300 bars before the last closed bar. White bars are above the 1e-6 tolerance (dotted level); the dashed line marks the measured warm-up of 110 bars, and the 42 bars used by the "period x 3" rule fall well short. Black and white screenshot, per the Code Base image guidelines.
External variables (inputs)
| Input | Default | Purpose |
|---|---|---|
| InpSmoothing | EMA | Smoothing method of every stage: EMA (alpha = 2 / (period + 1)) or Wilder smoothing (alpha = 1 / period). |
| InpPeriod | 14 | Smoothing period. Values are limited to 2..1000. |
| InpStages | 3 | Number of cascaded smoothing stages, 1..3. The output of a stage is the input of the next one. |
| InpDataset | Fixed synthetic series | Data source: the fixed series (a function of bar open time, identical to Part 1) or the chart close prices. |
| InpSeedMode | First price of the series | Starting value of the tested chain: the price of the seed bar, or zero (an uninitialized buffer). |
| InpCurveBars | 300 | Bars measured after the seed bar. Must be larger than the expected warm-up, otherwise the result is "not converged". Limited to 50..5000. |
| InpReferenceBars | 3000 | Bars of reference history before the seed bar. If the reference has not converged, increase it. Limited to 50..50000. |
| InpTolerance | 1.0e-6 | Relative tolerance. For a price near 1.1 it is about 0.01 pip. Limited to 1e-12..1e-2. |
| InpWarmupBars | 42 | The warm-up you use now, in bars. The default is 3 times the default period. |
| InpSafetyMargin | 10 | Percent added to the measured warm-up to get the recommendation. Limited to 0..200. |
| InpShowMarkers | true | Draw the seed bar segment, the warm-up segment and its label. |
| InpShowPanel | true | Show or hide the status panel. |
| InpTextColor | clrSilver | Color of the panel and label text. |
Recommended use
- Place in the series. Run Part 1 first to confirm the state handling of your calculation, then this indicator to size the warm-up. The panel checks the guard used by Part 1 (a digest anchor needs 60 × period bars of history before it), so you can see whether that constant is enough for a given configuration.
- Using the number. Use the recommended warm-up as the minimum number of bars an EA or indicator must calculate before its first signal, and as the minimum history to request before starting a backtest.
- Setting the range. Choose InpCurveBars larger than the warm-up you expect, and zoom the chart out so that the whole curve is visible. Choose InpReferenceBars several times larger than the warm-up. If the panel says "NOT converged" for the reference, increase it and make sure enough history is loaded on the chart. Slow combinations, such as Wilder smoothing with a long period and three stages, can need thousands of bars.
- Window size. The vertical scale is fixed at 0..30 and the bars use 0..20, so the top part of the window is free for the text panel. Make the indicator window about 250 pixels high (drag its upper border) so the six panel lines stay above the bars; in a smaller window the text overlaps the histogram.
- Fixed or chart data. The fixed series is the same on every symbol and broker, but it depends on the timeframe because it is a function of the bar open time. Use it for comparable results; use the chart data to measure the effect on the price series you actually trade. On a flat series there is nothing to converge: with the first-price seed the warm-up is 0.
- Zero seed. Set InpSeedMode to zero to see how long a missing initialization contaminates the output.
- Tolerance. The default 1e-6 suits price-like values. Tighten it when your signals depend on small differences, or when the indicator output is compared with an external reference.
- What the number means. The warm-up depends on the price at the seed bar, so it changes slightly from bar to bar, and it measures the decay of the seed error only. It does not prove that the formula itself is correct (compare against an independent implementation for that), and it assumes the decay of a linear recursive filter. For non-linear recursive logic (conditions, resets, ZigZag-like state) adapt ChainStep() and read the curve, but do not expect the one-stage estimate to apply.
- Cost. The measurement runs once on each new bar, and runs the three chains (about 5100 recursion steps per stage with the default inputs). Ticks of the forming bar only refresh the source series and return at once, because closed bars cannot change. With the largest allowed settings a new bar still means roughly 85000 steps per stage.
- Short history. The panel shows "Not enough history" until the chart holds at least InpCurveBars + 12 bars.
- Strategy Tester. Run it in visual mode. The tester does not call OnDeinit() for indicators, so the summary line is printed only on a live chart.
- Chart theme. The failure bars are white, so use a dark chart template or change the plot colors in the Colors tab.
- Account types. The indicator does not trade and does not depend on netting or hedging accounts.
 Risk Percent Lot Size Calculator
Script that calculates the lot size for a given risk percent and stop loss. Places no orders.
Session Range Boxes with Asia Breakout Alert
Draws Asia, London and New York session boxes with high/low range and an optional Asia breakout alert.
Accelerator Oscillator (AC)
The Acceleration/Deceleration Indicator (AC) measures acceleration and deceleration of the current driving force.
MACD Signals
Indicator edition for new platform.