 MetaTrader 5
 Uzmanlar
 Göstergeler
 Komut dosyaları
 Kütüphaneler
 Depo
Alım-satım robotlarını ücretsiz olarak nasıl indirebileceğinizi izleyin
Bizi Telegram üzerinde bulun!
Fan sayfamıza katılın
Fan sayfamıza katılın
Kodu beğendiniz mi? MetaTrader 5 terminalinde deneyin

- Görüntülemeler:
- 76
- Yayınlandı:
-
 Alım-satım fırsatlarını kaçırıyorsunuz:
- Ücretsiz alım-satım uygulamaları
- İşlem kopyalama için 8.000'den fazla sinyal
- Finansal piyasaları keşfetmek için ekonomik haberler
Kayıt Giriş yapWeb sitesi politikasını ve kullanım şartlarını kabul edersiniz
Hesabınız yoksa, lütfen kaydolun -
 Bu koda dayalı bir robota veya göstergeye mi ihtiyacınız var? Freelance üzerinden sipariş edin
Freelance'e git

The indicator plots Bollinger bands and a Keltner channel in the chart window and marks the periods when the Bollinger bands lie completely inside the Keltner channel. This condition is commonly called a volatility squeeze. An orange dot is drawn at the Bollinger middle line on every bar where the squeeze is on.
When the squeeze was on at the previous bar and is off at the current one, the indicator draws a release arrow. The direction is taken from momentum: the last closed bar's close is compared with the close MomLookback bars before it. A higher close gives an up arrow below the bar, a lower close gives a down arrow above the bar, and no arrow is drawn when the two closes are equal.
All values on a bar are calculated from the bars before it, so the lines, dots and arrow direction of the current bar do not change while it is forming. The Bollinger bands use a simple moving average and the population standard deviation of closes. The Keltner middle line is an EMA of closes and its width is a multiple of a Wilder-smoothed ATR. Both are calculated inside the indicator and may differ slightly from the built-in indicators at the start of the history.
Input parameters
- BBPeriod - Bollinger bands period (default 20).
- BBDev - Bollinger bands deviation multiplier (default 2.0).
- KCPeriod - period of the Keltner middle line EMA (default 20).
- KCMultATR - Keltner channel half-width as a multiple of the ATR (default 1.5).
- ATRPeriod - ATR period (default 14).
- MomLookback - number of bars used for the momentum comparison that sets the arrow direction (default 4).
- ShowArrows - show the release arrows (default true).
Buffers: 0 and 1 - Bollinger upper and lower, 2 and 3 - Keltner upper and lower, 4 - squeeze dots, 5 - release up, 6 - release down. The empty value of the plots is 0. The indicator does not place or manage trades.
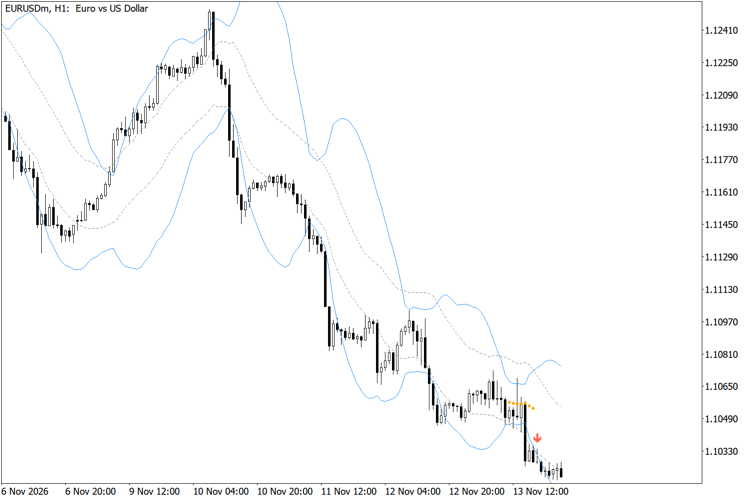
Bollinger and Keltner squeeze dots with release arrows on EURUSD H1
 Confirmed Swing Pivots with Trend MA
Marks swing highs and lows that are confirmed by a fixed number of bars on both sides and plots a simple moving average for trend context.
Donchian Breakout Channel with ATR Trailing Stop
Plots a Donchian channel built from closed bars, arrows after a close outside the channel and a two-colour ATR trailing stop line that follows the breakout direction.
RSI Pullback Zones Above Rising SMA
Plots a long-period SMA and marks bars where the RSI has pulled back to a set level while the price is still above the rising SMA.
Trend Filtered Donchian Breakout Channel
Plots a Donchian channel and a long-period SMA and marks only those closed-bar channel breakouts that are on the same side of the SMA.