 MetaTrader 5
 Uzmanlar
 Göstergeler
 Komut dosyaları
 Kütüphaneler
 Depo
Alım-satım robotlarını ücretsiz olarak nasıl indirebileceğinizi izleyin
Bizi Facebook üzerinde bulun!
Fan sayfamıza katılın
Fan sayfamıza katılın
Kodu beğendiniz mi? MetaTrader 5 terminalinde deneyin

Equivalence Checker: Regression Testing for MQL5 Indicators - MetaTrader 5 için gösterge

- Görüntülemeler:
- 43
- Derecelendirme:
- Yayınlandı:
-
 Alım-satım fırsatlarını kaçırıyorsunuz:
- Ücretsiz alım-satım uygulamaları
- İşlem kopyalama için 8.000'den fazla sinyal
- Finansal piyasaları keşfetmek için ekonomik haberler
Kayıt Giriş yapWeb sitesi politikasını ve kullanım şartlarını kabul edersiniz
Hesabınız yoksa, lütfen kaydolun -
 Bu koda dayalı bir robota veya göstergeye mi ihtiyacınız var? Freelance üzerinden sipariş edin
Freelance'e git

Equivalence Checker: Regression Testing for MQL5 Indicators
The idea behind it
A custom indicator runs in two very different ways. When it is attached, OnCalculate() processes the whole history in one pass. After that it works incrementally: prev_calculated tells it that only the last bar needs work, and the same live bar is recalculated again on every tick. Most indicator bugs live in the second mode, and the history on the chart looks perfect because it was produced by the first one. Typical examples are adding the same value to a running sum on every tick, starting a recalculation from stale state after a new bar opens, and numerical drift in long running sums.
This indicator turns that problem into a repeatable test with four parts:
- Two independent paths. The incremental path ( CalcIncremental() ) is the code under test. It keeps its state in buffers and recalculates the live bar from the committed state of the previous bar. The reference path recomputes the same values from scratch: direct summation of the window for the SMA, and a separately stored recursion chain for EMA and Wilder smoothing.
- Tick-by-tick comparison. The live bar is compared on every OnCalculate() call. The incremental path repairs itself when a bar closes, so a defect that only shows on repeated ticks would vanish from the history. The indicator therefore remembers the worst deviation seen on each live bar and merges it into that bar when it closes.
- A fixed dataset. In DATASET_FIXED mode the input series is a pure function of the bar open time, so the test data is the same on every symbol, broker and terminal. Results become comparable from one version of your code to the next.
- A regression digest. A 32-bit FNV-1a hash is computed over the incremental values of a window anchored at a fixed bar time, rounded to 6 decimals. Save it once as a golden value, change your code, and the digest tells you whether the output changed.
To prove that the checker can actually fail, two defects can be injected on purpose ( InpFault ): accumulating on every tick of the live bar, and storing the state with 32-bit float precision. A test that has never failed has never been tested.
The test subjects are an SMA built on a running sum, an EMA, and Wilder smoothing (RMA). To test your own indicator, replace the body of CalcIncremental() with your logic (keep the state in buffers) and replace the reference loop in OnCalculate() with an independent from-scratch calculation.
How to interpret it
- Error index histogram (separate window, scale 0 to 20). Each bar shows 17 + log10(relative deviation) , limited to the range 0..20. The relative deviation is |incremental - reference| / max(1, |reference|) . A value of 0 is an exact match (1e-17 or better), 8 is about 1e-9, and 20 is a deviation of 1000 or more.
- Bar color. Gray means the bar is within tolerance; white means it is outside. The color is decided by the real deviation, not by the plotted height.
- Dotted horizontal level marks the tolerance ( 17 + log10(InpTolerance) ). With the default 1e-9 it sits at 8.
- Last bar. It shows the worst deviation observed so far on the live bar. Closed bars keep the worst deviation seen during their live phase, merged with the deviation measured at close.
- Data Window. Incremental and Reference show the two calculated values for the bar under the cursor (no lines are drawn).
- Status panel (six text lines in the indicator window):
- Subject, period, data source and the injected fault.
- Closed bars checked and how many failed.
- Live checks (one per OnCalculate() call) and how many failed.
- Worst relative deviation ever seen, next to the tolerance.
- Regression digest and regression status (report only, PASS, FAIL, waiting, off, or no history before anchor).
- Verdict: FAIL if any closed bar, any live check or the regression digest failed; otherwise PASS.
- Experts journal. The digest line is printed once the digest window is closed. A one-line summary is printed when the indicator is removed from a chart.
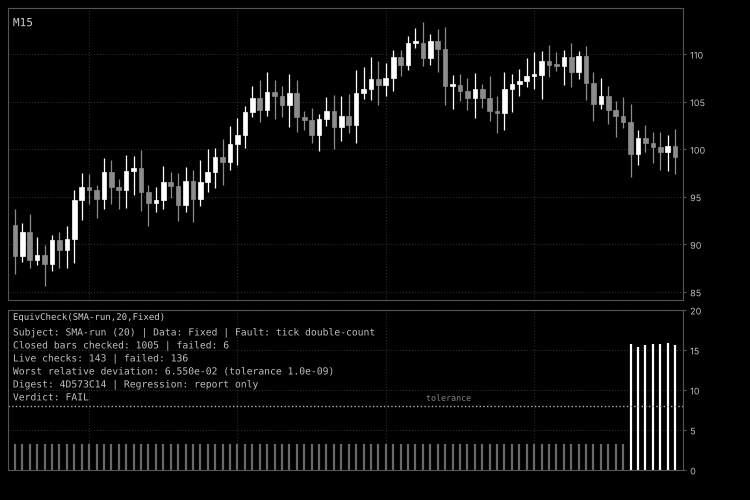
Fig. 1. SMA (running sum) on the fixed dataset with the "Accumulate on every tick of the live bar" fault enabled. Bars verified at start stay gray; bars that received repeated ticks rise above the dotted tolerance level and turn white. Black and white screenshot, per the Code Base image guidelines.
External variables (inputs)
| Input | Default | Purpose |
|---|---|---|
| InpSubject | SMA (running sum) | Algorithm under test: SMA with a running sum, EMA, or Wilder smoothing (RMA). |
| InpPeriod | 20 | Averaging period. Values are limited to 2..5000. |
| InpDataset | Fixed synthetic series | Data source: the fixed series (a function of bar open time) or the chart close prices. |
| InpTolerance | 1.0e-9 | Relative tolerance. Larger deviations are counted as failures. Limited to 1e-15..1e-3. |
| InpVerifyBars | 1000 | Number of bars verified from scratch when the indicator is attached or the history is recalculated. Limited to 50..100000. |
| InpFault | None (normal operation) | Deliberate defect for proving the checker: accumulate on every tick of the live bar, or store the state with float (32-bit) precision. |
| InpAnchorTime | 2024.01.02 00:00 | Open time of the first bar of the digest window. Set it to 0 to switch the digest off. |
| InpDigestBars | 200 | Length of the digest window in bars. The window must be completely closed. |
| InpGoldenDigest | (empty) | Expected digest as 8 hex digits. Empty means report only; otherwise the status becomes PASS or FAIL. |
| InpShowPanel | true | Show or hide the status panel. |
| InpTextColor | clrSilver | Color of the panel text. |
Recommended use
- Normal run. Attach it with the default fixed dataset to any liquid symbol. The values do not depend on the symbol, but the live-bar checks need ticks, so use a symbol with frequent quotes. Choose the timeframe you want to test, because the fixed series is a function of that timeframe's bar open times.
- Prove the checker. Set InpFault to the tick double-count defect and watch the live bar turn white. After a few bars close, the history shows which bars were affected. The float32 defect fails immediately.
- Strategy Tester. The indicator contains tester_everytick_calculate , so it is calculated on every tick in the tester. Run it in visual mode. Note that the tester does not call OnDeinit() for indicators, so the removal summary is only printed on a live chart; the digest line is printed in both cases.
- Regression workflow. Run your indicator version 1 with the fixed dataset and copy the digest from the journal or panel into InpGoldenDigest . After every change to your code, run again on the same terminal, symbol and timeframe: PASS means the output over the digest window is unchanged (to 6 decimals).
- Digest limits. The digest needs at least 60 periods of loaded history before the anchor so that recursive algorithms forget their seed, and the whole window must be closed. Otherwise the panel shows pending or n/a. It depends on which bars exist, so compare runs on the same broker server and timeframe, not across brokers. With the chart dataset it also depends on the broker's quotes.
- What the reference proves. For EMA and RMA the reference uses the same formula and the same seed (the first loaded bar) as the incremental path. The test therefore verifies state handling, tick recalculation and numerical behavior, not the formula itself. For the formula, compare against an independent implementation, for example in Python, or replace the reference.
- Counting. A "live check" is one OnCalculate() call on the forming bar. The terminal may merge fast ticks, so the count can be lower than the number of ticks received.
- Performance. The first calculation is linear in the number of bars. Each tick afterwards costs about one pass over the period for the SMA reference and a constant amount for EMA and RMA.
- Chart theme. Failure bars are white, so use a dark chart template or change the plot colors in the Colors tab.
- Account types. The indicator does not trade and does not depend on netting or hedging accounts.
 Smart Break-Even and Partial Close - R-based trade manager
Trade manager for manual trades and other EAs: moves the stop to break-even at a chosen R multiple, closes part of the position at a second target, then trails the stop in steps. Survives terminal restarts.
Prop Firm Equity Guard - daily loss and max drawdown protection
Account-wide protection for prop firm and funded accounts: enforces a daily loss limit and a maximum overall loss (FTMO-style), closes all positions and blocks new trades when a limit is hit, with an optional profit target.
True Trading Cost - Net Risk Reward Calculator for MT5
Free MT5 chart planner with draggable entry, stop and target levels, spread, risk-based lots, fees, estimated swap, break-even and net risk/reward. Indicator only; no orders.
MACD Signals
Indicator edition for new platform.