 MetaTrader 5
 Uzmanlar
 Göstergeler
 Komut dosyaları
 Kütüphaneler
 Depo
Fan sayfamıza katılın

Trend Regime Indicator - MetaTrader 5 için gösterge

-
🤖 EXPERT ADVISORS
► Awesome Oscillator Pullback EA for EURUSD:
https://www.mql5.com/en/code/78891
► Stochastic Daily Breakout for Gold:
- Görüntülemeler:
- 129
- Derecelendirme:
- Yayınlandı:
-
 Alım-satım fırsatlarını kaçırıyorsunuz:
- Ücretsiz alım-satım uygulamaları
- İşlem kopyalama için 8.000'den fazla sinyal
- Finansal piyasaları keşfetmek için ekonomik haberler
Kayıt Giriş yapWeb sitesi politikasını ve kullanım şartlarını kabul edersiniz
Hesabınız yoksa, lütfen kaydolun -
 Bu koda dayalı bir robota veya göstergeye mi ihtiyacınız var? Freelance üzerinden sipariş edin
Freelance'e git
Is the market trending up, trending down or going nowhere, and since when? This indicator answers both questions on every bar. It draws the answer straight onto the price chart, one box for each stretch of a single regime, and keeps the strength of the move in a column window underneath, so one look at any chart tells you which kind of market you are in and how mature it is.
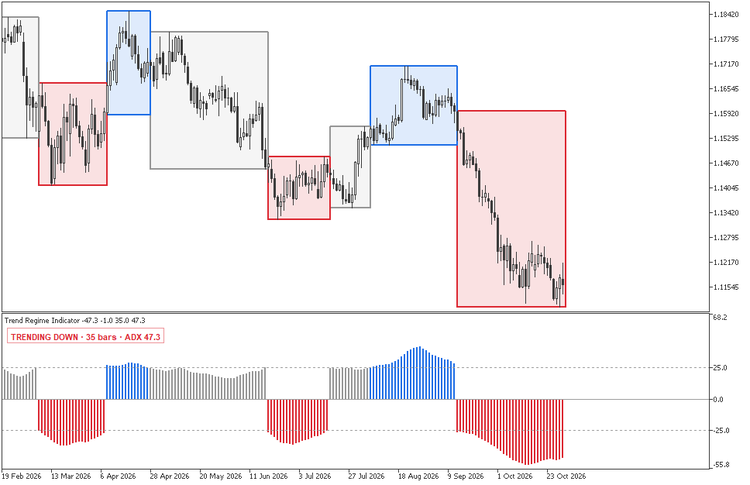
The price chart, boxed by regime
Blue marks a trend up, red a trend down, gray a sideways market. Each box runs from the first bar of its stretch to the first bar of the next one, and from the lowest low to the highest high in between, with a solid outline in the full color and a light fill behind the candles. The fill is blended with your chart background, so it reads just as well on a white chart as on a dark one, and it follows whatever colors you pick.
On the EURUSD daily chart above, the months since February read like a timeline: a drop in March, a rally in April, a long sideways stretch from late April to mid-June, another drop into July, a pause, an August-into-September rally and the fall that began in mid-September. That last box is still open and grows with each new bar while the downtrend holds.
A stretch needs three bars to earn a box. A one- or two-bar flip still shows in the column window, while the price chart stays free of slivers. Both the minimum length and the regimes that get boxes (trends and sideways, trends only, or none) are inputs.
Strength in the window below
Every bar is also a column as tall as its ADX. Trend-up and sideways bars rise above the zero line, trend-down bars hang below it, each in its regime color, with dotted lines at plus and minus the ADX level, 25 by default. A trend gaining strength shows as columns that keep getting longer; one losing steam shows them shrinking back toward the dotted line. The vertical scale fits the visible columns and refits as you scroll or zoom.
In the top left corner, a single line in the regime color gives the regime, how many bars it has lasted and the ADX: TRENDING DOWN · 35 bars · ADX 47.3 on the EURUSD chart. The count starts at 1 on the bar where the regime began. In a sideways market the line adds the reason, weak ADX or quiet ATR.
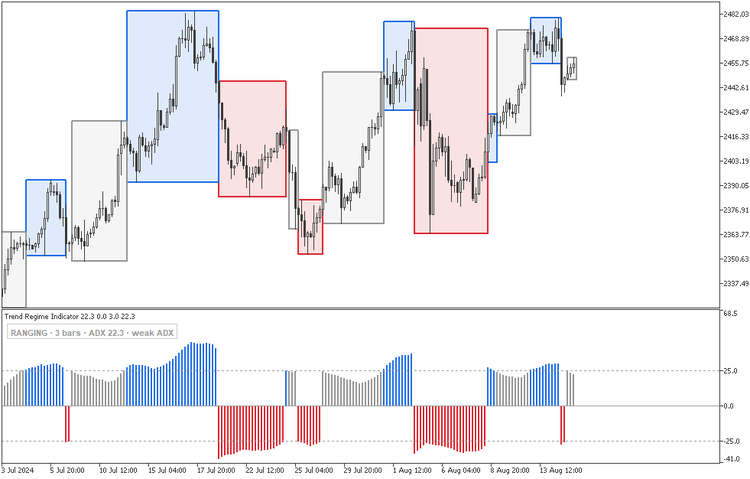
Here are six weeks of gold on H4 in fourteen boxes. The mid-July run above 2,480 sits in one blue box, the slide that followed in a red one, and the sharp drop of early August in another. Twice the regime turned down for only two bars, on July 8 and on August 14: the red columns record it, and no box clutters the price. The last box is three bars old, just long enough to be drawn, and the panel says why the market is sideways: RANGING · 3 bars · ADX 22.3 · weak ADX.
Each regime on the bar that produced it
A regime is drawn on the bar where it was identified, using that bar and the bars before it. Closed bars are calculated once and keep their column, their values and their box, so the history on your chart is exactly what the indicator showed as each bar closed. Only the bar in progress is recalculated, tick by tick, from a copy of the confirmed state.
Defaults set by measurement
The default settings were measured, not guessed. Hundreds of combinations of period, ADX level, ATR filter and smoothing were run over more than ten years of H1 and H4 history on gold, EURUSD and a US stock index, each scored on how early a new regime shows up and how rarely it flips. The settings that came out on top are the defaults: an ADX and DI period of 14, an ADX level of 25, the ATR filter off and a smoothing of 1, so every bar stands on its own reading.
The ATR filter is still one input away. Give the ATR average a period and a bar whose ATR sits at or below that average also counts as sideways, for a stricter reading of quiet markets. The smoothing goes up to 5 bars, averaging the latest readings for a steadier picture.
For Expert Advisors and alerts
Four values per bar sit in the Data Window and can be read with iCustom and CopyBuffer. Buffer 2 is the regime: 1 trend up, 0 sideways, -1 trend down. Buffer 3 counts the bars the regime has lasted, buffer 4 is the ADX, and buffer 0 is the column itself, plus the ADX in a trend up or a sideways market and minus the ADX in a trend down. Buffer 1 holds the color index (0 up, 1 sideways, 2 down). The title line of the indicator window shows the same numbers: -47.3, -1.0, 35.0 and 47.3 on the EURUSD chart. Shift 1 gives the last closed bar.
With those numbers an Expert Advisor can trade only with the trend, wait until a trend has lasted a set number of bars, or stand aside while the market is sideways. The optional alert fires once, when a closed bar starts a new regime, and names the symbol, the timeframe, the new regime, how many bars the previous one lasted and the ADX. Attaching the indicator never triggers it.
Inputs
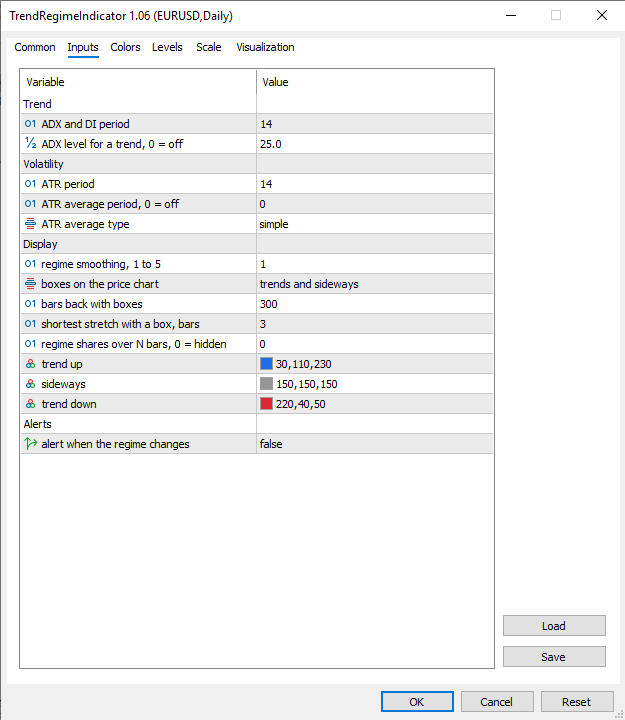
Fourteen settings in four groups. A zero switches off the ADX level, the ATR filter and the share line.
- Trend: ADX and DI period, from 1 to 50 (14); ADX level for a trend (25).
- Volatility: ATR period (14); ATR average period (0, filter off); ATR average type, simple or exponential (simple).
- Display: regime smoothing, from 1 to 5 (1); boxes on the price chart: none, trends only, or trends and sideways (trends and sideways); bars back with boxes (300); shortest stretch with a box, in bars (3); regime shares over N bars, which adds a second panel line with the share of trend-up, sideways and trend-down bars (0, hidden); and the colors of trend up (blue), sideways (gray) and trend down (red), used by the columns, the boxes and the panel.
- Alerts: alert when the regime changes (false).
Works on any symbol and timeframe. The columns live in their own window, the boxes on the price chart, and removing the indicator deletes everything it drew.
Educational content, not financial advice. Trading involves risk of loss.
 After-Exit Analyzer - what price did after you closed: stopped-out trades that later hit TP, profit left after exits
Reads your closed positions and the M1 bars after each exit. Shows how many stopped-out trades later reached their take profit, how far take-profit trades kept running and how much move was left after manual or EA exits. Summary panel, per-position log table and CSV.
 Algo: EMA Trend Cross on Closed Bars — XAUUSD M30
Free educational EA — a single-position trend-following EMA crossover system for XAUUSD M30, released as open source for beginners to study trade ownership guards, preflight order validation, risk-based lot sizing, and server-time session filtering. This code demonstrates how a strategy - identifies and manages only its own positions and orders through MagicNumber and comment tags, - wraps CTrade with an OrderCheck preflight that blocks invalid or margin-breaking requests, - sizes each trade from a fixed stop-loss and risk percentage, - and restricts entries to a configurable broker session window with a daily close-all — all evaluated on completed bars only, so signals never repaint.
Accelerator Oscillator (AC)
The Acceleration/Deceleration Indicator (AC) measures acceleration and deceleration of the current driving force.
MACD Signals
Indicator edition for new platform.