 MetaTrader 5
 Uzmanlar
 Göstergeler
 Komut dosyaları
 Kütüphaneler
 Depo
Fan sayfamıza katılın

Session High Low Alerts - Asia, London and New York session highs and lows with non-repainting break alerts - MetaTrader 5 için gösterge

I build clean, well-tested Expert Advisors and indicators for MetaTrader 4 and 5, with a focus on rule-based strategies and solid risk management.
What I can do for you:
- Görüntülemeler:
- 153
- Derecelendirme:
- Yayınlandı:
-
 Alım-satım fırsatlarını kaçırıyorsunuz:
- Ücretsiz alım-satım uygulamaları
- İşlem kopyalama için 8.000'den fazla sinyal
- Finansal piyasaları keşfetmek için ekonomik haberler
Kayıt Giriş yapWeb sitesi politikasını ve kullanım şartlarını kabul edersiniz
Hesabınız yoksa, lütfen kaydolun -
 Bu koda dayalı bir robota veya göstergeye mi ihtiyacınız var? Freelance üzerinden sipariş edin
Freelance'e git

What it does
For each enabled session the indicator tracks the highest high and lowest low between the session start and end. While the session is running the box grows with price; once it has finished, the high and low are fixed and extended to the end of that server day.
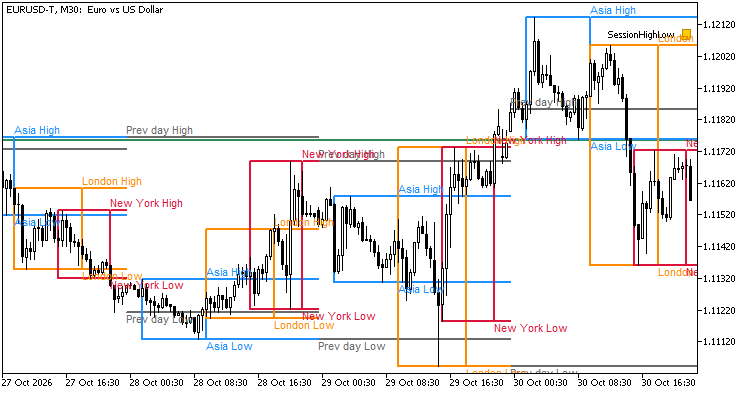
- Three sessions: Asia, London, New York. Each can be switched off, has its own colour, and its own start/end in HH:MM . Sessions that cross midnight are supported.
- Session hours are entered in GMT and shifted by Server time = GMT + N hours . To type the hours directly in server time, set the offset to 0.
- Drawing style: a box over the session plus lines to the end of the day, or lines only. Optional fill and text labels. Objects are drawn only for the last N days (default 10).
- Optional previous day and previous week high/low (server days; the week starts on Monday).
Alerts (no repainting)
- An alert is raised when a closed bar's close is above a session high ("broken up") or below a session low ("broken down"), and only after that session has finished.
- Only closed bars are evaluated, each bar once, so an alert never appears and then disappears.
- One alert per level per day. History is not alerted when the indicator is attached or reloaded.
- Channels: popup ( Alert ), push notification, sound file. Previous day / week levels are alerted only if you switch that on.
Buffers for Expert Advisors (iCustom)
| Buffer | Content |
|---|---|
| 0 | Asia high |
| 1 | Asia low |
| 2 | London high |
| 3 | London low |
| 4 | New York high |
| 5 | New York low |
| 6 | Previous day high |
| 7 | Previous day low |
| 8 | Previous week high |
| 9 | Previous week low |
Session buffers (0-5) are EMPTY_VALUE while the session is running and before it. From the first bar that opens at or after the session end until the end of that server day they hold the session high / low, so reading shift 1 gives the level that is valid for the last closed bar. Buffers 6-9 hold the previous day / week extremes during the current day / week. All buffers are filled even if the corresponding drawing is switched off. The plots are DRAW_NONE , so the buffers do not draw anything on the chart; the values appear in the Data Window.
Example (EA side), reading the London high of the last closed bar:
int h = iCustom(_Symbol, PERIOD_M15, "SessionHighLow");
double v[1];
if(CopyBuffer(h, 2, 1, 1, v) == 1 && v[0] != EMPTY_VALUE)
   Print("London high: ", v[0]);
Passing only the indicator name uses the default inputs.
Inputs
- Server time = GMT + this many hours (default 2).
- For each session: enable, start, end (GMT), colour. Defaults: Asia 00:00-08:00, London 08:00-16:30, New York 13:30-20:00.
- Previous day / week: show, colours.
- Look: style (box + lines / lines), fill, labels, days to draw, line width.
- Alerts: popup, push, sound and file name, also alert on previous day / week.
Notes
- Timeframes above H1 are rejected with a message in the Experts tab. A bar belongs to a session when its open time is inside the session.
- The server offset is fixed by you. If your broker changes its offset with daylight saving time, adjust the input (or the hours) when that happens; historical bars are not shifted automatically.
- Days and weeks follow the broker server time.
- Not financial advice; it only marks levels and reports breaks that already happened.
Testing
Checked in the Strategy Tester (EURUSD M15, September 2026, broker data) against an independent calculation from raw rates: the session levels and the previous day / week high and low matched on every bar compared, buffer values read live on each closed bar were identical to the final values (no repainting), and the session break alerts raised were exactly the ones expected from the raw data.
Candle Pattern Stats - engulfing, pin bar and inside bar with a rolling historical hit rate
Marks bullish and bearish engulfing, bullish and bearish pin bar and inside bar patterns with arrows, using closed bars only, so nothing repaints. The definitions (wick and body proportions, minimum bar size in ATR) are inputs, with an optional EMA trend filter. For each pattern a small panel shows a rolling historical statistic: the share of the last N resolved cases where price moved X ATR in the pattern direction before moving Y ATR against it, together with the number of cases. X, Y, N and the waiting time are inputs. The numbers describe what happened on your chart history; they do not predict the next trade. Optional alerts on closed bars (popup, push, sound). 20 buffers (signal, hit rate and sample size per pattern) can be read with iCustom(). Uses prev_calculated, deletes its chart objects when removed. Read-only: it never trades. No DLLs, no web requests.
 Daily Loss Guard - daily loss and total drawdown limits for funded / prop-firm accounts
Utility Expert Advisor that watches the account equity against two limits: a maximum daily loss and a maximum total drawdown. Each limit can be set as a percentage or as a money amount, and the daily loss can be measured from the balance or from the equity at the start of the day, as many prop firms do. When a limit is touched the EA closes all positions, deletes all pending orders and keeps the account locked until the next trading day: anything opened in the meantime, by another EA or by hand, is closed again. Optional early warning at a percentage of the limit (Alert and push), a small on-chart panel, a magic number / symbol filter, a configurable day-reset time and retries when a close fails. The state is stored in terminal global variables, so a restart does not unlock the account. Works on hedging and netting accounts. No DLLs, no web requests. It never opens trades (only the optional Strategy Tester demo mode does).
ORB Box + VWAP Stats - opening range box, 1R/2R targets, session VWAP and historical break statistics
Draws the opening range of a configurable session (start time and length in minutes, with a server time zone adjustment), the 1R and 2R levels above and below the box, and the session VWAP (tick volume, or real volume when the broker provides it). A small panel counts, over the last N finished sessions, how many broke the range up only, down only, on both sides, or not at all, and how often price reached 1R and 2R after the first break. The statistics are historical counts: they describe the past and do not predict anything. Only closed bars are used, so nothing repaints; optional popup, push and sound alerts fire once per direction per session when a closed bar closes outside the box. Eight buffers (range, targets, VWAP, break state) can be read from an Expert Advisor with iCustom(). Works on M1 to M30, recalculates only new bars and deletes its chart objects when removed. Read-only: it never trades. No DLLs, no web requests.
Key Levels with Touch Counter - previous day/week/month highs and lows plus round numbers, with touch and sweep counts
Draws the previous day, previous week and previous month high and low, plus automatic round-number levels around the current price. Every level carries a label with how many times price touched it and how many times a bar swept it (pierced the level and closed back on the original side). Counts use closed bars only, so they do not repaint. Optional alerts (popup, push, email, sound) for sweeps and new touches. Touch tolerance is a fraction of ATR or a fixed number of points. The 6 previous-period levels and their touch counts are exposed in 12 indicator buffers for use from an Expert Advisor with iCustom(). Works on any timeframe up to H4. Read-only: it never opens, modifies or closes a trade. No DLLs, no web requests.