 MetaTrader 5
 Uzmanlar
 Göstergeler
 Komut dosyaları
 Kütüphaneler
 Depo
Depo
Fan sayfamıza katılın

Compression Breakout Channels with Buy and Sell Volume - MetaTrader 5 için gösterge

- Görüntülemeler:
- 143
- Derecelendirme:
- Yayınlandı:
-
 Alım-satım fırsatlarını kaçırıyorsunuz:
- Ücretsiz alım-satım uygulamaları
- İşlem kopyalama için 8.000'den fazla sinyal
- Finansal piyasaları keşfetmek için ekonomik haberler
Kayıt Giriş yapWeb sitesi politikasını ve kullanım şartlarını kabul edersiniz
Hesabınız yoksa, lütfen kaydolun -
 Bu koda dayalı bir robota veya göstergeye mi ihtiyacınız var? Freelance üzerinden sipariş edin
Freelance'e git
Bu koda dayalı bir robota veya göstergeye mi ihtiyacınız var? Freelance üzerinden sipariş edin
Freelance'e git
Quiet stretches are where this indicator looks: candles shrink, closes bunch together and the range stops expanding. It spots each compression while it forms, boxes it as a channel once it has lasted long enough, and marks the bar that leaves it. Inside every live channel it also shows how the volume of each bar was traded, buy against sell, so you see whether buying or selling dominated the squeeze before price picks a side.
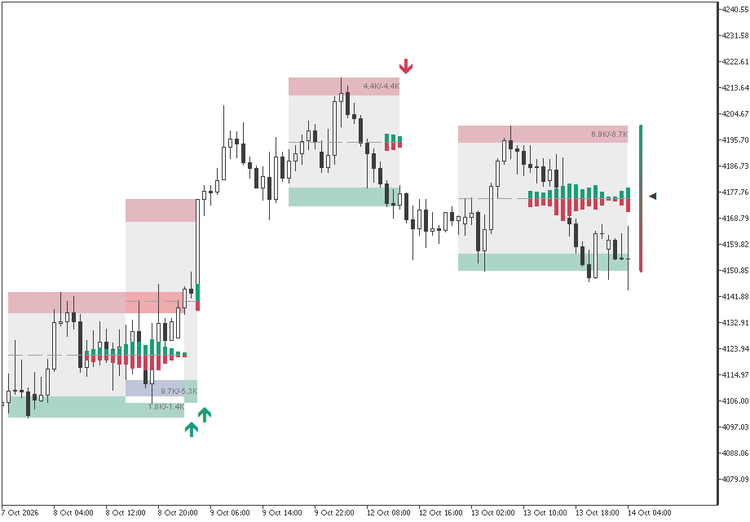
Each channel is a gray box from the highest high to the lowest low of the compression, with a bearish band inside its top edge, a bullish band inside its bottom edge and a dashed midline. The box keeps growing to the right, bar after bar, until price breaks out.
From compression to channel
Every close is placed inside the high-low range of the last 100 bars as a number from 0 to 1, and the indicator follows the standard deviation of that number over 14 bars. Over the detection length, also 14 bars by default, it checks which came last: the highest deviation or the lowest. When the low becomes the more recent of the two, a compression starts. When the high takes over again and the compression has lasted more than ten bars, the channel is drawn over the whole stretch.
The edge bands are half an average true range tall, measured when the channel forms, so their height follows the volatility of the symbol and timeframe. The box sits behind the candles as a 10% tint of the chart's foreground color and the bands as a 30% tint of their own color, which keeps them readable on light and dark themes. With nested channels off, a new compression whose price range overlaps a live channel is skipped; switched on, channels can stack.
The breakout
By default a break needs the midpoint of the candle body beyond the channel edge, which means more than half of the body outside the box: a wick alone never breaks it. Switch that off and the close decides. A bullish break puts an up arrow at the bottom edge of the channel it left, and a bearish break puts a down arrow at the top edge.
A broken channel stops growing and stays on the chart with its midline and its last volume reading, so past compressions remain visible as context. Up to 166 broken channels are kept.
The arrows are indicator buffers, not chart objects: buffer 10 holds the price of the bullish arrow and buffer 11 the bearish one, with EMPTY_VALUE on every other bar. An Expert Advisor can read them through iCustom and CopyBuffer.
Volume inside the channel
The default readout splits the volume of each chart bar into buy and sell using the M1 bars inside it: a rising M1 bar counts as buying, a falling one as selling, and an unchanged one takes its side from its close against the previous M1 close. Volume is the tick volume of the bars. If the source timeframe is not lower than the chart's, the chart bar itself is used.
- Volume candles: drawn from the midline of the newest live channel, buy volume upward and sell volume downward. Height is the volume divided by the 20-bar average volume, times a quarter of the channel height and the candle height setting, so the candles keep their proportion in a narrow channel and in a wide one.
- Volume text: in thousands at the right end of each channel, placed in the band on the opposite side of price, for example 6.9K/-8.7K for buy and sell.
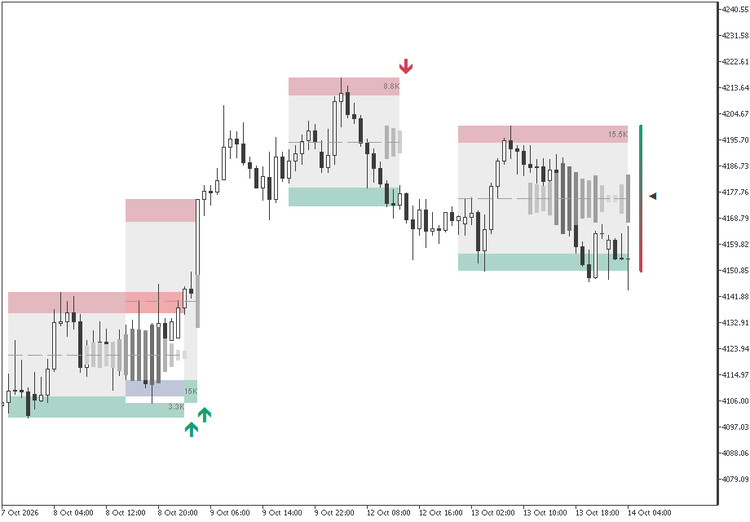
The other two readouts change both the candles and the text. Total volume mirrors one gray candle above and below the midline, darker as the bar's volume grows against its average, and writes a single number. Buy minus sell draws one candle, upward when buying wins and downward when selling wins, and writes the difference. Set the readout to off and the candles and text are removed, while channels, arrows and the gauge stay on the chart.
The delta gauge
To the right of the last bar, a column of 21 segments spans the height of the newest live channel, shading from the bearish color at the bottom to the bullish color at the top. A pointer marks where the current bar's buy minus sell volume sits between the lowest and the highest value seen since the latest compression started: at the top, the bar is the strongest buying bar of the stretch; at the bottom, the strongest selling one. It updates on every tick, and the gauge clears on a bar that breaks a channel.
Alerts
Alerts can be off, on breakouts only, or on breakouts and new channels. Each one is a pop-up sent once, when the bar closes, with the symbol, the timeframe and the event.
Inputs
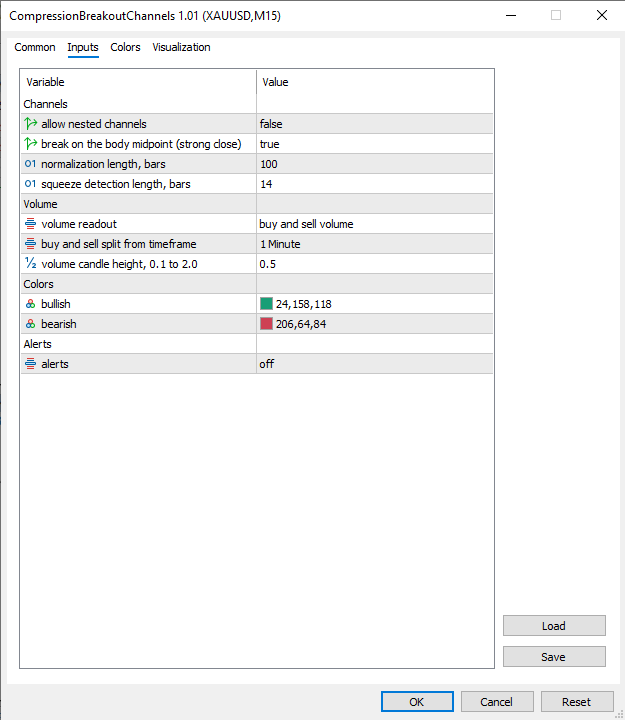
- Channels: allow nested channels (false), break on the body midpoint (true), normalization length (100 bars) and squeeze detection length (14 bars).
- Volume: volume readout (off, total, buy and sell, buy minus sell; buy and sell by default), the timeframe the buy and sell split comes from (1 minute) and the volume candle height (0.5, from 0.1 to 2.0).
- Colors: bullish and bearish. They paint the bands, the arrows, the volume candles and the gauge.
- Alerts: off, breakouts, or breakouts and new channels.
Works on any symbol and timeframe. On load it processes the last 5,000 bars; closed bars are confirmed once, and the bar in progress is recalculated on every tick from a copy of that state, so history never shifts under a forming candle. Removing the indicator deletes everything it drew.
Educational content, not financial advice. Trading involves risk of loss.
 Multi-TF Data Grabber Lite — Free Clean CSV Export (M1/M15/H1 + Indicators)
Free script exporting clean, deterministic OHLC + tick volume + 4 indicators (MA, RSI, MACD, ATR) for M1/M15/H1 to CSV. Closed bars only, zero lookahead — ideal for analysis and ML datasets.
Basket Break-Even Lines - buy, sell and net break-even with target price
Several buys and sells open on one symbol? The indicator draws where all buys, all sells and the whole basket break even, and the price for a profit target. Planned entries can be added to see the break-even before you trade.
Accelerator Oscillator (AC)
The Acceleration/Deceleration Indicator (AC) measures acceleration and deceleration of the current driving force.
MACD Signals
Indicator edition for new platform.