 MetaTrader 5
 Uzmanlar
 Göstergeler
 Komut dosyaları
 Kütüphaneler
 Depo
Depo
Fan sayfamıza katılın

- Görüntülemeler:
- 82
- Derecelendirme:
- Yayınlandı:
-
 Alım-satım fırsatlarını kaçırıyorsunuz:
- Ücretsiz alım-satım uygulamaları
- İşlem kopyalama için 8.000'den fazla sinyal
- Finansal piyasaları keşfetmek için ekonomik haberler
Kayıt Giriş yapWeb sitesi politikasını ve kullanım şartlarını kabul edersiniz
Hesabınız yoksa, lütfen kaydolun -
 Bu koda dayalı bir robota veya göstergeye mi ihtiyacınız var? Freelance üzerinden sipariş edin
Freelance'e git
Bu koda dayalı bir robota veya göstergeye mi ihtiyacınız var? Freelance üzerinden sipariş edin
Freelance'e git
Memory Sequence is a same-symbol multi-chart time-window sync indicator. One chart is the host. Every other chart of that symbol is a slave. The host publishes one candle’s open-to-close window, and every slave draws that window and scrolls it into view. It does not plot its own series (indicator_plots 0). It drives chart objects, chart navigation, and candle colors. Charts talk through terminal global variables plus EventChartCustom (event id 222). No DLL.
This indicator is purposed for those who plan to review a specific moment in price action history.
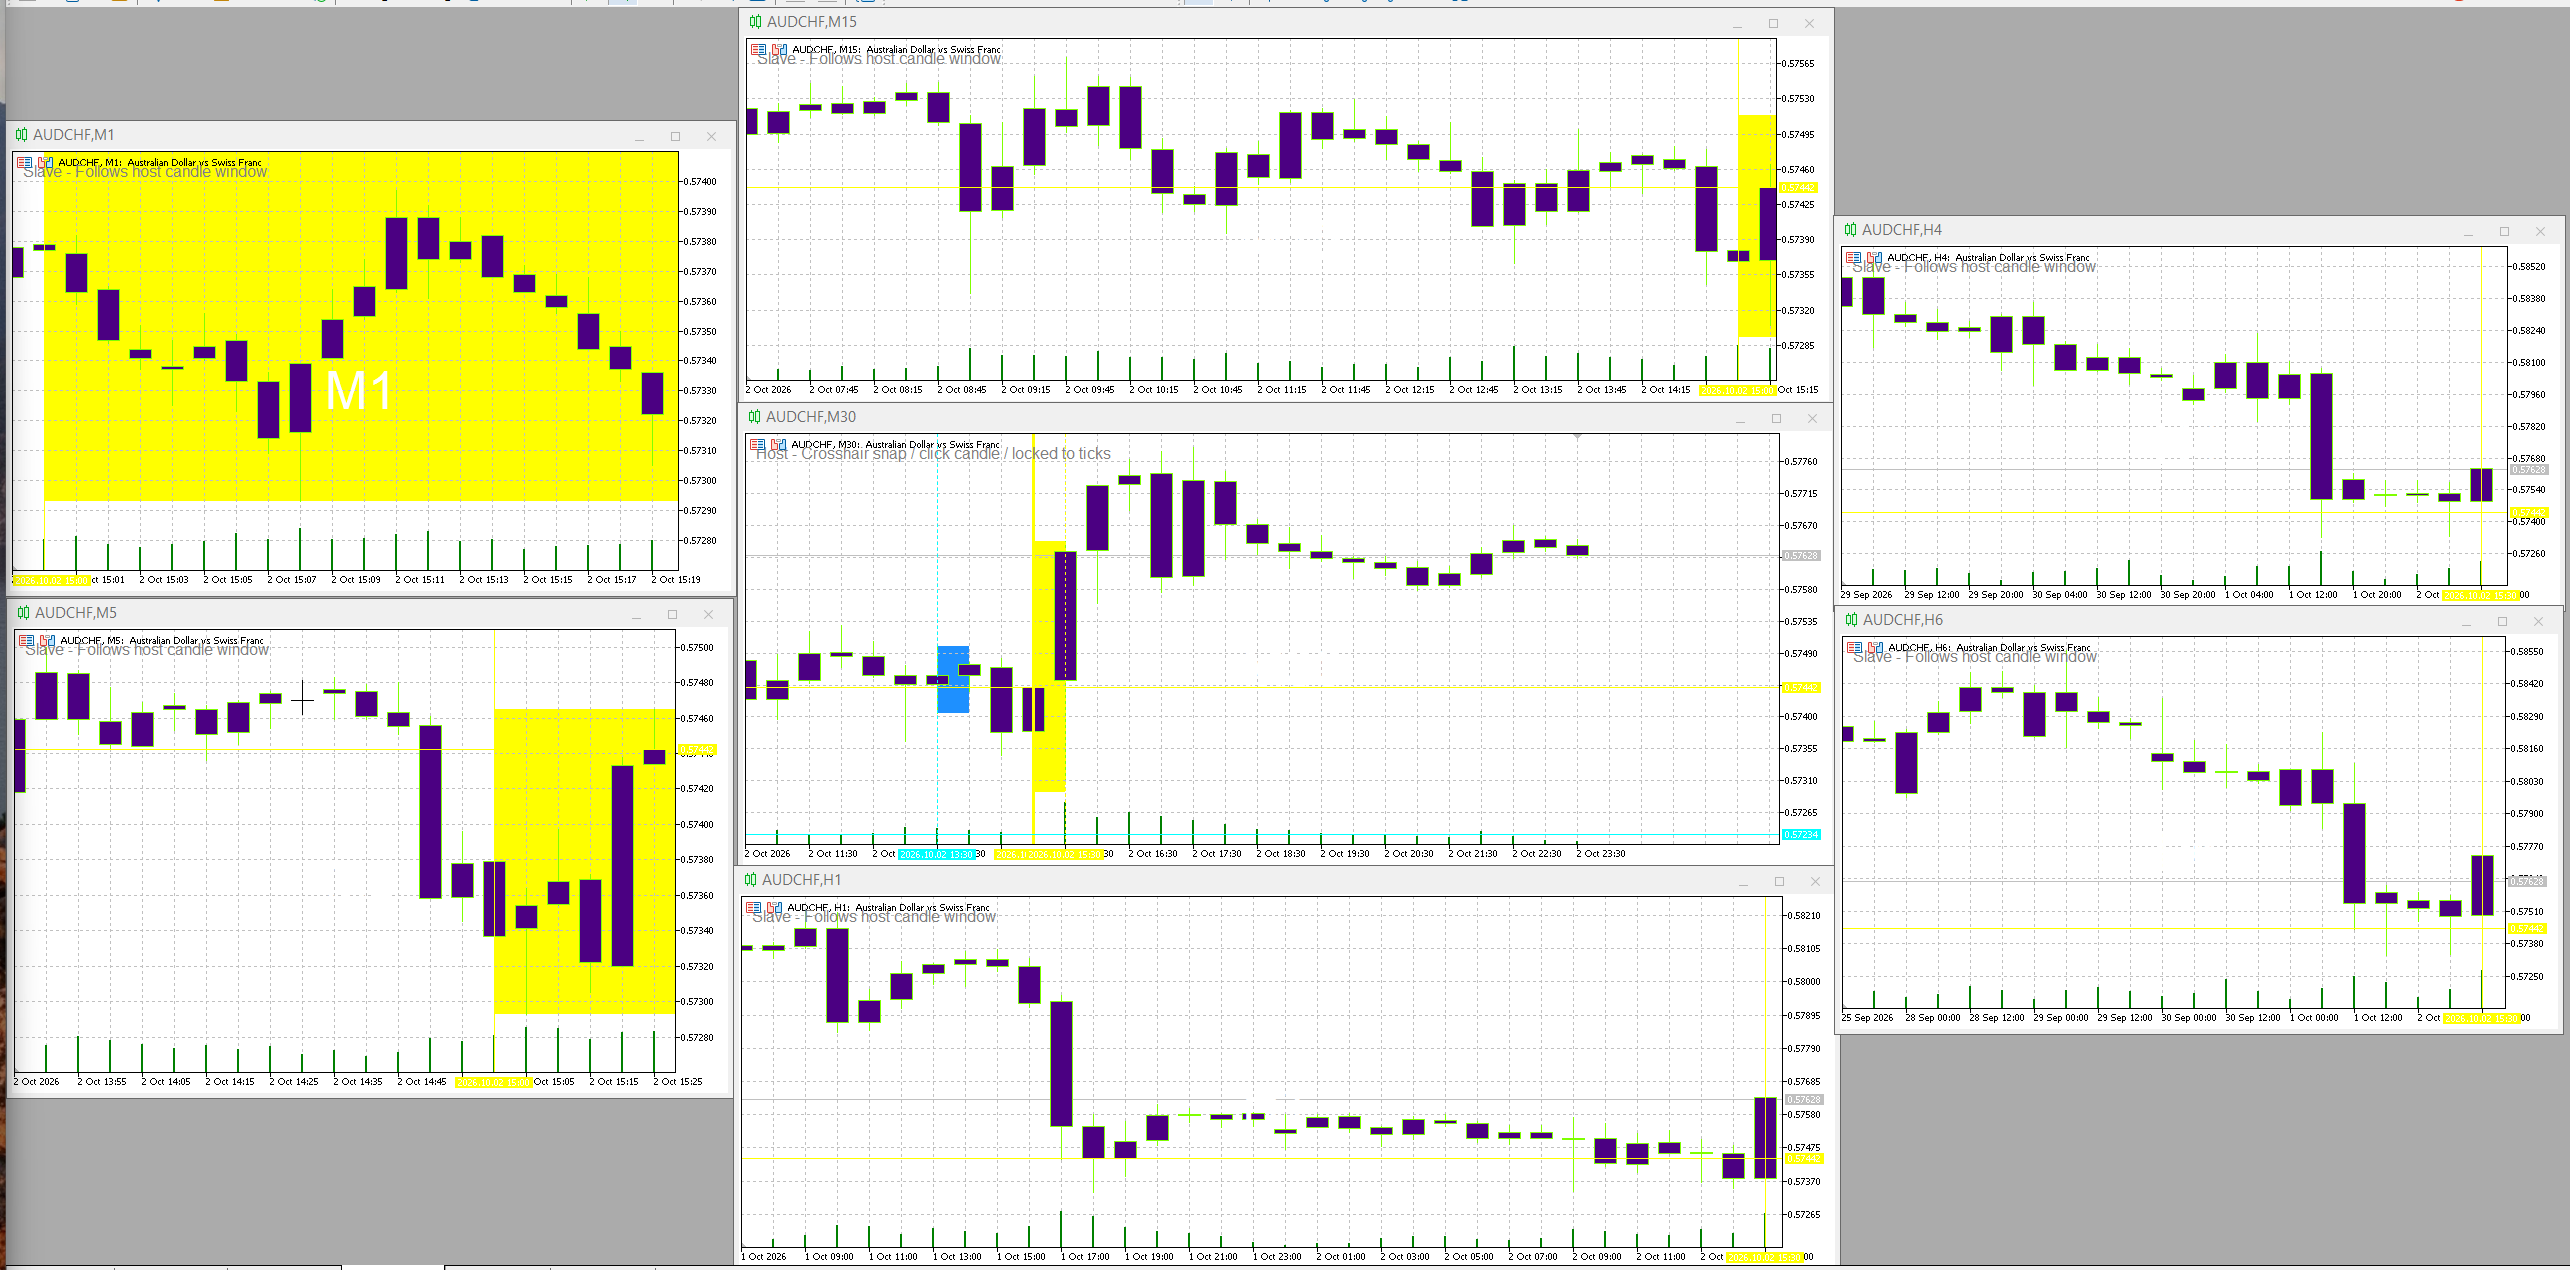
Upgrades needed for its completion:
1. Allow the slave charts to show the hosted periodical candlestick to become centered of its chart where the viewer sees the "before and after" price and time.
2. There is a lag and flicker on occasion which is why this is give freely. There's modification needed, an upgrade to allow less heavy/smoother and quicker analysis.
3. The .mq4/mt4 version has the missing the "host candle window" seen on the mt5 version.
What it is for
Use it when several charts of one symbol are open at different timeframes and you want one click to mark the same moment on all of them.
Typical setup: H1 (or whichever timeframe you read structure on) is the host. M1, M5, M15, H4, D1 of the same symbol are slaves. Click a candle on the host. Each slave gets:
- a solid vertical line at the host candle’s open time
- a dotted vertical line at the host candle’s close time
- an optional horizontal line at that candle’s close
- an optional filled rectangle covering that time span, with high/low taken from the bars on that chart inside the span
On a lower timeframe the box covers every bar inside the host candle. On a higher timeframe it lands on the bar that contains that window. That is the useful read: the host picks the idea, the slaves show how that idea looks in finer or coarser structure.
Host mouse move snaps a crosshair to the candle under the cursor and draws a hover box. A click publishes that candle and freezes follow-the-live-bar until you click the live candle again. With HostLockToLatest and AutoFollowHostBar, a selection that is already the live bar keeps publishing each new host candle.
Attach starts at maximum zoom (CHART_SCALE = 5). After that, the mouse wheel can zoom out. Candle mode is forced back to candlesticks, bodies indigo, wicks chartreuse.
Exactly one chart per symbol should have IsHost = true. The host deletes the shared global variables on remove, so slaves go quiet when the host is taken off.
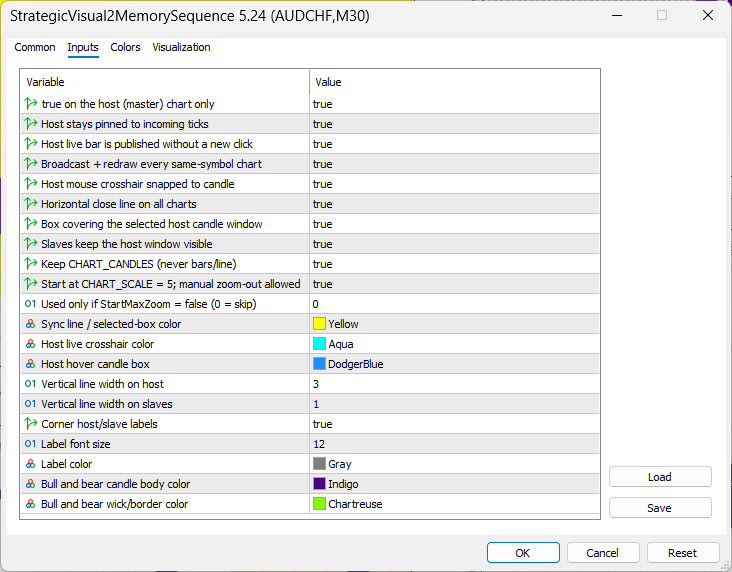
Inputs
| Input | Default | Role |
|---|---|---|
| IsHost | false | Master chart. Only one chart of this symbol should be true. |
| HostLockToLatest | true | Host chart stays on autoscroll and shift. Does not by itself yank a historical click back to the live bar. |
| AutoFollowHostBar | true | While the published bar is already the live bar, each new host candle is published without another click. |
| WakeAllCharts | true | After writing objects, send custom event 222 and redraw every same-symbol chart so background tabs update. |
| ShowHostCrosshair | true | Host-only snapped crosshair and mouse-move tracking. |
| DrawPriceLine | true | Horizontal line at the published close on every chart. |
| DrawHostCandleBox | true | Filled rectangle over the published time window. High/low are local to each chart. |
| RightAlignOnSync | true | Slaves scroll so the window stays on screen. Host with lock-to-latest does not get scrolled off the live edge. |
| ForceCandlesticks | true | Put the chart back to CHART_CANDLES if it was switched to bars or line. |
| StartMaxZoom | true | On attach, set scale to 5. Manual zoom-out after that is left alone. |
| DesiredVisibleBars | 0 | Used only if StartMaxZoom is false. Picks the scale whose visible-bar count is closest. 0 skips it. |
| LineColor | yellow | Sync lines and selected box. |
| CrosshairColor | aqua | Host live crosshair. |
| HoverBoxColor | dodger blue | Host hover box, before the click. |
| LineWidthHost | 3 | Vertical line width on the host. |
| LineWidthSlave | 1 | Vertical line width on slaves. |
| ShowLabels | true | Corner label: host vs slave, and whether the host is tick-locked. |
| FontSize | 12 | That corner label only. The timeframe watermark is fixed at 40. |
| LabelColor | gray | Corner label color. |
| CandleColor | indigo | Bull and bear body color. |
| WickColor | chartreuse | Up and down wick/border color. |
Shared state names are SV2MS_<symbol>_Time, _TimeEnd, _Price, _Period, _Seq. Object names are fixed (SV2MS_VLine, SV2MS_VLineEnd, SV2MS_HLine, SV2MS_SelectBox, SV2MS_HoverBox, SV2MS_XH_V, SV2MS_XH_H, labels).
How the code is arranged
Startup (OnInit) builds the global-variable names from the chart symbol, forces candles and colors, applies zoom, creates the lines, box, crosshair, corner label, and a large centered timeframe watermark. The host immediately publishes bar 0. A slave reads whatever the host already stored. A 200 ms timer starts.
The host publishes in PublishHostPick. It stores open time, open time plus one host-period, close price, host period, and a rising sequence number. Then it paints its own chart and walks every open chart with ChartFirst / ChartNext, applying the window only where the symbol matches.
ApplyWindowToChart is the slave (and host) painter. It creates the objects if missing, places the two vertical lines, the price line, and the rectangle. The rectangle’s high/low come from iBarShift plus a high/low scan across the bars inside the window, so a higher-timeframe chart is not asked to draw a one-bar host range it does not have. Navigation uses ChartNavigate(CHART_END, …) so the newer edge of the window sits near the right. If the host is tick-locked, that chart skips navigation and keeps autoscroll.
Slaves pick up changes three ways: the 200 ms timer, OnCalculate on a new tick, and custom event 222. ApplySyncState reads the globals and skips work if time, end, price, period, sequence, and the drawn line already match.
Host mouse move only updates the crosshair and hover box. Host click resolves x/y to a bar, clears live-follow memory, and publishes that bar’s open time and close. Chart change (resize, timeframe switch, mode change) restores candle colors, recenters the timeframe label, and reapplies sync.
OnDeinit kills the timer, deletes this chart’s objects, and, on the host only, deletes the five global variables.
Practical limit: sync is same-symbol only, terminal-local, and depends on one live host. Two hosts on the same symbol will overwrite each other. A slave opened before any host has published has nothing to draw until the host attaches or clicks.
 ORB Risk Managed - Opening Range Breakout with Account Protection
Opening Range Breakout EA template with built-in account protection. Marks the high and low of the first N minutes after the session open and places OCO stop orders above and below the range. Includes risk-based position sizing, daily loss limit, maximum drawdown limit, ATR range filter, trade direction filter, and protection against positions carried overnight. All session times are configurable inputs. Educational template, not a profit-guaranteed system. Test on demo before any live use.
Broker Profiler
Displays the symbol properties that cause the same EA to behave differently on a different broker: trading hours, contract size, tick value, spread statistics, swap cost and real-session coverage. Read-only; does not execute trades.
Tick Integrity Auditor
Audits the tick history that 'Every tick based on real ticks' backtests replay. Five checks per symbol over the last N days: impossible and crossed quotes, timestamps that run backwards or repeat, one-tick price reversals sized in multiples of the symbol's own median spread, silences inside the broker's declared quote sessions, and minutes where the ticks and the M1 bars disagree. Every finding goes to CSV with its millisecond timestamp, and the tool prints its own arithmetic so the report can be recounted. Read only: no trade function, no DLL, no network.
 MACD Signals
Indicator edition for new platform.