Fan sayfamıza katılın
Quantora Drawdown Monitor MT5 - Professional Account Risk and Drawdown Dashboard - MetaTrader 5 için gösterge
- Görüntülemeler:
- 97
- Yayınlandı:
-
Bu koda dayalı bir robota veya göstergeye mi ihtiyacınız var? Freelance üzerinden sipariş edin Freelance'e git
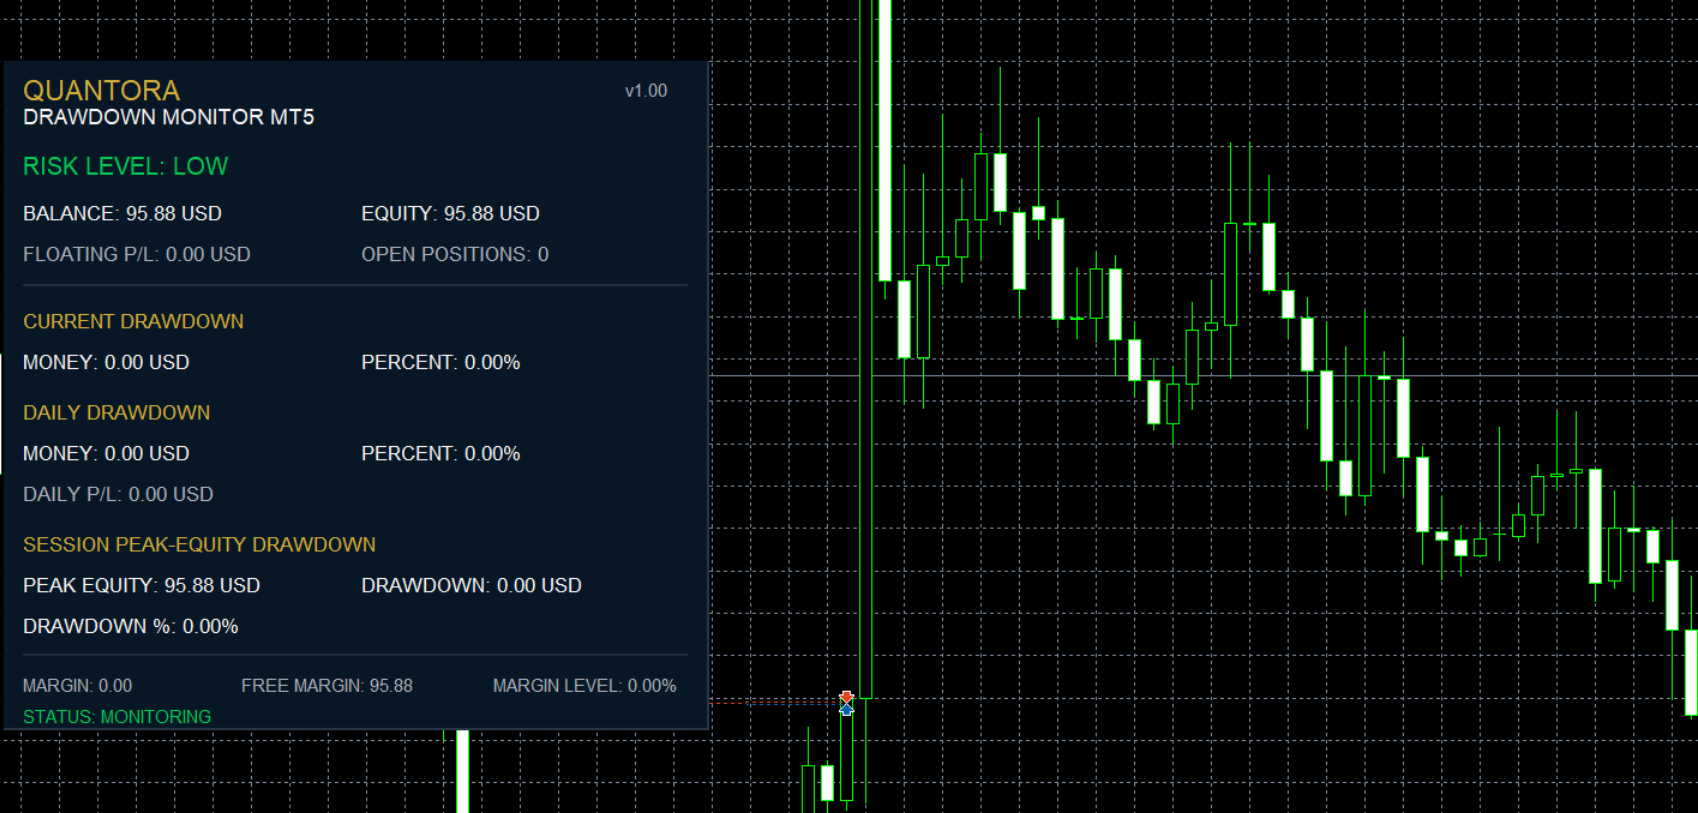
Quantora Drawdown Monitor MT5 is a professional account risk and drawdown monitoring indicator designed for MetaTrader 5.
The indicator continuously monitors account equity and balance conditions and presents important risk information through a clean real-time Quantora dashboard.
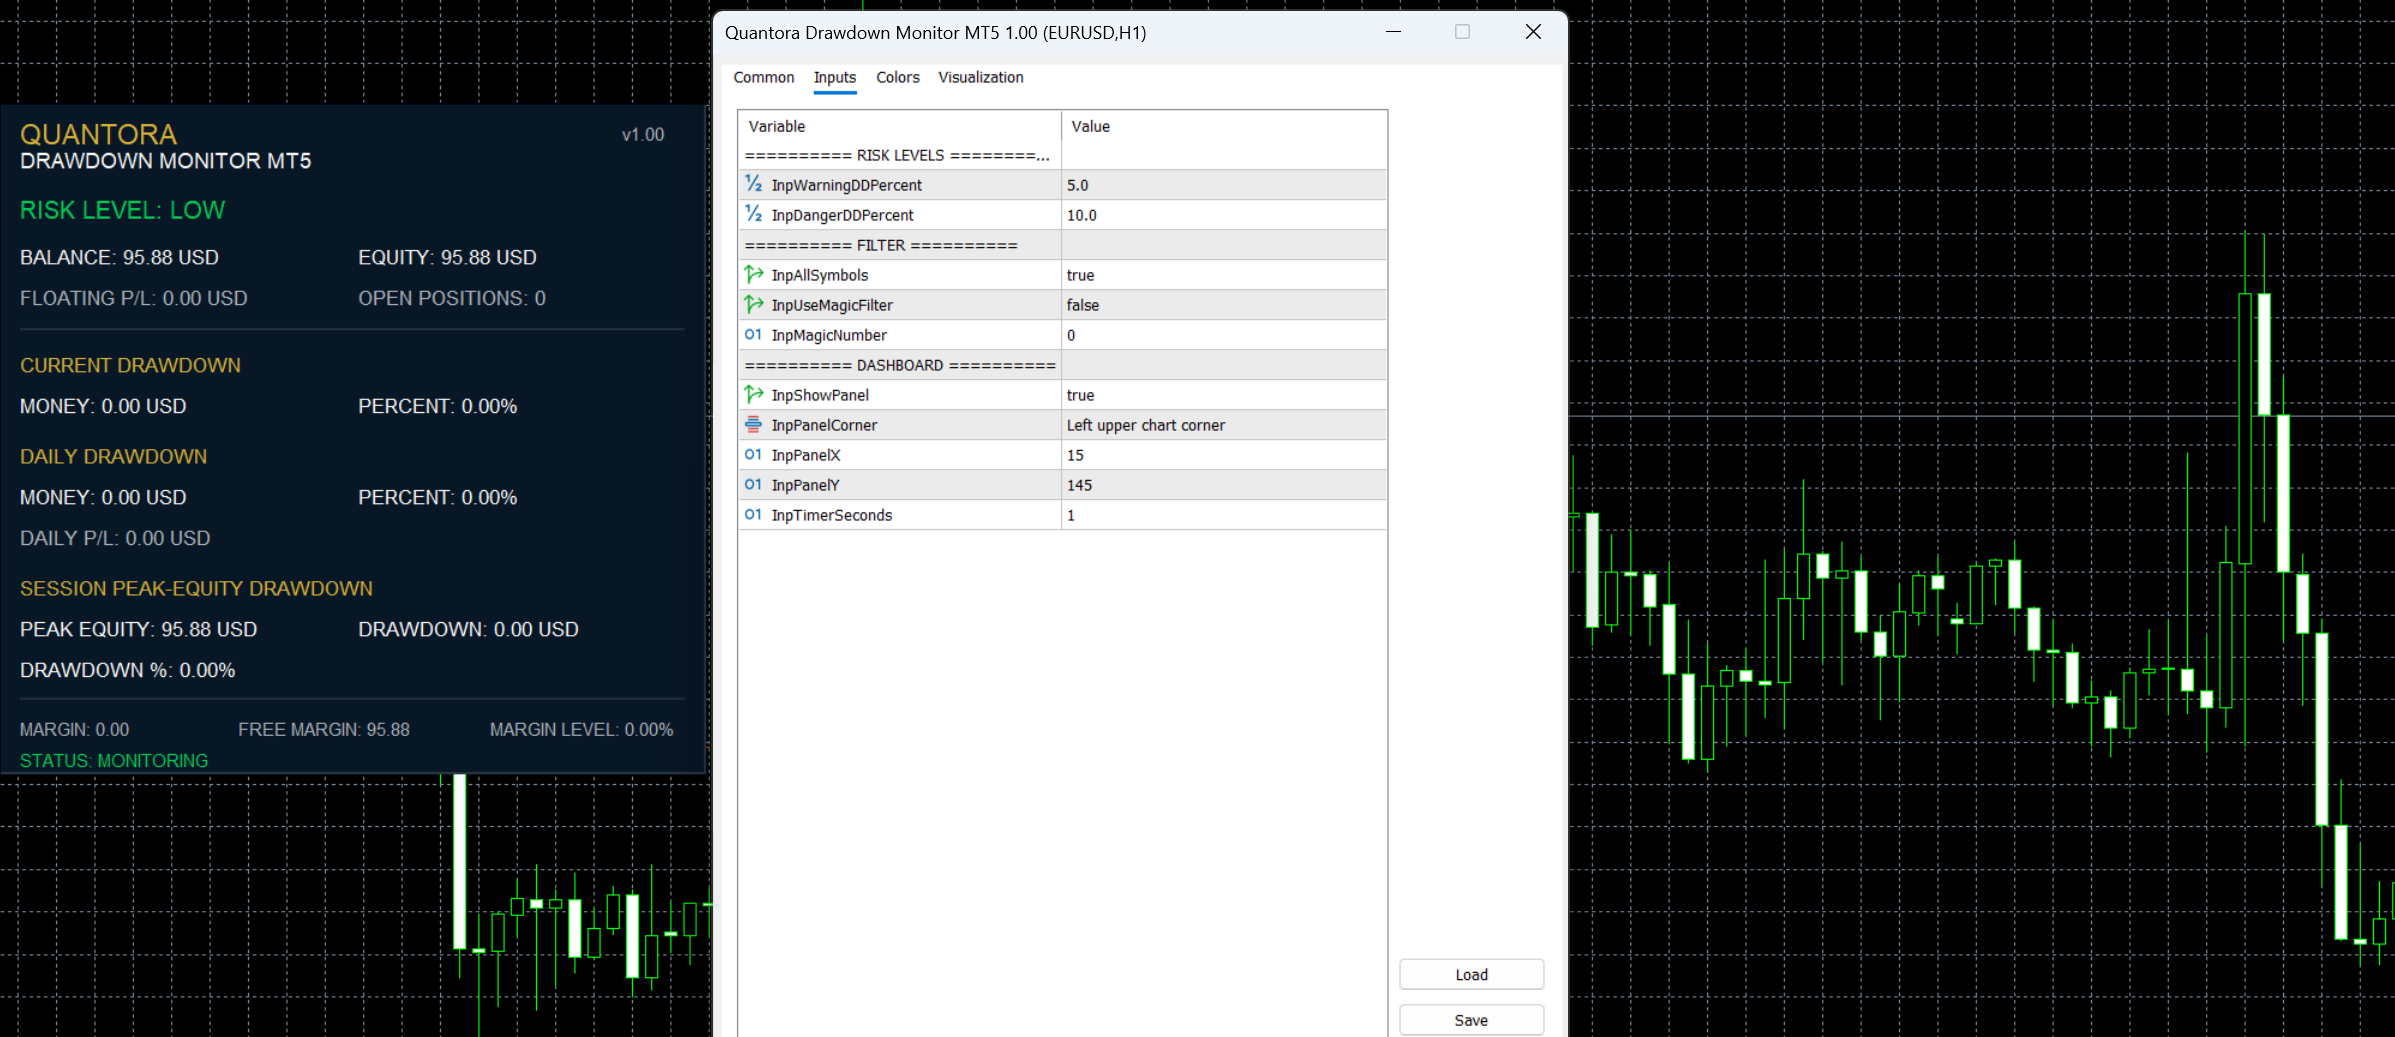
It allows traders to quickly monitor Current Drawdown, Daily Drawdown, Peak-Equity Drawdown, Daily P/L, Floating P/L, Margin Level and Open Positions without manually calculating account risk.
Configurable LOW, WARNING and DANGER thresholds provide an immediate visual indication of the current drawdown condition.
Main Features
- Real-time Account Balance
- Real-time Account Equity
- Current Floating P/L
- Open Position count
- Current Drawdown in money
- Current Drawdown %
- Daily Drawdown in money
- Daily Drawdown %
- Daily P/L
- Peak Equity tracking
- Peak-Equity Drawdown
- Peak-Equity Drawdown %
- Margin Used
- Free Margin
- Margin Level
- Configurable Warning Drawdown %
- Configurable Danger Drawdown %
- LOW / WARNING / DANGER risk classification
- All Symbols monitoring
- Current Symbol filtering
- Optional Magic Number filtering
- Automatic daily reference update
- Automatic real-time updates
- Professional Quantora dashboard
- Free and open-source MQ5 code
Current Drawdown
Current Drawdown compares the account's current Balance and Equity.
The monetary drawdown is calculated as:
Current Drawdown =
Max(0, Balance - Equity) The percentage value is calculated relative to the current account balance.
Example:
BALANCE 10,200.00 USD
EQUITY 10,042.00 USD
CURRENT DRAWDOWN
Money 158.00 USD
Percent 1.55% When Equity is equal to or above Balance, the current drawdown is displayed as zero.
Daily Drawdown
The indicator creates a daily reference based on the beginning of the current broker day.
It then compares current equity with the estimated starting equity for the day.
Example:
DAILY START EQUITY 10,200.00 USD
CURRENT EQUITY 10,042.00 USD
DAILY DRAWDOWN 158.00 USD
DAILY DRAWDOWN % 1.55% The daily reference automatically changes when a new broker day begins.
Daily Profit / Loss
The dashboard also calculates the current day's trading result.
It combines qualifying closed trading results from the current broker day with the current floating P/L.
Example:
CLOSED P/L TODAY +125.40 USD
FLOATING P/L -32.20 USD
DAILY P/L +93.20 USD Profit, swap, commission and available fee information are included when evaluating qualifying closed deals.
Peak Equity Tracking
Quantora Drawdown Monitor records the highest account equity observed while the indicator is running.
Example:
PEAK EQUITY 10,842.30 USD
CURRENT EQUITY 10,200.00 USD
PEAK DRAWDOWN 642.30 USD
PEAK DRAWDOWN % 5.92% If account equity reaches a new high, the Peak Equity reference is automatically updated.
Important: Peak Equity tracking begins when the indicator starts. It is not a permanent historical maximum and resets when the indicator or terminal is restarted.
Risk Level Indicator
The indicator automatically evaluates the largest monitored drawdown percentage against configurable thresholds.
Three conditions are available:
LOW
WARNING
DANGER Default thresholds:
Warning Drawdown = 5.0%
Danger Drawdown = 10.0% Therefore, with the default configuration:
Below 5% → LOW
5% to <10% → WARNING
10% or higher → DANGER The risk status is also color-coded on the dashboard for quick visual recognition.
Configurable Risk Thresholds
Both risk thresholds can be changed from the indicator inputs.
For example:
Warning DD % = 4.0
Danger DD % = 8.0 This allows traders to adapt the dashboard to their own account-management rules.
The thresholds are informational only. The indicator does not automatically close trades when a threshold is reached.
Floating P/L
Current floating performance of qualifying open positions is displayed directly on the dashboard.
Example:
OPEN POSITIONS 3
FLOATING P/L -84.50 USD Positive floating results are visually distinguished from negative results.
Margin Monitoring
The dashboard displays important MetaTrader 5 account margin information:
MARGIN USED 2,011.90
FREE MARGIN 8,236.70
MARGIN LEVEL 509.31% These values are obtained directly from the current MetaTrader 5 account.
Symbol Filtering
By default, the indicator can monitor qualifying positions and trading results across all symbols.
When:
All Symbols = false the current chart symbol is used for applicable position and history filtering.
This can be useful when a trader wants to focus on the activity associated with a particular instrument.
Magic Number Filter
An optional Magic Number filter is also available.
Example:
Use Magic Filter = true
Magic Number = 260028 This can be particularly useful for accounts running multiple Expert Advisors.
When enabled, qualifying position and history statistics are restricted to the selected Magic Number where applicable.
Automatic Updates
The dashboard uses timer-based updating.
Default:
Update Interval = 1 second This allows the account and drawdown information to update automatically while the indicator is running.
Example Dashboard
QUANTORA
DRAWDOWN MONITOR MT5
────────────────────────────────
RISK LEVEL LOW
BALANCE 10,200.00 USD
EQUITY 10,042.00 USD
FLOATING P/L -158.00 USD
OPEN POSITIONS 3
CURRENT DRAWDOWN
Money 158.00 USD
Percent 1.55%
DAILY DRAWDOWN
Money 158.00 USD
Percent 1.55%
DAILY P/L -84.20 USD
SESSION PEAK-EQUITY DRAWDOWN
PEAK EQUITY 10,684.30 USD
DRAWDOWN 642.30 USD
DRAWDOWN % 6.01%
MARGIN 2,011.90
FREE MARGIN 8,030.10
MARGIN LEVEL 499.13%
STATUS: MONITORING Installation
Place:
Quantora Drawdown Monitor MT5.mq5
inside:
MQL5 → Indicators
Compile the source file using MetaEditor.
Then attach Quantora Drawdown Monitor MT5 to any MetaTrader 5 chart.
The dashboard will automatically begin monitoring the account.
Important Notes
The Current Drawdown measurement compares current account Balance and Equity.
The Daily Drawdown uses an estimated beginning-of-day reference based on current balance and qualifying closed trading results since the beginning of the broker day.
The Peak Equity value is tracked only while the indicator is running. Restarting MetaTrader 5 or reloading the indicator resets this reference.
Because account-wide Balance and Equity values are inherently account-level metrics, symbol or Magic Number filtering should not be interpreted as creating a completely independent sub-account equity curve.
The risk classifications are informational and should not be interpreted as financial advice or guaranteed safe trading levels.
The indicator does not:
- Open trades
- Close trades
- Modify positions
- Change Stop Loss
- Change Take Profit
- Automatically stop an Expert Advisor
- Generate BUY or SELL signals
It is a monitoring and account-analysis tool only.
Product Information
Version: 1.00
Platform: MetaTrader 5
Program Type: Indicator
Category: Trading Utilities / Risk Management
License: Free / Open Source
Developed by QUANTORA
Professional MetaTrader 5 Trading Tools, Indicators and Expert Advisors.
More Professional Quantora Trading Products
Explore Quantora's professional MetaTrader 5 Expert Advisors, premium indicators and trading tools on the official MQL5 Market:
Quantora Trade Statistics Dashboard MT5 - Professional Trading Performance Analytics
Professional open-source Trade Statistics Dashboard for MetaTrader 5. Analyzes trading history with win rate, profit factor, reward/risk, streaks, BUY/SELL performance, lot statistics and floating P/L.
Quantora Symbol Information Dashboard MT5 - Professional Symbol and Trading Specifications Panel
Professional open-source Symbol Information Dashboard for MetaTrader 5. Displays live prices, spread, tick value, contract size, lot limits, swaps, trading conditions, daily range and ATR in real time.
Quantora Market Volatility Monitor MT5 - Professional ATR and Volatility Dashboard
Professional open-source Market Volatility Monitor for MetaTrader 5. Analyzes current ATR, average ATR, ATR ratio, daily range and spread to classify market volatility in real time.
Quantora Multi-Timeframe Trend Dashboard MT5 - Professional EMA Trend Analysis
Professional open-source Multi-Timeframe Trend Dashboard for MetaTrader 5. Analyzes M1 to D1 using EMA 20, EMA 50 and price position to identify Bullish, Bearish and Neutral market conditions.