Fan sayfamıza katılın


- Görüntülemeler:
- 1689
- Derecelendirme:
- Yayınlandı:
- Güncellendi:
-
 Alım-satım fırsatlarını kaçırıyorsunuz:
- Ücretsiz alım-satım uygulamaları
- İşlem kopyalama için 8.000'den fazla sinyal
- Finansal piyasaları keşfetmek için ekonomik haberler
Kayıt Giriş yapWeb sitesi politikasını ve kullanım şartlarını kabul edersiniz
Hesabınız yoksa, lütfen kaydolun -
 Bu koda dayalı bir robota veya göstergeye mi ihtiyacınız var? Freelance üzerinden sipariş edin
Freelance'e git
Bu koda dayalı bir robota veya göstergeye mi ihtiyacınız var? Freelance üzerinden sipariş edin
Freelance'e git
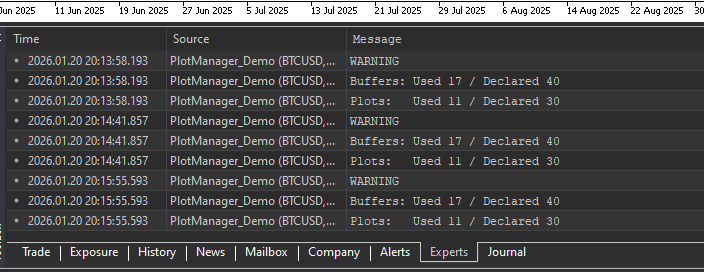
We’ve all been there (I think). You’re coding a complex indicator with 70+ buffers and 30+ plots. You decide to move a "Filling" background behind a "Candle" plot, and suddenly you have to manually re-number 50 lines of SetIndexBuffer calls.
It’s monotonous, error-prone, and a massive headache trying to calculate if "Plot 5" starts at "Buffer 12" or "Buffer 16" because of color buffers.
I wrote a wrapper class ("CPlotManager") to automate this hierarchy.
- No more manual counting.
- No more massive "#property" lists defining every color and width.
- Manage complex color palettes (like Color Candles) with a single array.
- Covers all plots available in MQL5
You just "Add" plots in the order you want them drawn. The class handles the math, the buffer binding, and the styling automatically.
How to Use
-
Include helper_plots.mqh.
-
Set your #property totals (give yourself plenty of room).
-
In OnInit, instantiate the manager and just "Add" what you need.
Review the demo code for full implementation.
 The Playground Series v1 to V4 - A combination of trading concepts
The Playground EA series was created for experimentation with Fair Value Gaps (FVGs) and liquidity concepts
 News Spread Risk Dashboard (Spike and Gap Monitor)
A compact on-chart dashboard that monitors live spread behavior, tracks rolling Min/Max/Avg, and warns on abnormal spread spikes (news, low liquidity, rollover) using adaptive or fixed thresholds with optional alerts.
Session Daylight Gradient — Ambient Forex Session Overlay
A lightweight chart overlay that paints a smooth “daylight” gradient across Pacific, Asia, London, and New York sessions—plus optional session separators, event labels, and “sunray” highlights for scheduled news. Includes UTC/Broker/PC time modes and a manual DST shift.
ASZ - Adaptive Structure ZigZag
A robust Market Structure analyzer that adapts to volatility. ASZ uses a Hybrid ATR engine to filter noise and detect reliable Swing points. Non-repainting on confirmed bars.