Fan sayfamıza katılın

Adaptive Volatility Analysis - MetaTrader 4 için gösterge

- Görüntülemeler:
- 11871
- Derecelendirme:
- Yayınlandı:
- Güncellendi:
-
 Alım-satım fırsatlarını kaçırıyorsunuz:
- Ücretsiz alım-satım uygulamaları
- İşlem kopyalama için 8.000'den fazla sinyal
- Finansal piyasaları keşfetmek için ekonomik haberler
Kayıt Giriş yapWeb sitesi politikasını ve kullanım şartlarını kabul edersiniz
Hesabınız yoksa, lütfen kaydolun -
 Bu koda dayalı bir robota veya göstergeye mi ihtiyacınız var? Freelance üzerinden sipariş edin
Freelance'e git
Bu koda dayalı bir robota veya göstergeye mi ihtiyacınız var? Freelance üzerinden sipariş edin
Freelance'e git
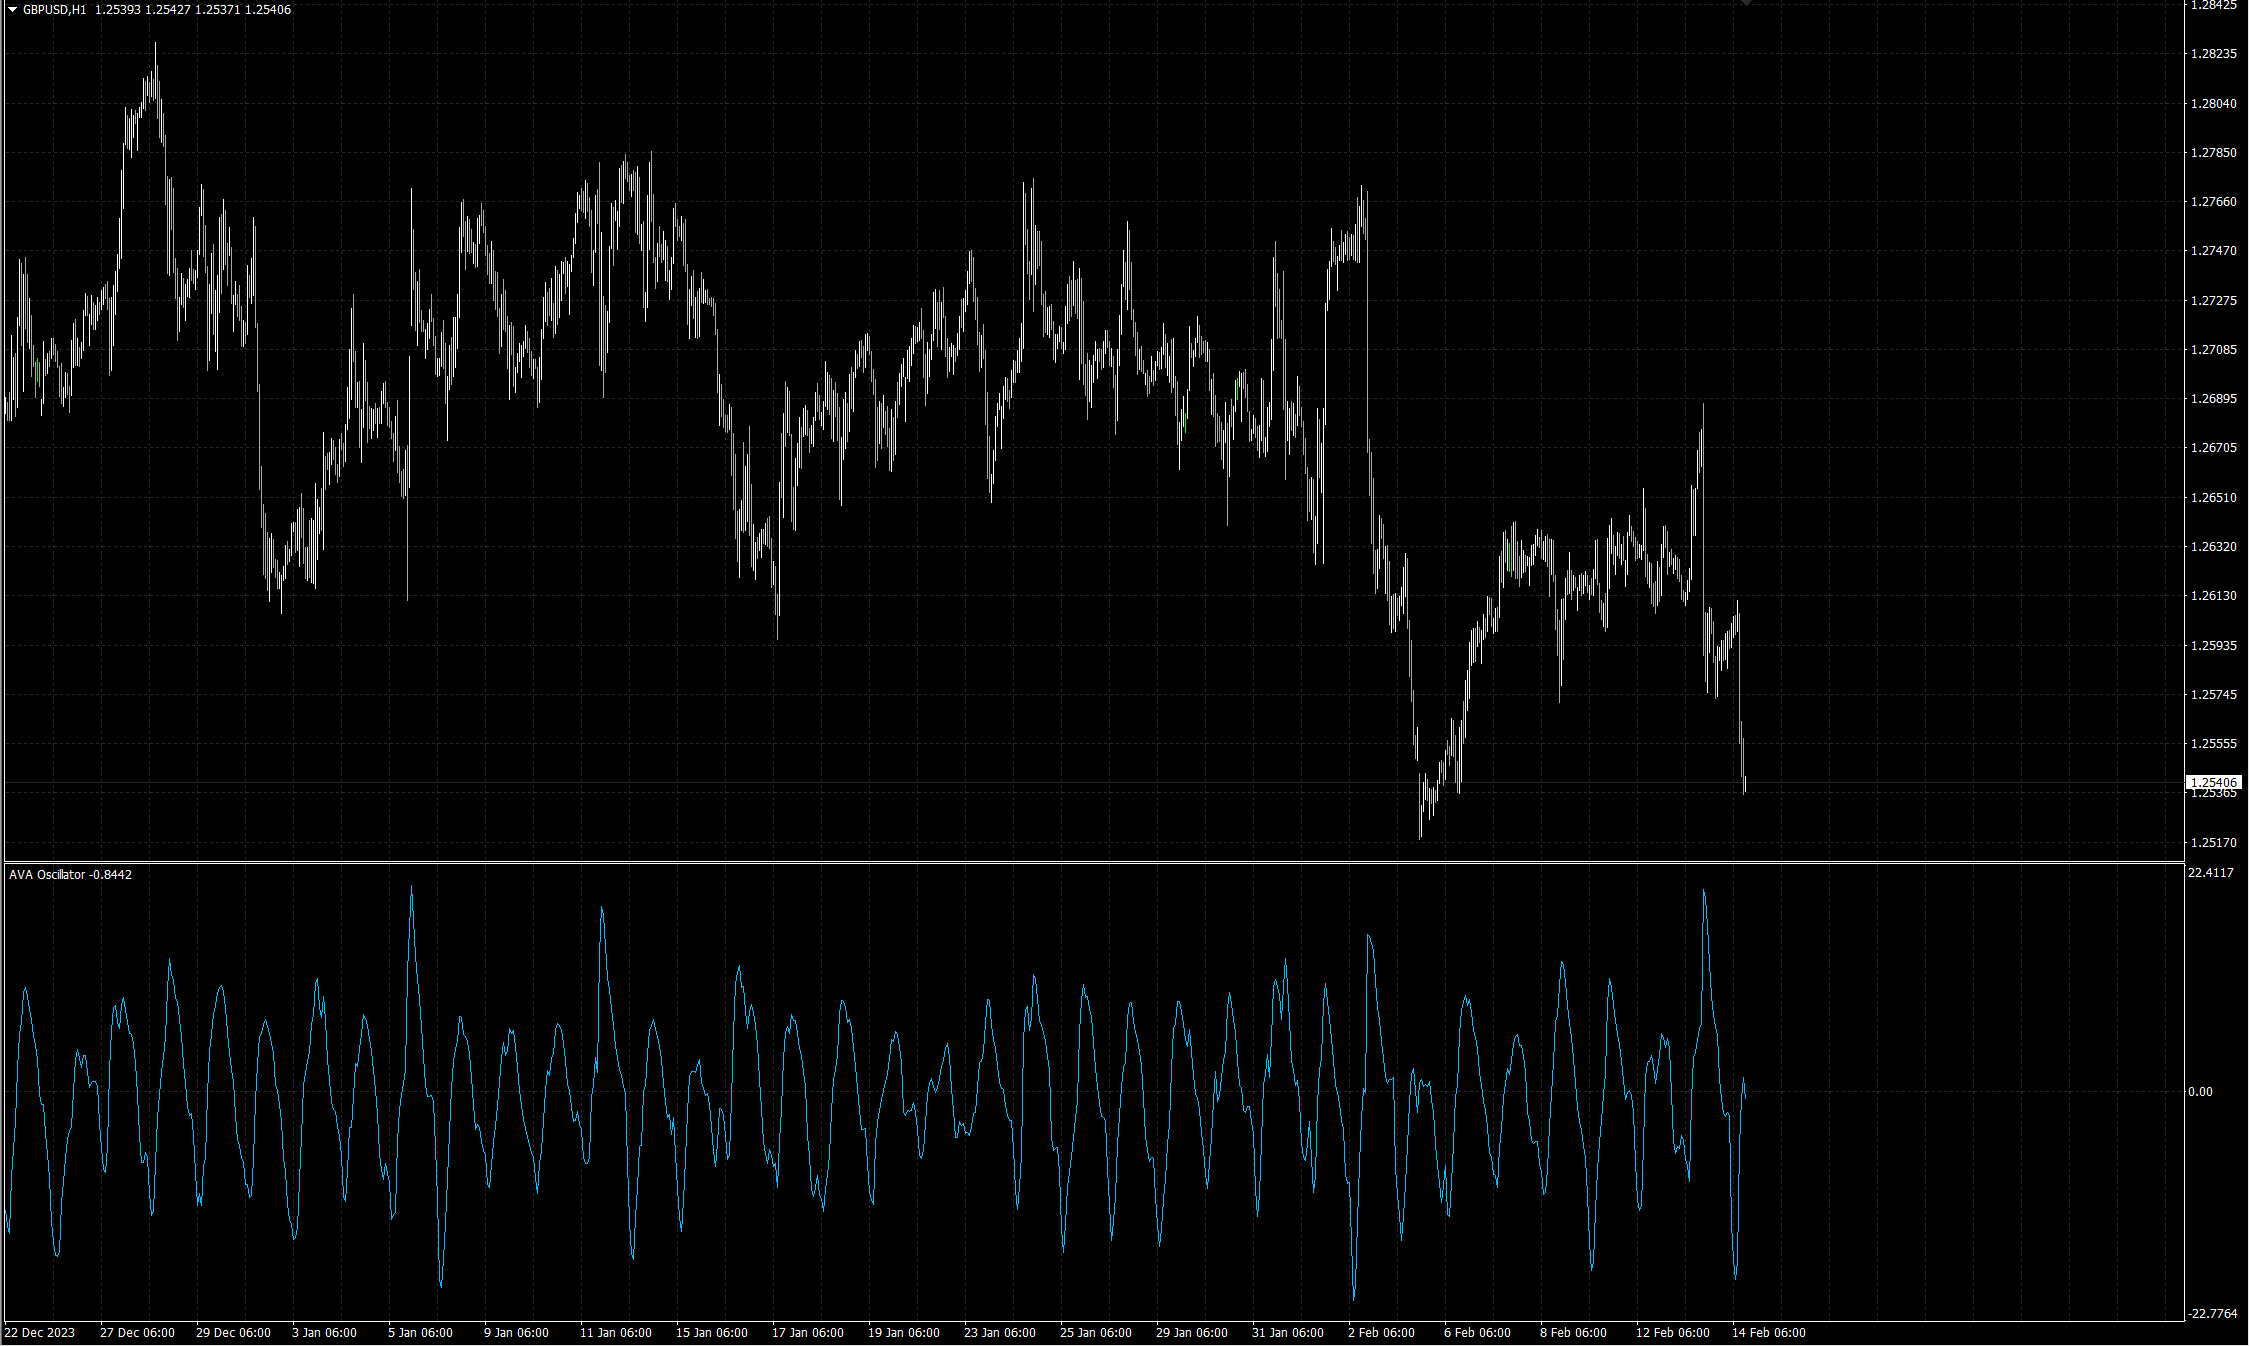
The AVA (Adaptive Volatility Analysis) Indicator is a tool I've developed, primarily for enhancing my own indicators and Expert Advisors (EAs). It's designed to gauge market price movements with greater precision. Unlike standard indicators that offer a static view of the market, the AVA adapts its analysis based on current market dynamics. This adaptability makes it valuable for predicting shifts towards higher volatility or calmer periods. This indicator was mainly designed to be used called by genetic algorithms.
How It Operates:
-
Starting With ATR: The foundation of the AVA Indicator is the Average True Range (ATR), which quantifies market movement over a set number of past trades (typically 14 trades by default).
-
Smoothing with EMAs: The indicator employs two Exponential Moving Averages (EMAs) applied to the ATR values - a short-term EMA (default is 2) and a long-term EMA (default is 5), for longer term analyisis we can opt for longer periods, for example 10 and 50. These EMAs help to smooth out the ATR readings, making it easier to identify price movement trends.
-
The FAV Ratio: The core of the AVA Indicator is the FAV (Factor of Adaptive Volatility), calculated by dividing the short-term EMA by the long-term EMA of ATR values. This ratio adjusts the indicator's sensitivity to market changes, ensuring it remains responsive to both subtle and significant shifts.
-
Determining AVA Value: The final AVA value is derived by modifying the FAV ratio: subtract 1 from FAV, then multiply by 100. This results in a percentage that represents the current market volatility level.
Exact Calculation:
Where,
FAV = EMA_short(ATR) / EMA_long(ATR)
Usage Guidelines:
-
Interpreting the Indicator: The AVA Indicator appears in a separate chart beneath your main trading chart. An increasing AVA value signifies rising market volatility, whereas a decreasing value indicates reduced volatility or stability.
-
Application Insights: In periods of growing volatility, consider strategies that capitalize on significant price movements. Conversely, when volatility diminishes, it might be prudent to wait for clearer trading signals or to opt for strategies better suited to stable markets.
 Calculate Drawdown in MT4
this shortcode will calculate the drawdown of a particular ea, where it is applied to a specified symbol.
 Titik Impas Breakeven MT4
The Breakeven Point, or Titik Impas, denotes the price level at which a trade's profit becomes zero. By setting a position to Titik Impas Breakeven, the stop-loss is aligned with the position's opening price. This strategy proves valuable when you aim to allow profits to accumulate while ensuring that the trade remains secure and does not revert to negative territory.
Buy Sell Close Manual trading EA for trading newbies
[@Buy_Sell_Close] Manual trading EA for trading newbies, EA can be used in backtesting visual mode, EA can also be used in live trading. You can practice your own trading system in backtesting.
 Take Profit based on current profit
Many Expert Advisors (EAs) tend to close orders at the take profit level, considering the pip distance from the purchase price.