Alım-satım robotlarını ücretsiz olarak nasıl indirebileceğinizi izleyin
Bizi Telegram üzerinde bulun!
Fan sayfamıza katılın
Fan sayfamıza katılın
Komut dosyasını ilginç mi buldunuz?
Öyleyse bir link gönderin -
başkalarının da faydalanmasını sağlayın
Öyleyse bir link gönderin -
başkalarının da faydalanmasını sağlayın
Komut dosyasını beğendiniz mi? MetaTrader 5 terminalinde deneyin
- Görüntülemeler:
- 6408
- Derecelendirme:
- Yayınlandı:
-
Bu koda dayalı bir robota veya göstergeye mi ihtiyacınız var? Freelance üzerinden sipariş edin Freelance'e git
The idea of the indicator
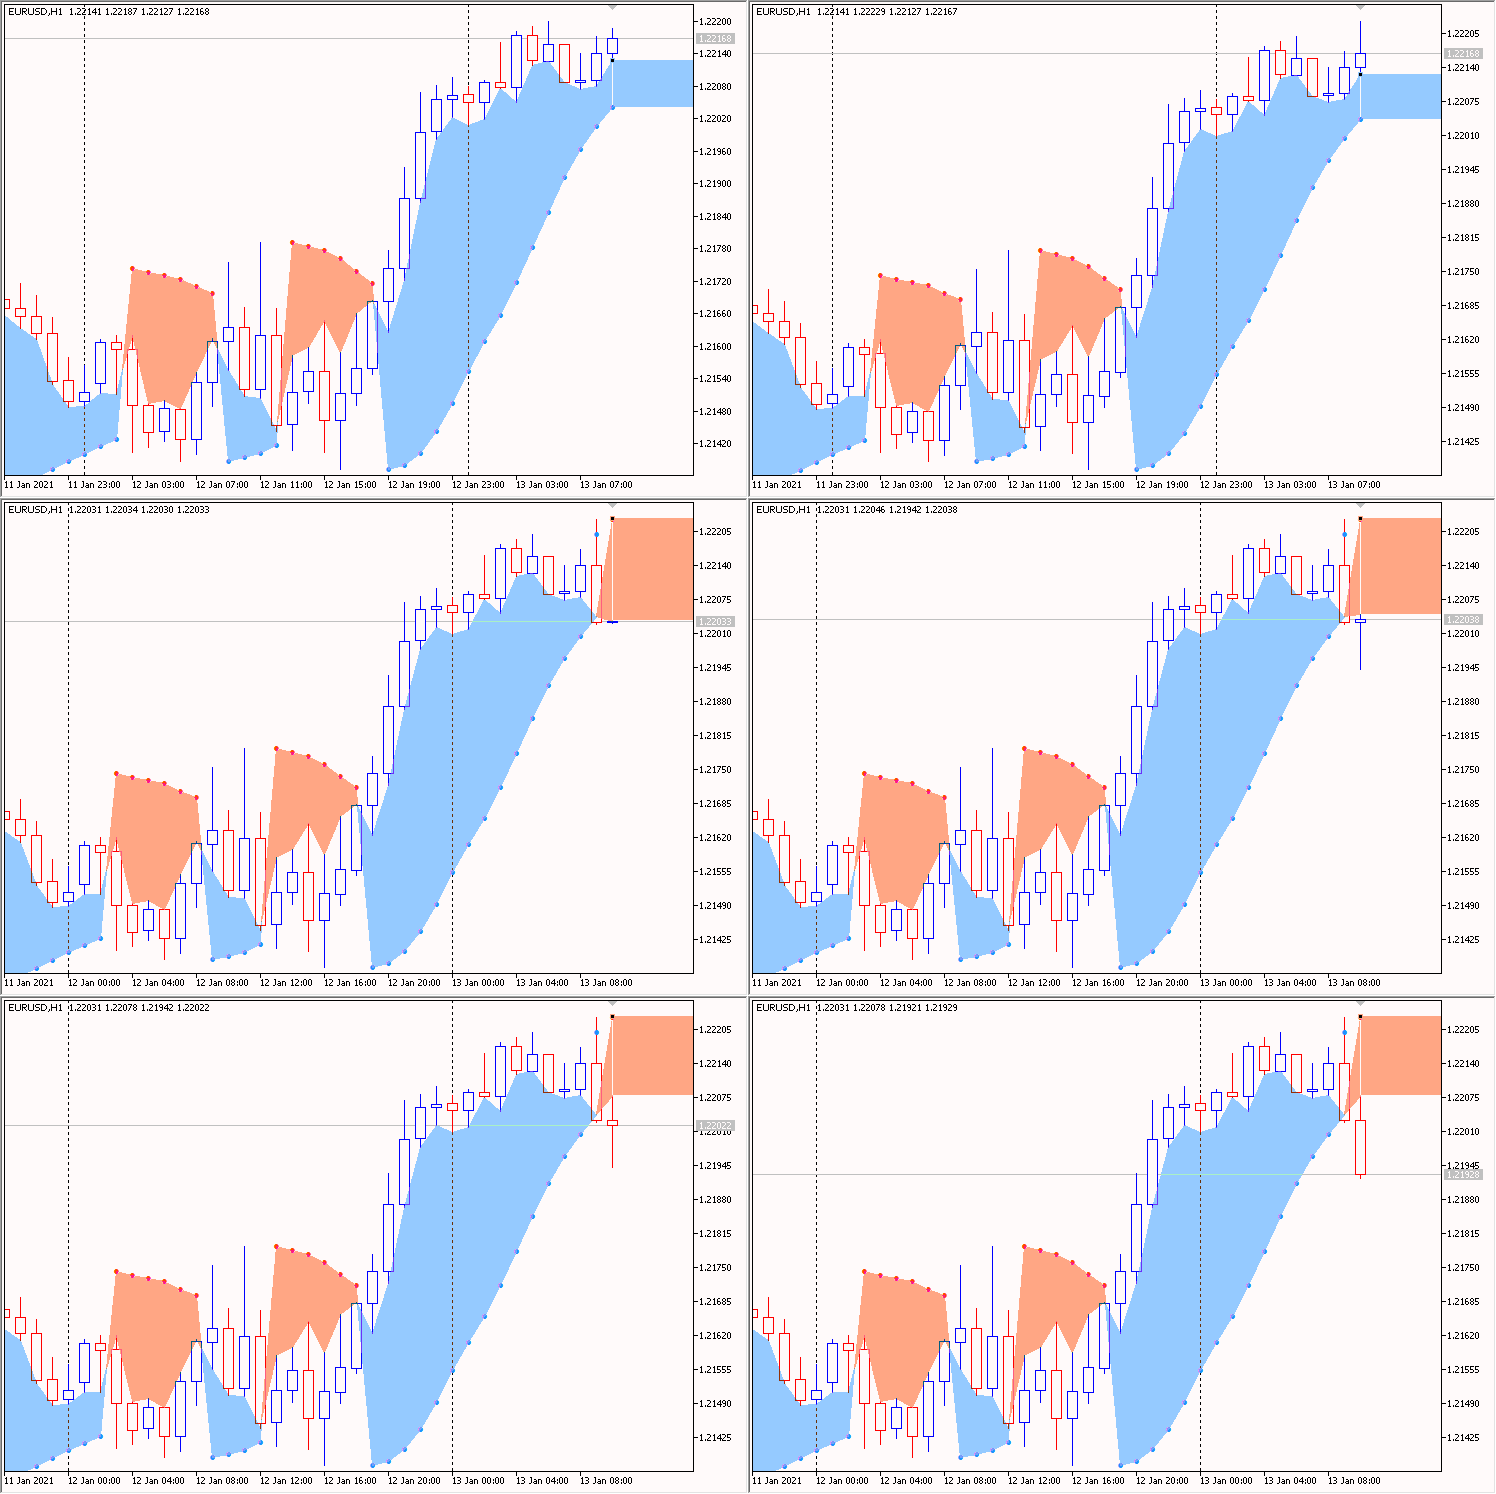
Additional style DRAW_FILLING to the iSAR indicator (Parabolic SAR, SAR). Filling the area between the price and the iSAR indicator. Additionally (on the right side) a rectangle is drawn - this rectangle repeats the fill area.

Rice. 1.SAR Color Filling Right zone
 Daily Change Text Alert
The indicator shows 'Daily Change' on the daily timeframe. When the specified limit is reached, plays sounds
 MACD AO Colors
'MACD' indicator with the same color scheme as the 'Awesome Oscillator' indicator
 RSI_MAonRSI_Dual
Two indicators iRSI (Relative Strength Index, RSI) smoothed using iMA (Moving Average, MA)
 Multiple dynamic logistic regression first unsuccessful attempt
from the logistic regression Article, I welcome all the thoughts on how we can build multiple dynamic Logistic Regression