Fan sayfamıza katılın
Öyleyse bir link gönderin -
başkalarının da faydalanmasını sağlayın
- Görüntülemeler:
- 7419
- Derecelendirme:
- Yayınlandı:
- Güncellendi:
-
Bu koda dayalı bir robota veya göstergeye mi ihtiyacınız var? Freelance üzerinden sipariş edin Freelance'e git
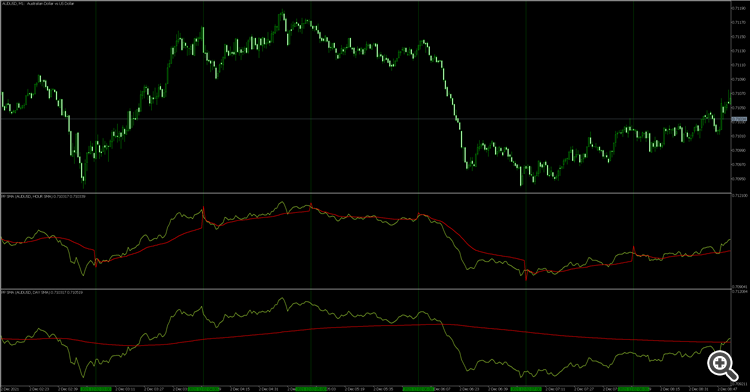
To calculate the average price, you can specify the periods H1 and D1. For example, the D1 average price allows you to track whether the price of a certain financial instrument is above or below the average price. The same is with H1, which indicates a price trend reversal much faster.
The indicator has only three calculated input parameters:
input string               _symbolName    ="0";             // Symbol, 0 = take a symbol from the chart
input ENUM_USE_SMA         _useSMA        =HOUR_SMA;        // Use moving average
input ENUM_APPLIED_PRICE   _appliedPrice  =PRICE_WEIGHTED;  // Price
- Symbol for calculations;
- The time period for which the average price is calculated;
- Applied price.
It is recommended to use from M1 to M30, M1 is the most informative time scale.
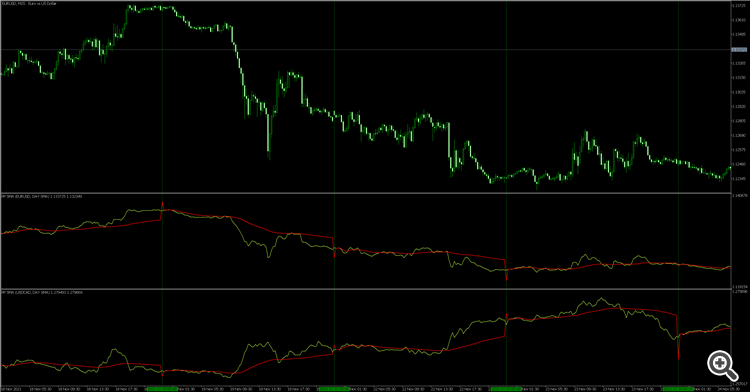
You can also compare different financial instruments on the same price chart.
For example, EURUSD and USDCAD, M15.
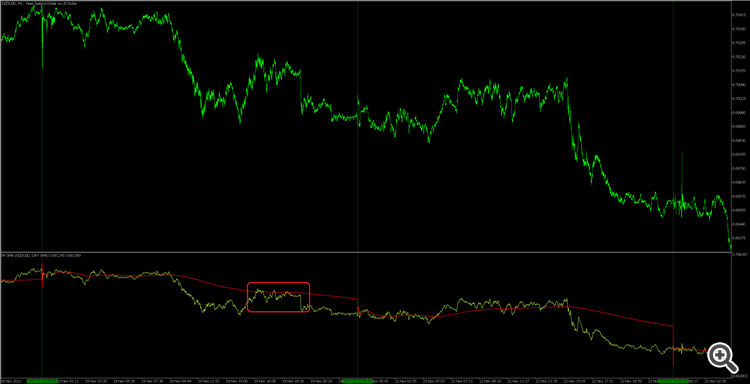
The indicator also allows you to see the resistance / support levels of the daily average price.
 Convert iExposure.mq4 From MetaQuotes
iExposure will show the opening of trading positions in tabular form in the sub-window below the main window. This allows the trader to see at a glance the positions in the market including the profit value and the amount of risk for each position. The iExposure indicator is a technical tool that is easy to use and very helpful, especially if a trader opens several trades at once with several different instruments. Traders can add the iExposure indicator to any price chart if they wish to use it. By adding the iExposure indicator, traders can also still see tabs of other trading positions for other currencies. Also note that iExposure can also monitor all trading positions, besides being able to make details by displaying one position for one window.
 Pair Or Symbol And Time Frame With Watermark
Displays the current timeframe and symbol name in large font on the chart background. Useful when hopping between several charts with different symbols at the same time.
 Consolidation Detector
Draws an equidistant channel to detect rectangular consolidation pattern on chart
 Bobokus Fibonacci
Select Timeframe to draw Bobokus Fibonacci and add any custom fibonacci levels you want


