Fan sayfamıza katılın

Moving Average Bands Width - MetaTrader 5 için gösterge

- Görüntülemeler:
- 9934
- Derecelendirme:
- Yayınlandı:
-
 Alım-satım fırsatlarını kaçırıyorsunuz:
- Ücretsiz alım-satım uygulamaları
- İşlem kopyalama için 8.000'den fazla sinyal
- Finansal piyasaları keşfetmek için ekonomik haberler
Kayıt Giriş yapWeb sitesi politikasını ve kullanım şartlarını kabul edersiniz
Hesabınız yoksa, lütfen kaydolun -
 Bu koda dayalı bir robota veya göstergeye mi ihtiyacınız var? Freelance üzerinden sipariş edin
Freelance'e git
Bu koda dayalı bir robota veya göstergeye mi ihtiyacınız var? Freelance üzerinden sipariş edin
Freelance'e git
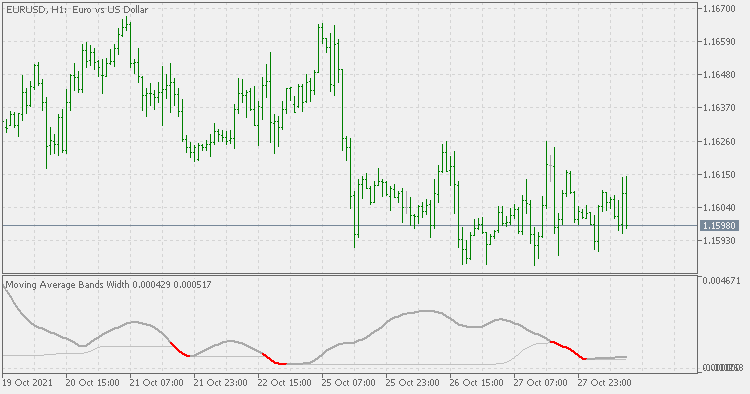
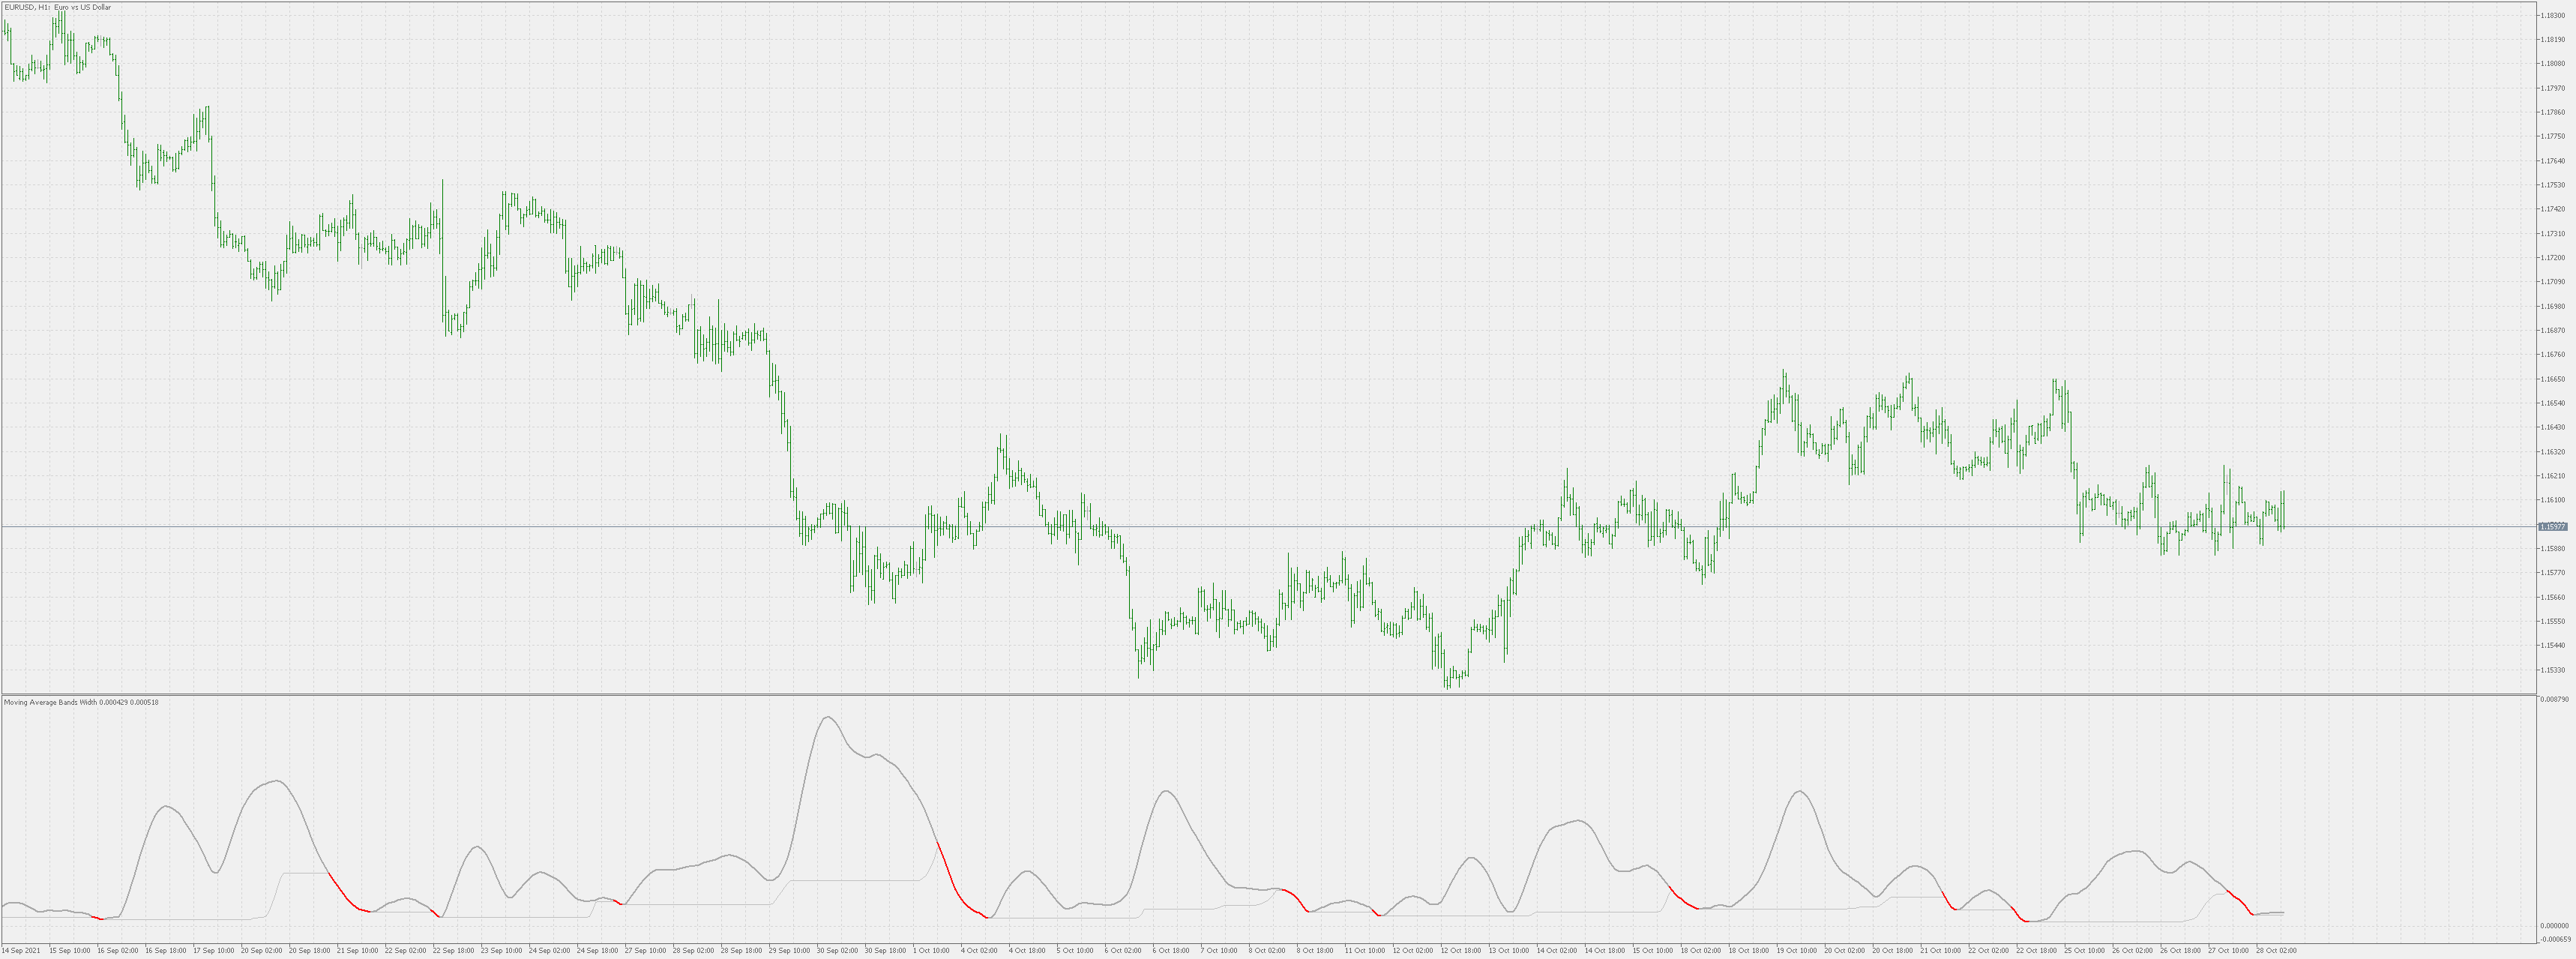
According to the author Vitali Apirine, the width of the moving average bands indicator can be used as an indicator of volatility.
Vitali Apirine:
The distance between the bands will widen as volatility increases and will narrow as volatility decreases. The moving average band width (MABW) measures the percentage difference between the bands. Changes in this difference may indicate a forthcoming move or change in the trend.
In this version the only deviation from the original published in TASC August 2021 magazine is that the indicator is drawing periods when the bands width is reaching its extreme lows in red (as a possible sign of expansion after extreme congestion)
Recommendations:
- It is not a directional indicator - it indicates volatility
- You can probably use it for indication of possible trend changes (after the lower extremes are reached) or trend continuation after a period of ranging
Moving Average Bands - extended
Moving average bands - extended version
Moving Average Bands
Moving Average Bands
The Hilbert Oscillator Indicator
The Hilbert Oscillator Indicator was created John Ehlers in "Rocket Science For Traders", pg.90-91
MyRsi
MyRsi - by John Ehlers