 MetaTrader 5
 Uzmanlar
 Göstergeler
 Komut dosyaları
 Kütüphaneler
 Depo
Alım-satım robotlarını ücretsiz olarak nasıl indirebileceğinizi izleyin
Bizi Facebook üzerinde bulun!
Fan sayfamıza katılın
Fan sayfamıza katılın
Kodu beğendiniz mi? MetaTrader 5 terminalinde deneyin

Basket Viewer-View Statistics on groups of Long and Short Pairs - MetaTrader 5 için gösterge

- Görüntülemeler:
- 14342
- Derecelendirme:
- Yayınlandı:
- Güncellendi:
-
 Alım-satım fırsatlarını kaçırıyorsunuz:
- Ücretsiz alım-satım uygulamaları
- İşlem kopyalama için 8.000'den fazla sinyal
- Finansal piyasaları keşfetmek için ekonomik haberler
Kayıt Giriş yapWeb sitesi politikasını ve kullanım şartlarını kabul edersiniz
Hesabınız yoksa, lütfen kaydolun -
 Bu koda dayalı bir robota veya göstergeye mi ihtiyacınız var? Freelance üzerinden sipariş edin
Freelance'e git
This utility allows monitoring of multiple symbols and positions on one chart, with one group for long (buy) symbols, and another group for short (sell) symbols. There are 7 default symbol pairs in each of the groups. The user may change these and enter up to 50 symbols from their market watch in either of the long or short basket for viewing.
The current display chart can be changed to any of the symbols in the indicator display with a click on the symbol. Statistics including ATR, points gained or lost from a week’s start and position gains or losses and lots exposure are displayed. The statistics week may be changed with simple clicks on the display, and the display may be dragged and dropped to a different location.
The load on quote processing is kept low by simply posting an event that starts the processing for a display update instead of running the update inline with the quote processing. Also, the display will be updated at least every second even if there are no quotes received on the current chart.
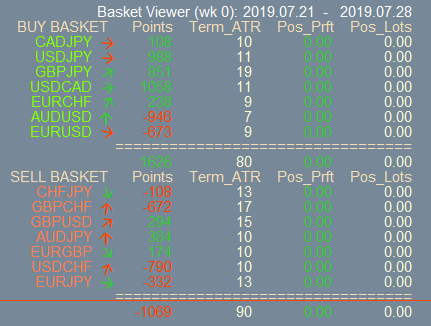
Here are descriptions of the main controls and features of the display - The first two lines have the 'control objects (full picture below):

"Basket Viewer (wk 0): 2019.07.14 - 2019.07.21"
- Click "Basket Viewer" to select the object and drag and drop the panel to a different location on the chart.
- Click the first date (2019.07.14) to decrement the week being displayed.
- Click the 2nd date (2019.07.21) to increment the week being displayed.
"BUY BASKET Points Term_ATR Pos_Prft Pos_lots", or
"BUY BASKET Points Indi_ATR Pos_Prft Pos_lots"
Click this line to highlight the currently selected week on the chart (draws a rectangle over the week). Click a 2nd time to remove the rectangle.
- "BUY BASKET" is the list of pairs extracted from the User controllable "Buy Pairs String". Click on the individual 'pairs strings' to change the chart to that symbol.
- The arrow next to the symbol indicates direction and strength of the price movement between bar 1's open and bar0's close, with a 1.5 ATR movement displayed as a 90 (or -90) degree arrow.
- "Points" is the Open of the week subtracted from the close of the week (close - open). This is based on the week selected, (default is week 0, the current week).
- "Term_ATR" or “Indi_ATR” is the atr for the symbol for the week in the chart's time frame. This is based on the week selected, (default is week 0, the current week). The two values indicate if the ATR is being calculated by the Terminal or by the Indicator itself.
- "Pos_Prft" is the profit or loss from any active trades on the symbol. This does not change based on week selected.
- "Pos_Lots" is the exposure to the indicated symbol. In the picture, there is a 1 lot exposure shown on GBPJPY. This does not change based on week selected.
As can be seen in the below display picture, this header is followed by the buy pairs statistics, including a total for the Points, ATR, Prft and Lots columns.
"SELL_BASLET Points Term_ATR Pos_Prft Pos_Lots", or
"SELL_BASLET Points Indi_ATR Pos_Prft Pos_Lots"
This is a repeat of the "BUY Basket" header for the "Sell Basket". Clicking this line changes how the ATR is calculated, either by getting the data from the terminal using the iATR handle, or by calculating itself using iHigh and iLow functions. As can by seen in the below display, this header is followed by the sell pairs statistics, including a total for the Points, ATR, Prft and Lots columns. The totals are opposite from the Buy Basket - for example, profit points are (open - current/close) price for the week, versus (current/close - open) for the Buy Basket.
Clicking on any of the "Symbol Pairs" changes the chart to that symbol pair.
There is considerable error messaging in the indicator to log when the terminal is not ready to provide quote information. I recommend obtaining and un-commenting "#include <errordescription.mqh> // errordescription.mqh is found at: https://www.mql5.com/en/code/79 ", and then searching for ErrorDescription and editing the lines with it to include the Error Description. These features were commented out to enable the code to pass the automated testing required for publishing - I'm not aware of another good way to get error descriptions.
The line (line 390) "USE_TERMINAL_ATR = ON;" can be edited to "USE_TERMINAL_ATR = OFF;" to default to calculating the ATR internally to the indicator - I chose not to do so as the startup and initialization of terminal data for the indicator seemed to work better with the value ON. The terminal seems to require some time to prepare the values for iOpen, iClose, iHigh and iLow. If running in the Strategy Tester, be patient, the terminal may take some time to initialize before starting execution.
BearsBullsPower
Indicator Bears and Bulls Power for MT5 together in one separate window.
CamarillaFlatandClear
The code consists of lines created according to the opening, closing, low and high values of prices.
Utility to view the statistics for a Single Bar of any time frame
The utility will display the high, low, open, close and time statistics for any user selected bar of any timeframe for the symbol of the chart the utility resides on.
dTrends
Arrow trends by iBearsPower and iBullsPower indicator for MT5