Fan sayfamıza katılın

- Görüntülemeler:
- 18030
- Derecelendirme:
- Yayınlandı:
-
 Alım-satım fırsatlarını kaçırıyorsunuz:
- Ücretsiz alım-satım uygulamaları
- İşlem kopyalama için 8.000'den fazla sinyal
- Finansal piyasaları keşfetmek için ekonomik haberler
Kayıt Giriş yapWeb sitesi politikasını ve kullanım şartlarını kabul edersiniz
Hesabınız yoksa, lütfen kaydolun -
 Bu koda dayalı bir robota veya göstergeye mi ihtiyacınız var? Freelance üzerinden sipariş edin
Freelance'e git
Bu koda dayalı bir robota veya göstergeye mi ihtiyacınız var? Freelance üzerinden sipariş edin
Freelance'e git
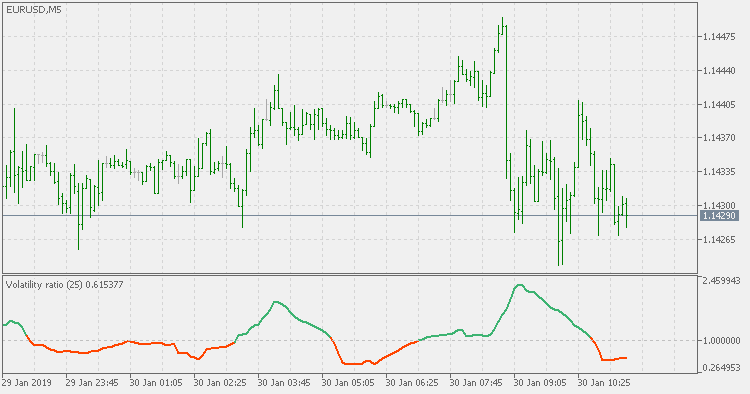
Theory :
There is always a need to measure if the market is "quiet" or it is volatile. One of the possible way is to use standard deviations, but the issue is simple : we do not have some levels that could help us find out if the market is in a state of lower or higher volatility. This indicator is attempting to do that :
- values above level 1 are indicating state of higher volatility
- values above level 1 are indicating state of lower volatility
Usage :
This is not a directional indicator. It should be used for volatility detection, not trend assessment - for that you have to use some other indicator and then check this one if the market volatility conditions are those that you expect
 Chande's DMI - std adaptive with floating levels
Chande's DMI - std adaptive with floating levels
Chande's DMI - std adaptive with dsl signal lines
Chande's DMI - std adaptive with dsl signal lines
Volatility ratio - with floating levels
Volatility ratio - standard deviations based with floating levels
RSX volatility ratio adaptive
RSX volatility ratio adaptive