Fan sayfamıza katılın

Time Based Moving Averages - MetaTrader 5 için gösterge

- Görüntülemeler:
- 10906
- Derecelendirme:
- Yayınlandı:
- Güncellendi:
-
 Alım-satım fırsatlarını kaçırıyorsunuz:
- Ücretsiz alım-satım uygulamaları
- İşlem kopyalama için 8.000'den fazla sinyal
- Finansal piyasaları keşfetmek için ekonomik haberler
Kayıt Giriş yapWeb sitesi politikasını ve kullanım şartlarını kabul edersiniz
Hesabınız yoksa, lütfen kaydolun -
 Bu koda dayalı bir robota veya göstergeye mi ihtiyacınız var? Freelance üzerinden sipariş edin
Freelance'e git
Bu koda dayalı bir robota veya göstergeye mi ihtiyacınız var? Freelance üzerinden sipariş edin
Freelance'e git
The concept is simple: Plotting Price behavior within several periods of time.
Some Symbols behave very well during the trading day - with this I mean Intraday trading - and this behavior ends up plotting effectively well with the proposed Exponential Moving Averages in this indicator...
Obviously that this behavior could not be seen in all Symbols, but you can give it a try... Just drop this indicator in a chart and you will see for yourself...
This indicator is intended for "Feeling the Trend" purposes. Visual cues are very effective for traders, that's why I created this for our fellow traders in our brotherhood...
For those who love Dynamic Support & Resistances...
OK! You can put 6 MA's manually on your chart, but doing this very often and again and again is pure pain. So this indicator is a kind of a shortcut for it. It has 6 Moving Averages completely customizable in Time Period, Style and Color. The presets are the best I could set for M1, M5 and M15, and, following a visual pattern of Hot-to-Cold color approach - hot colors for faster MA's, colder colors for long MA's - ending up with the last MA with a dashed gray line representing the whole Trading Period (day)...
Many traders would be amazed with the patterns... You can give a try!

For those who use the Triple-Screen approach, on the Settings window you will find tips for configuring the MA's for each timeframe:
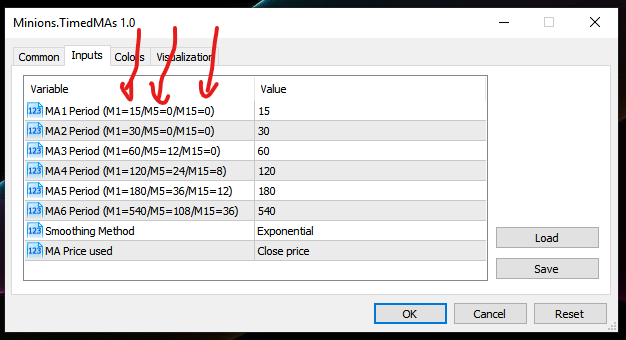
Example:

I hope this helps the community!
If you like this indicator, just click on the Like stars... it means a WORLD to me! So I can continue to share more stuff traders want!
Live Long and Prosper!
;)
Symbol Name On Chart
Pretty simple. Seems Stupid. But yes, You need this...
RSI of average using double smoothed Wilder's EMA
RSI of average using double smoothed Wilder's EMA
TRIX (using double smoothed Wilder's EMA)
TRIX (using double smoothed Wilder's EMA)
TRIX using Wilder's double smoothed EMA - floating levels
TRIX using Wilder's double smoothed EMA - with an addition of floating levels