FXB Confluence Engine MT4
- Индикаторы
-
Kestutis Balciunas
 Обладая более чем 16-летним активным опытом на финансовых рынках, я специализируюсь на разработке высокоэффективных торговых стратегий для форекс, технических индикаторов и автоматизированных советников (Expert Advisors) для MT4/MT5. Моя работа охватывает точно разработанные торговые системы
 - Версия: 1.0
- Активации: 10
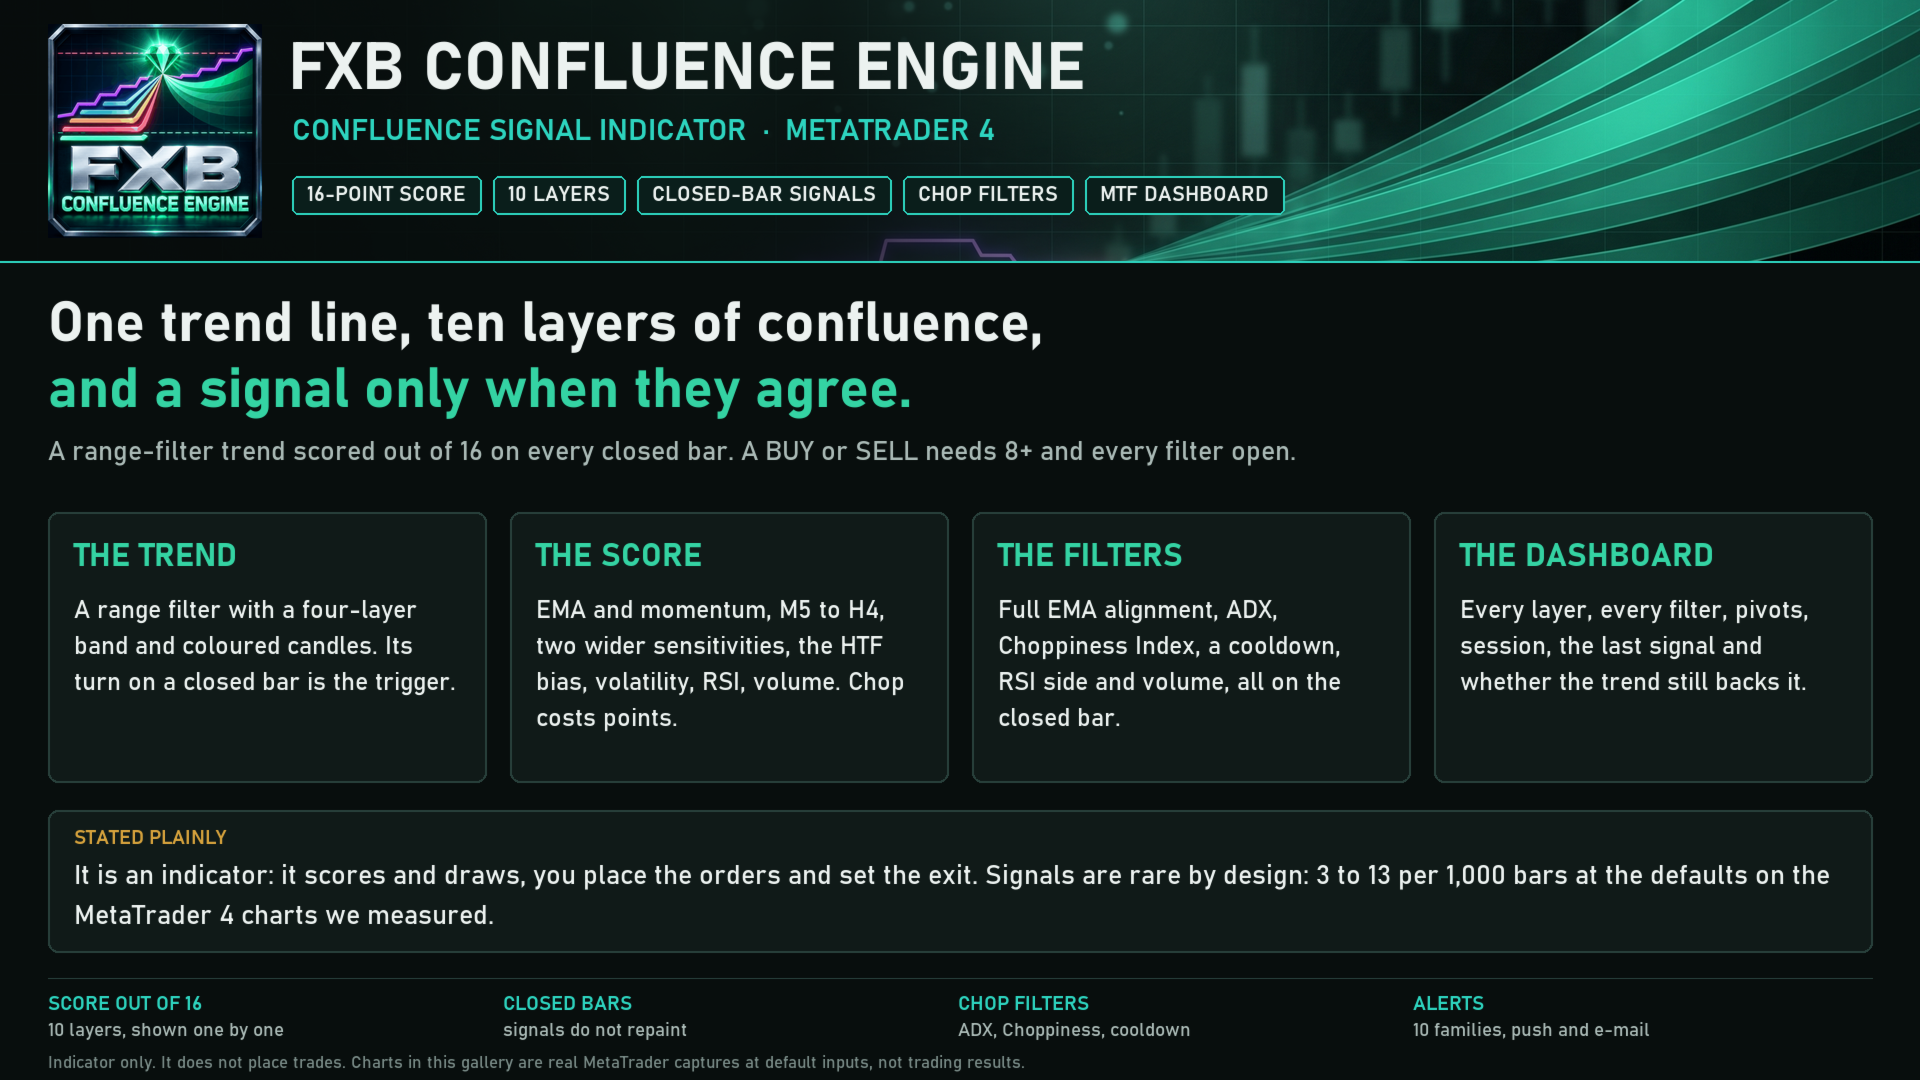
FXB Confluence Engine follows the trend with a range filter and, each time that trend turns on a closed bar, scores how much of the market agrees with the new direction. Momentum and the EMAs, four other timeframes, a higher-timeframe bias, the same filter at two wider settings, volatility, RSI and volume each add points, and a choppy market takes points away. A BUY or SELL prints only when the score reaches your minimum and every filter you have switched on is open. A dashboard on the chart shows every point of it, so a missing signal is as easy to explain as a printed one.
HOW A SIGNAL FORMS
- The trend: a range filter follows price but only moves when price travels further than a range sized from the ATR. Its direction is the trend, drawn as a line with a four-layer band and coloured candles. Sensitivity (6 by default) sets the width of the range; a higher value means fewer flips.
- The trigger: the trend turning on a closed bar.
- The score: the turn is scored out of 16 by ten layers (below).
- The filters: the turn becomes a signal only if every filter is open (below), including a minimum score of 8.
THE SCORE
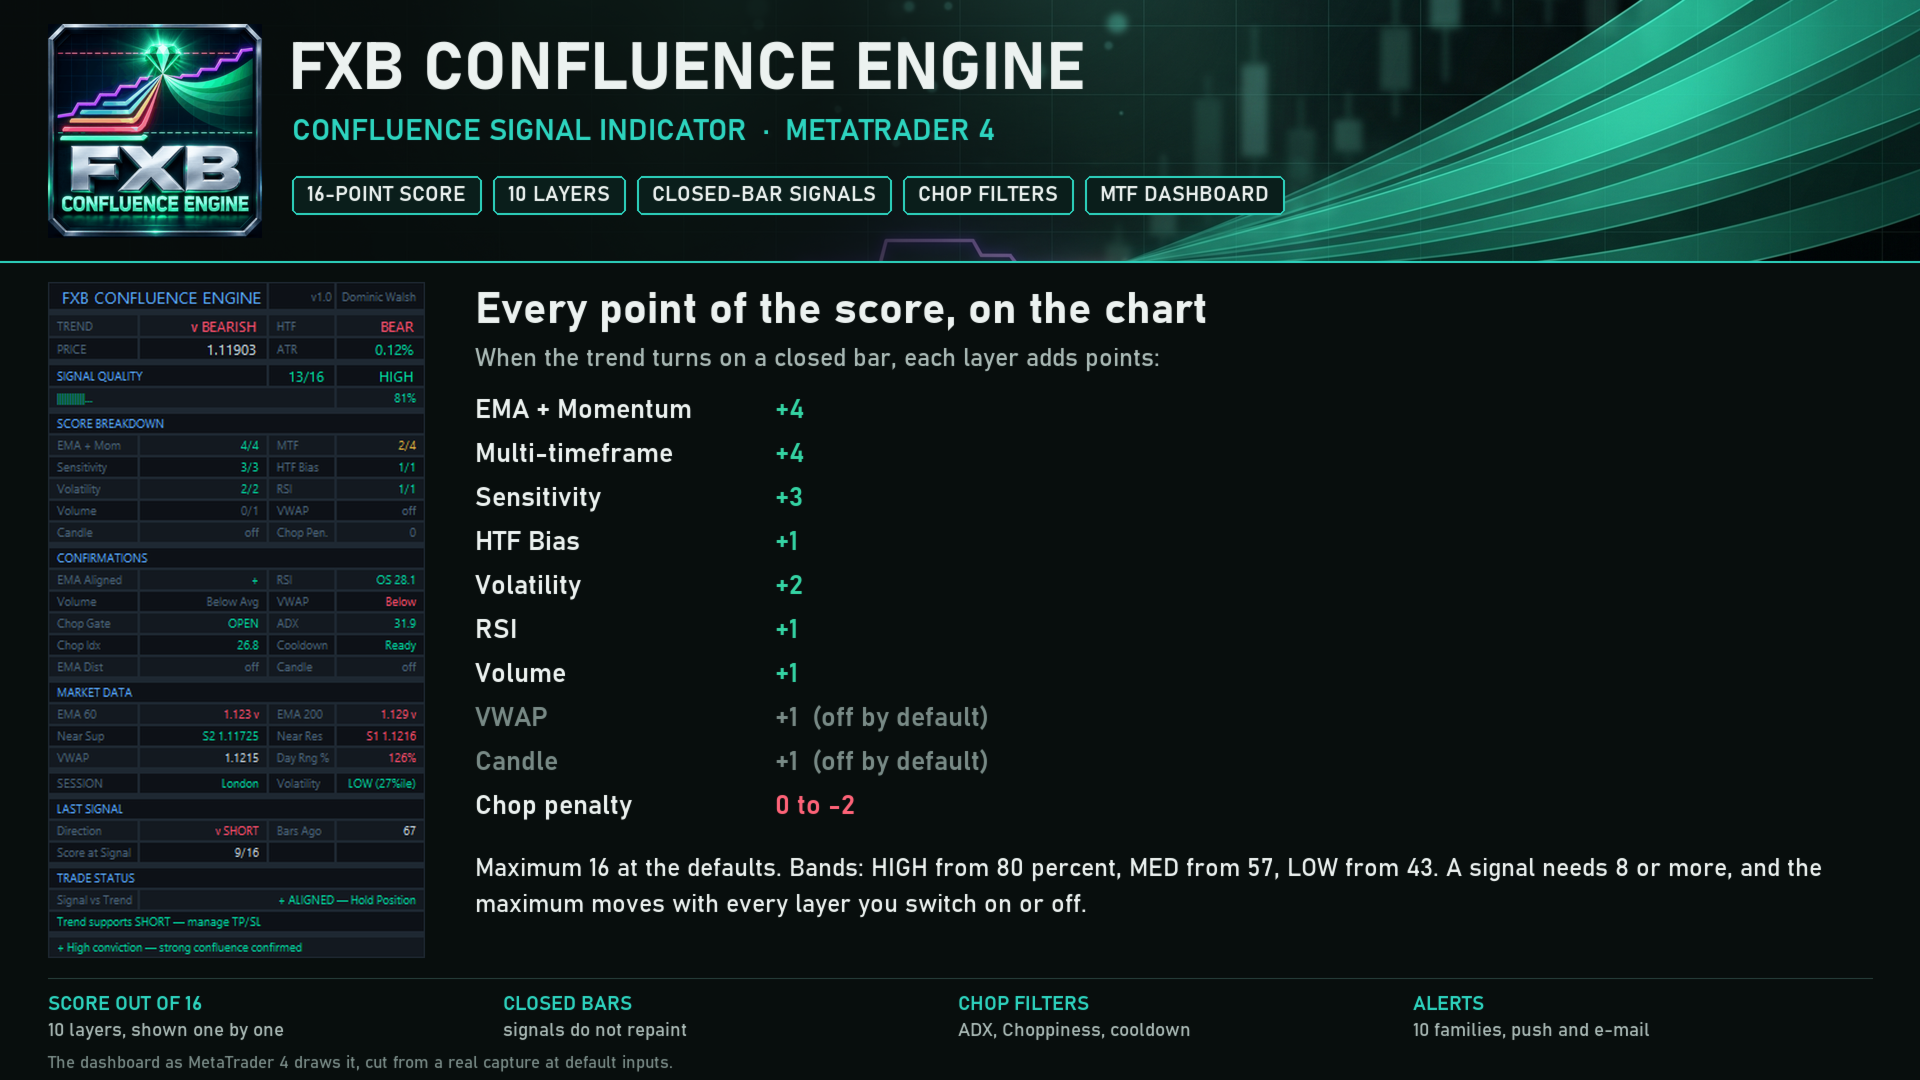
- EMA + Momentum, up to 4 points: fast EMA against slow EMA, price against the fast EMA, and momentum (rate of change over 5, 10 and 20 bars) agreeing with the trend.
- Multi-timeframe, up to 4 points: how many of M5, M15, H1 and H4 agree with the trend on this chart.
- Sensitivity, up to 3 points: the same filter at sensitivity 12 (two points) and 16 (one point) agreeing.
- HTF Bias, up to 1 point: the higher timeframe agreeing.
- Volatility, up to 2 points: volatility not stretched, one point each when ATR and ATR as a share of price are not at the top of their last 60 bars.
- RSI, up to 1 point: RSI on the trend's side of its threshold.
- Volume, up to 1 point: volume at or above its average.
- VWAP, up to 1 point: price on the trend's side of VWAP (off by default).
- Candle, up to 1 point: an engulfing or strong-body candle (off by default).
- Chop penalty, up to minus 2: one point off when ADX is below its threshold, one when the Choppiness Index is above its maximum.
At the defaults VWAP and Candle are off, so the maximum is 16. A layer you switch off is removed from the maximum as well. The score is shown with a band: HIGH from 80 percent of the maximum, MED from 57, LOW from 43, WEAK below.
THE FILTERS
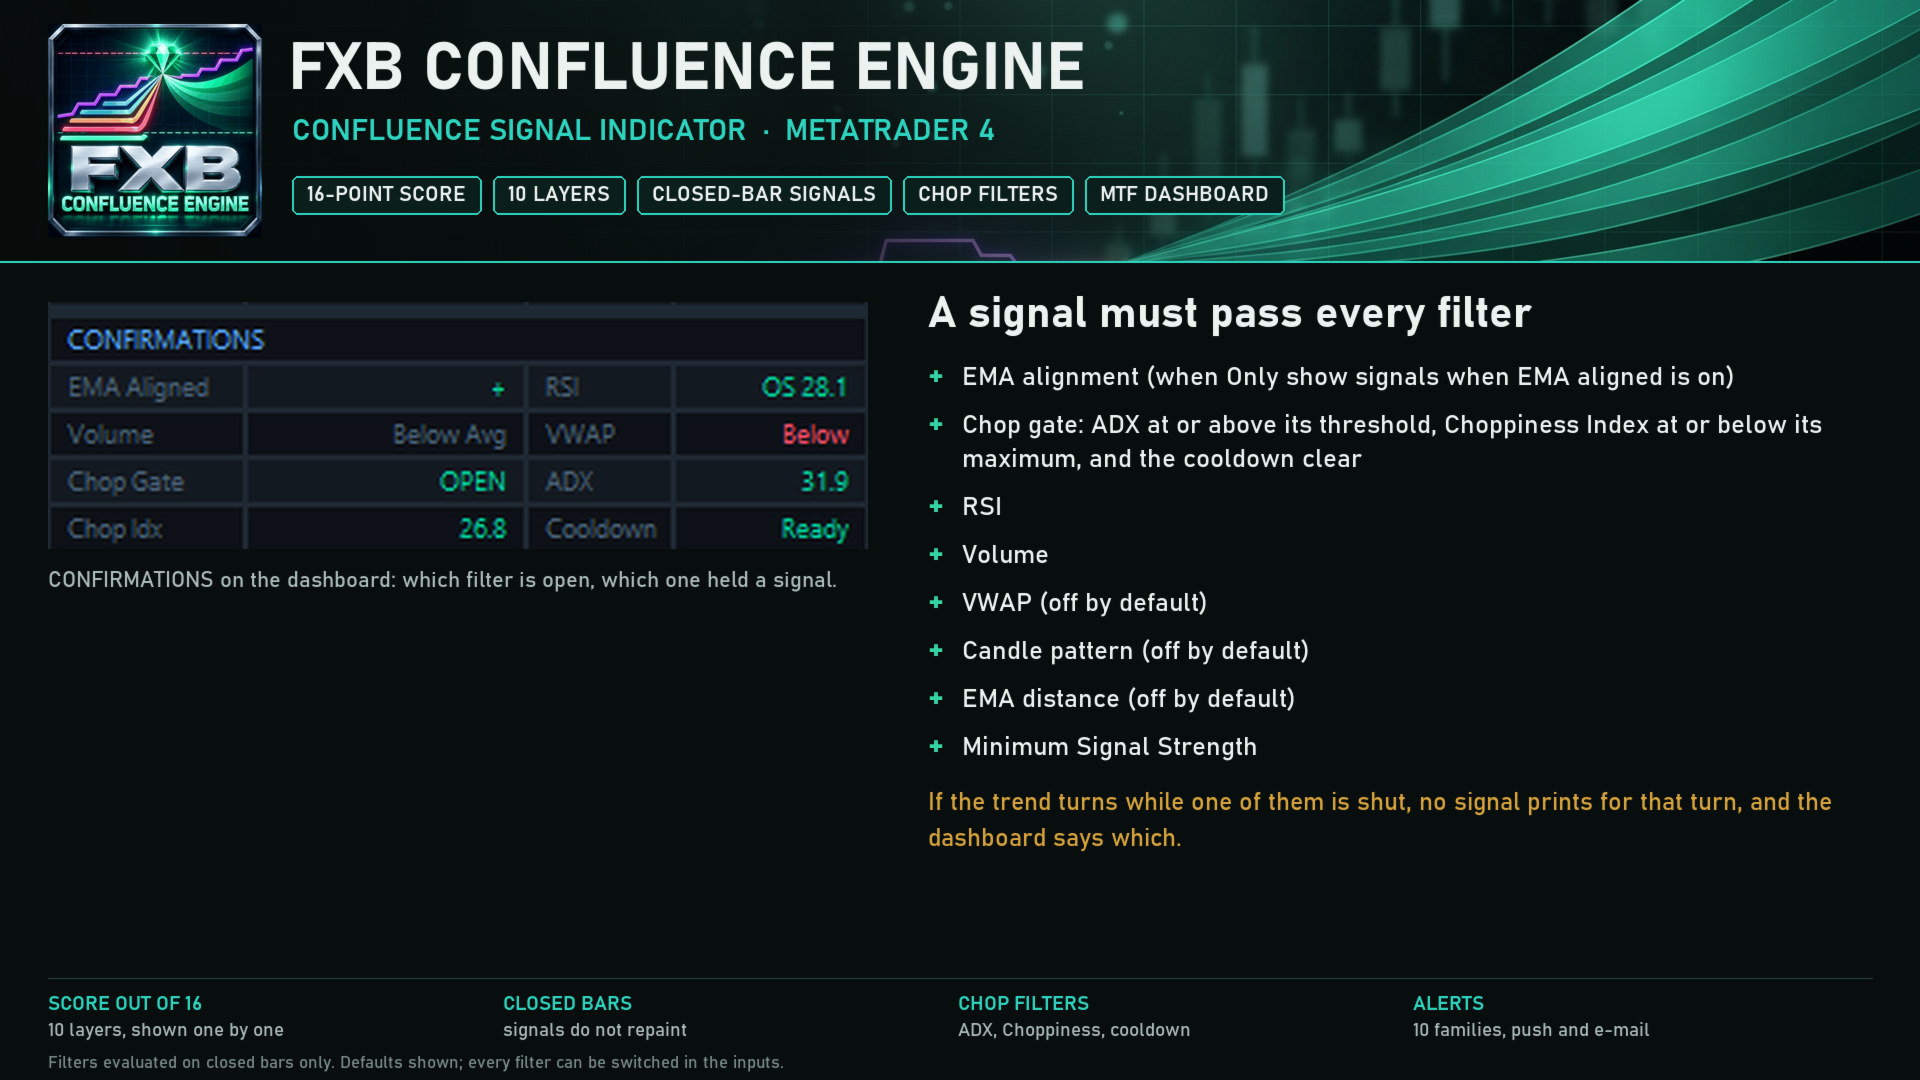
At the defaults a BUY needs all of these on the closed bar, and a SELL the mirror image:
- Full EMA alignment: the fast EMA (60) above the slow EMA (200), price above the fast EMA and the fast EMA rising.
- A trending market: ADX at or above 20.0 and the Choppiness Index at or below 61.8.
- A cooldown: at least 5 bars since the last signal.
- RSI at or above 50.0 (at or below 50.0 for a SELL).
- Volume at or above its 20-bar average.
- A score of 8 or more.
- Optional and off by default: VWAP side, an engulfing or strong-body candle, and a maximum distance from the fast EMA.
ON THE CHART
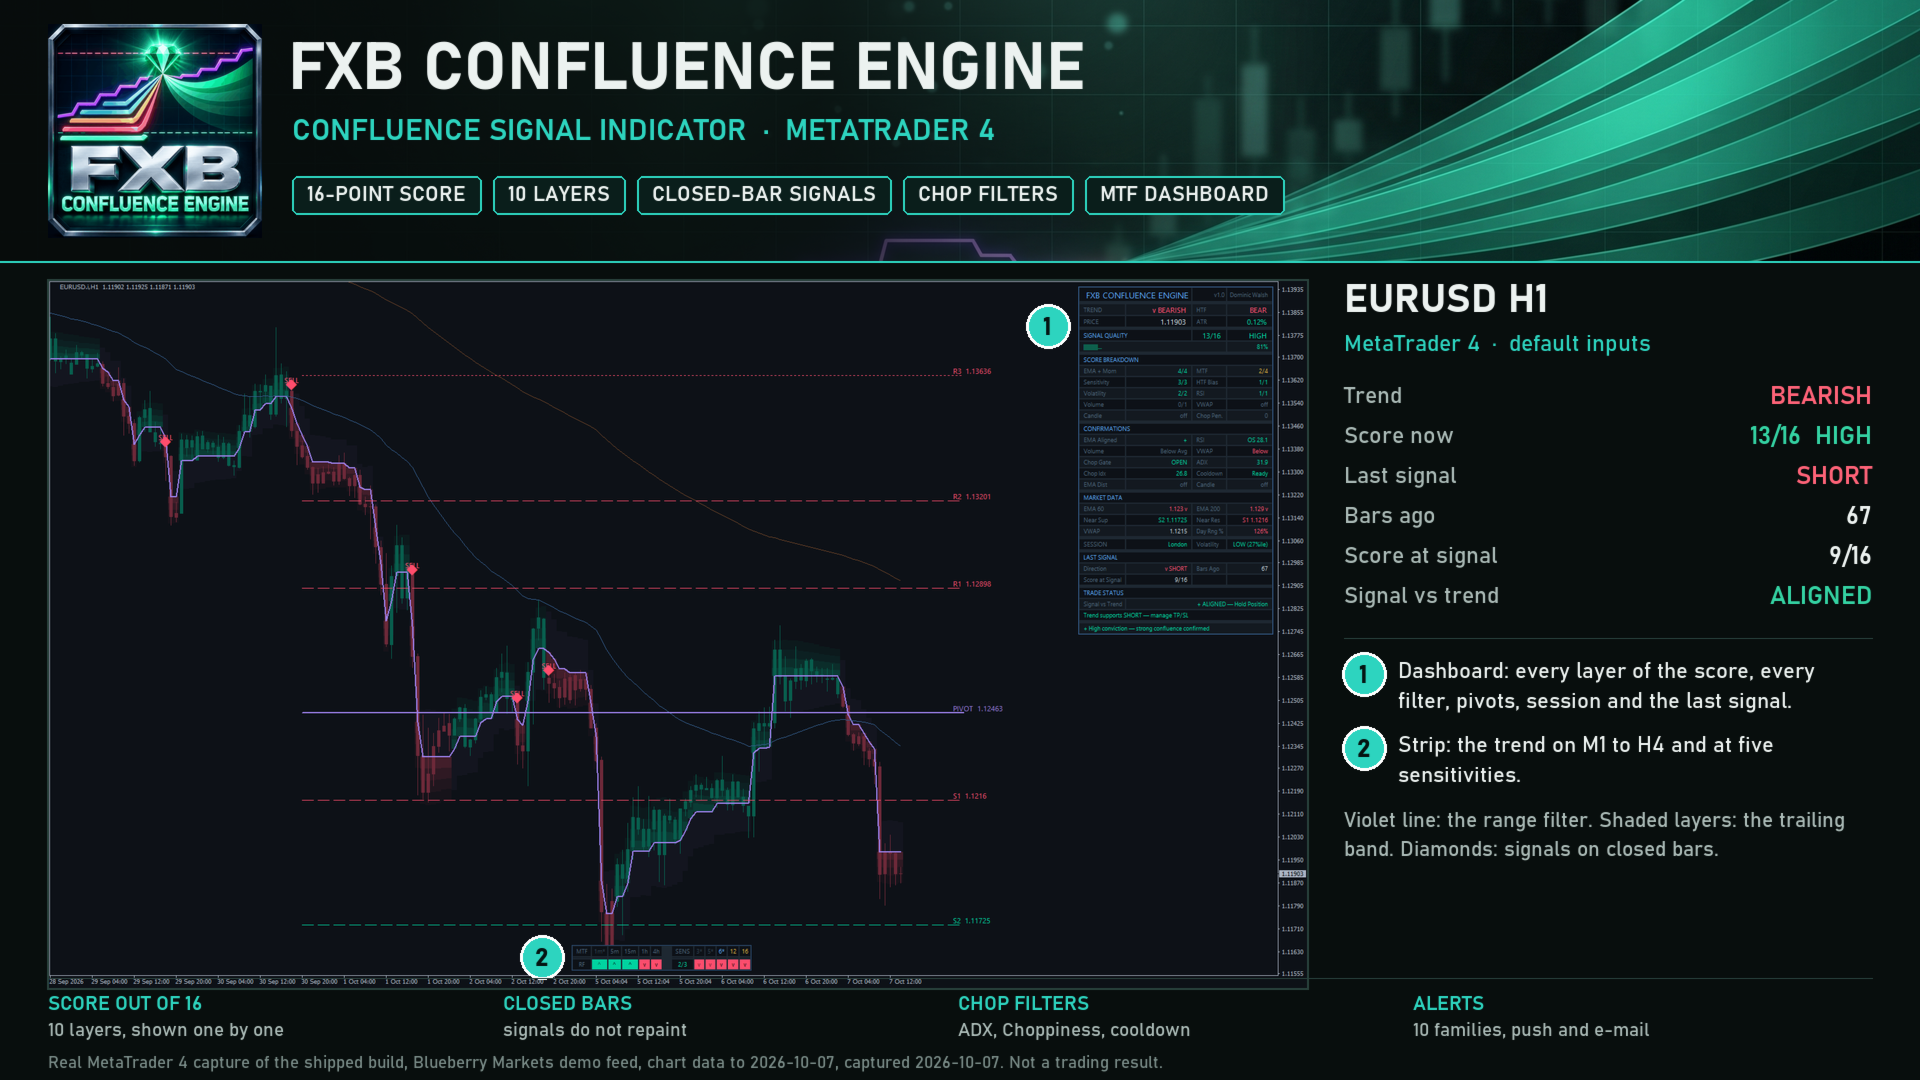
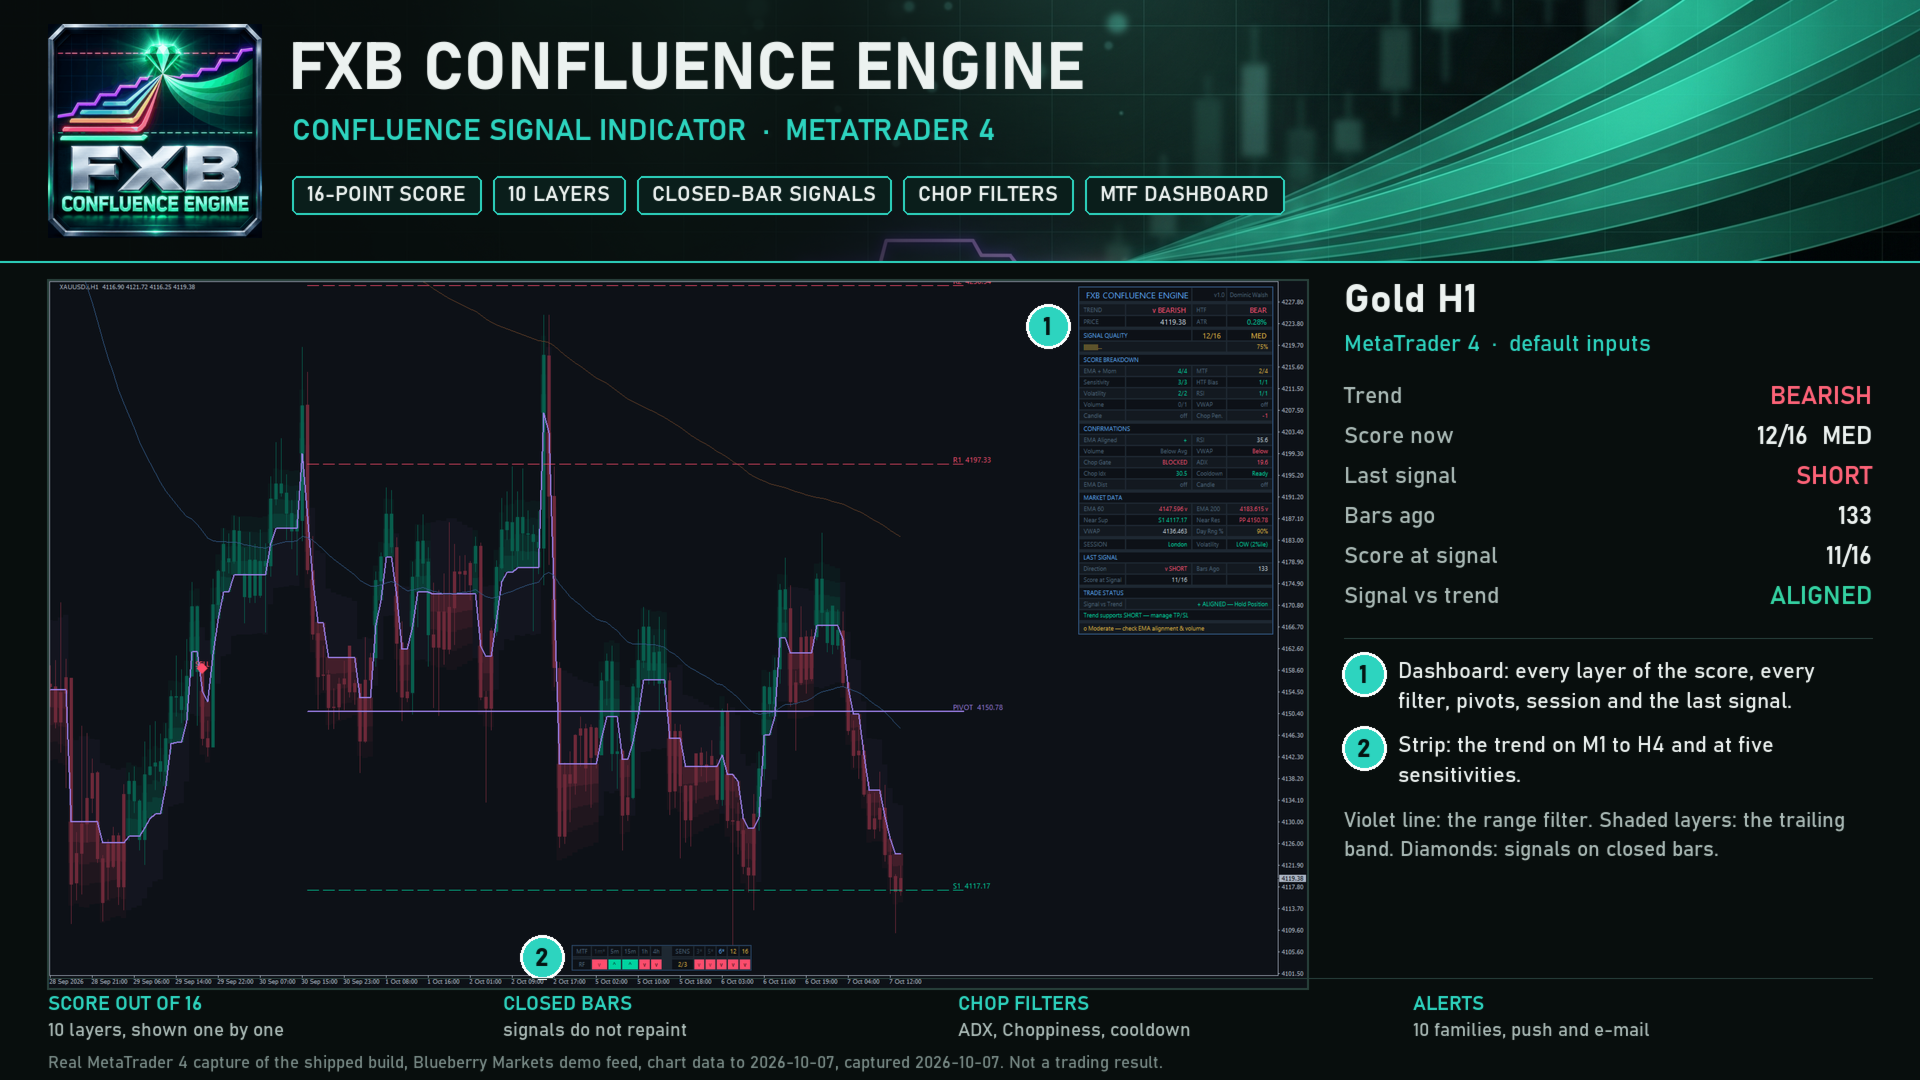
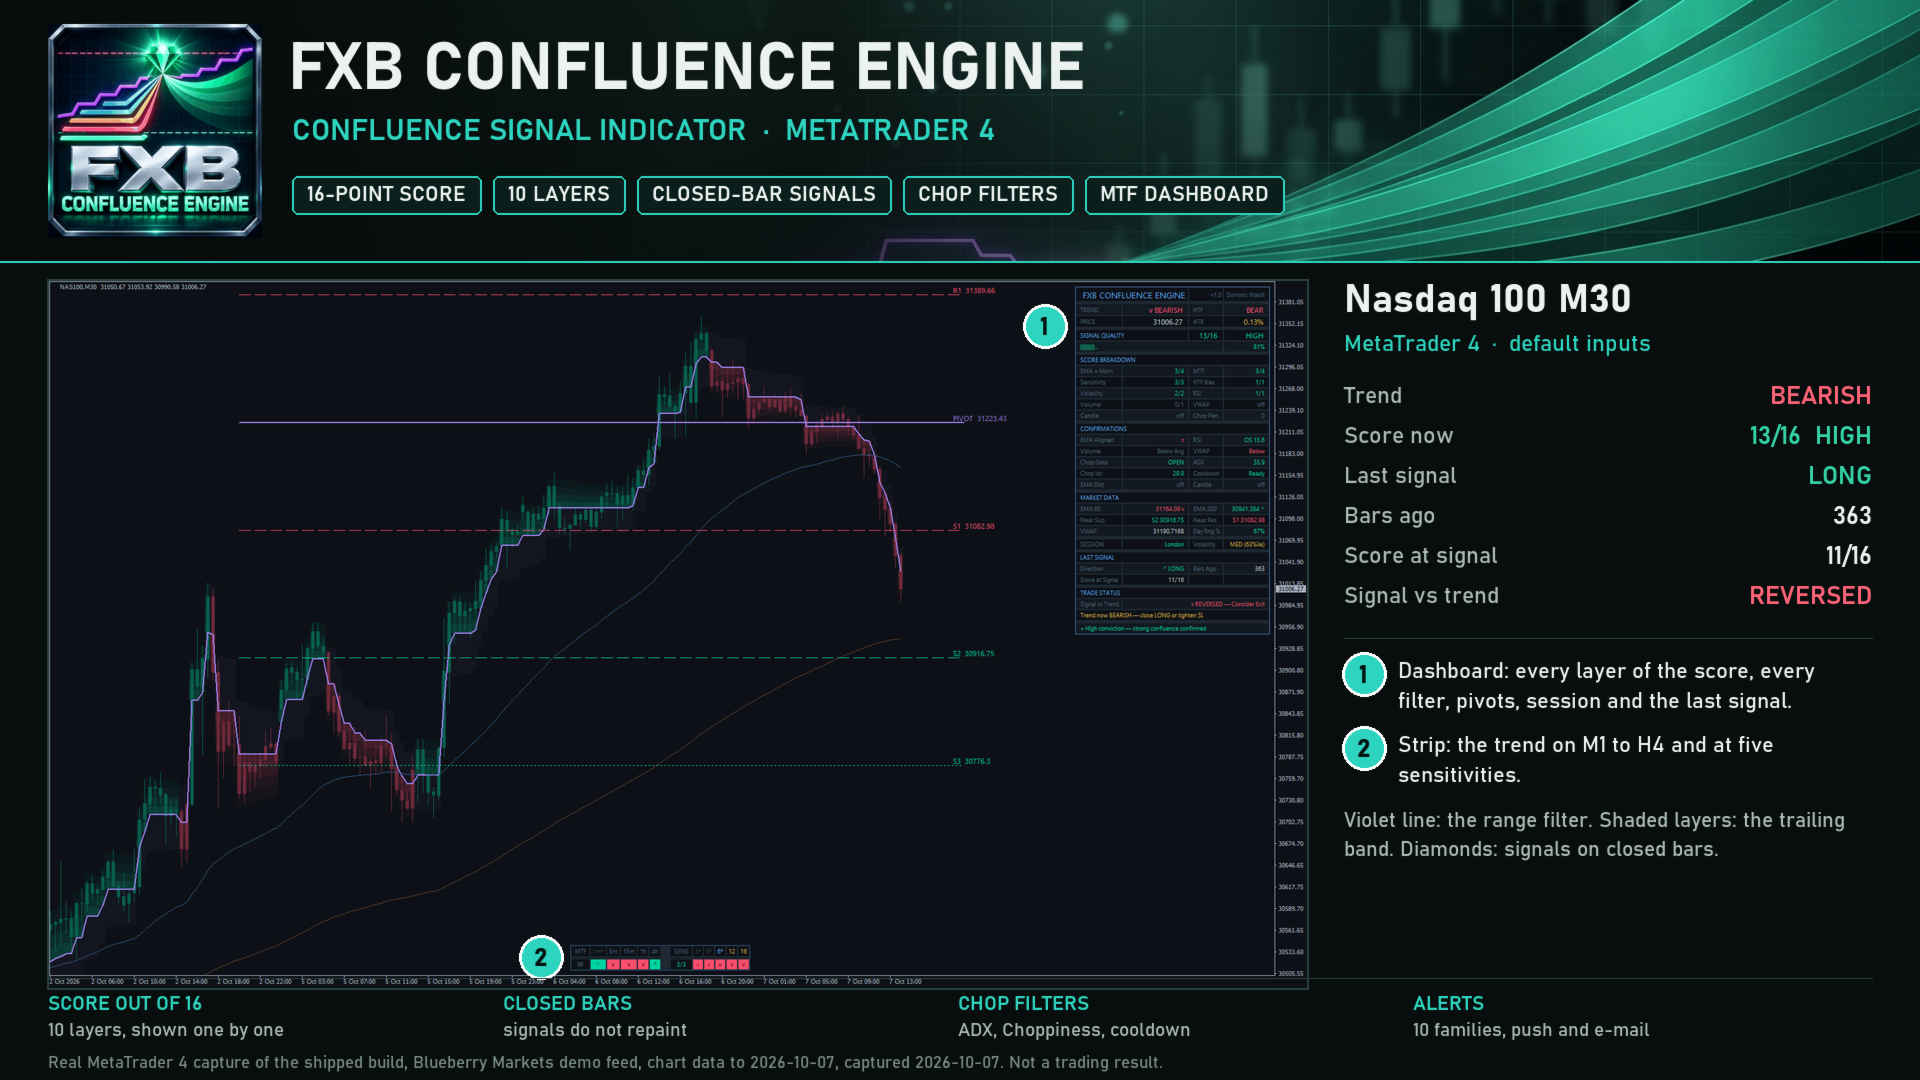
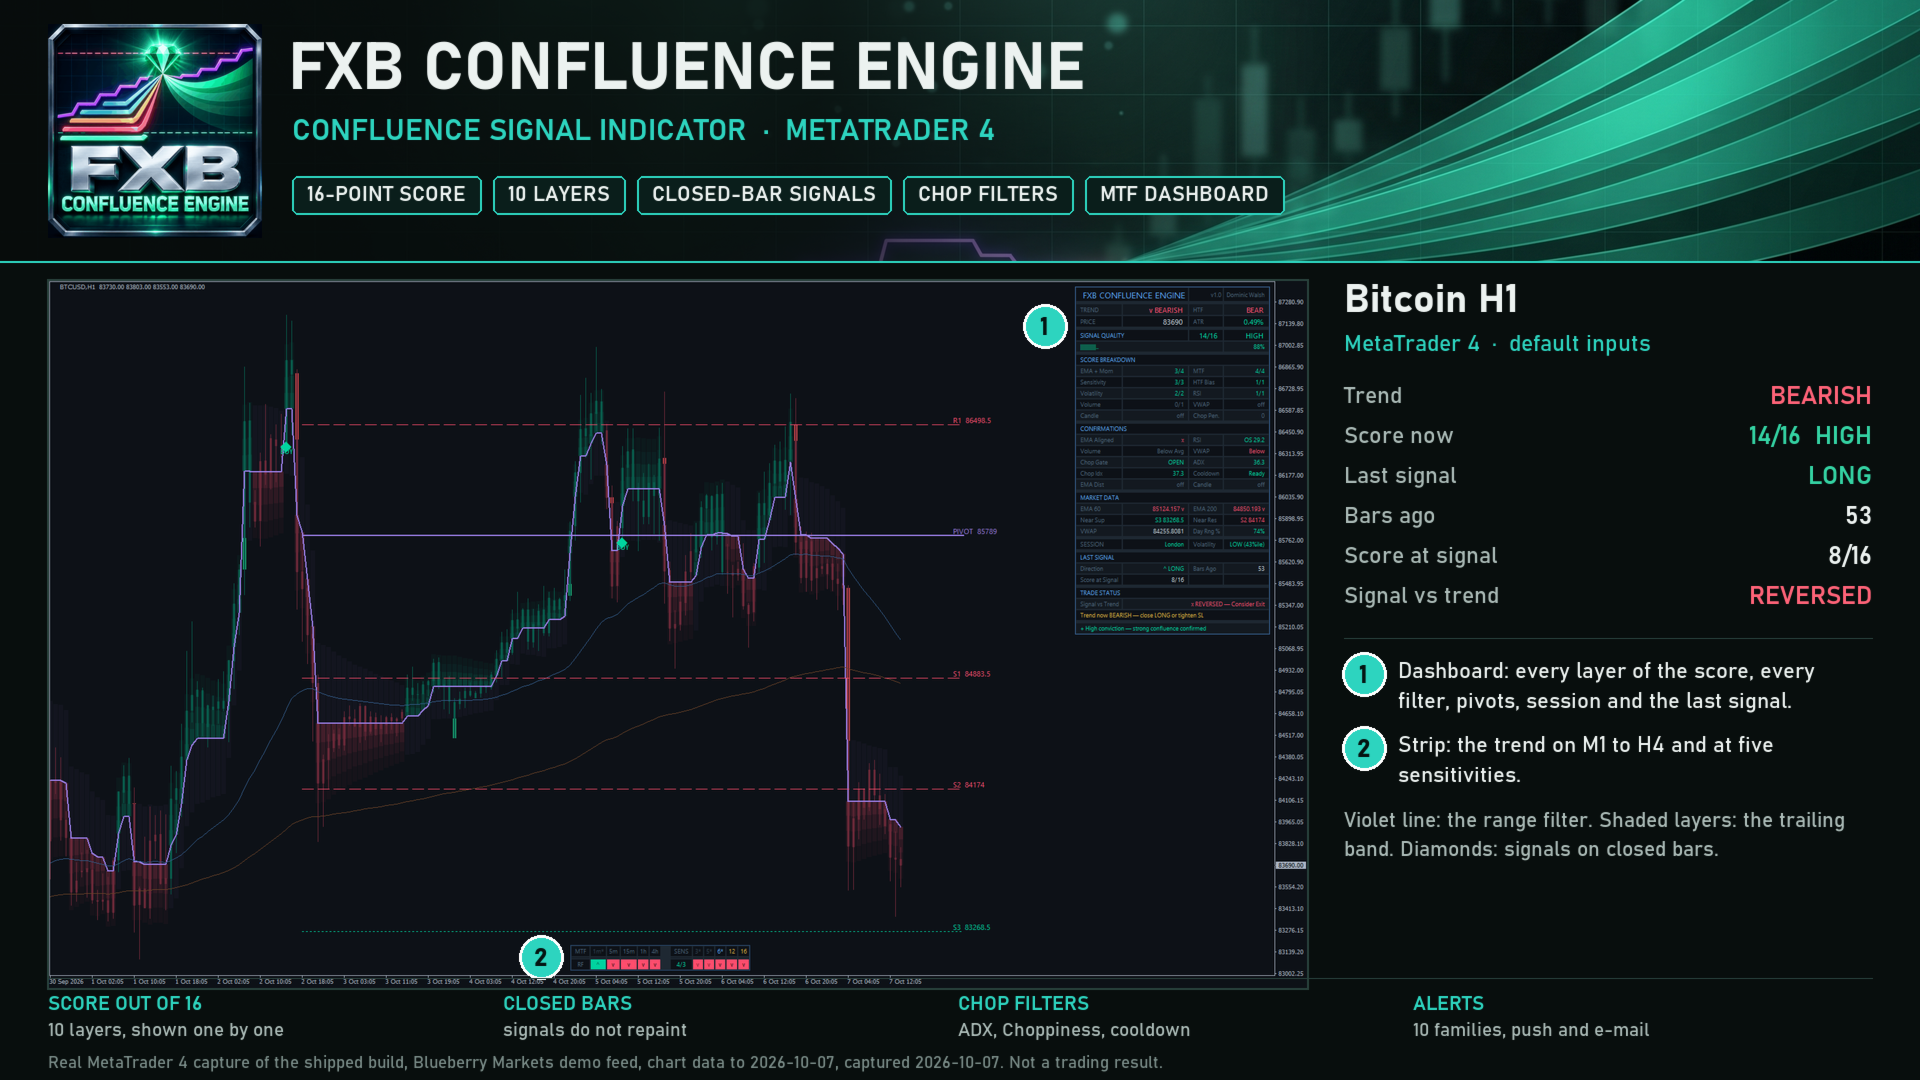
- The range-filter line with a four-layer trailing band, and candles coloured by the trend.
- The fast and slow EMAs.
- A diamond and BUY or SELL text on every signal bar; optional score labels such as BUY 11/16.
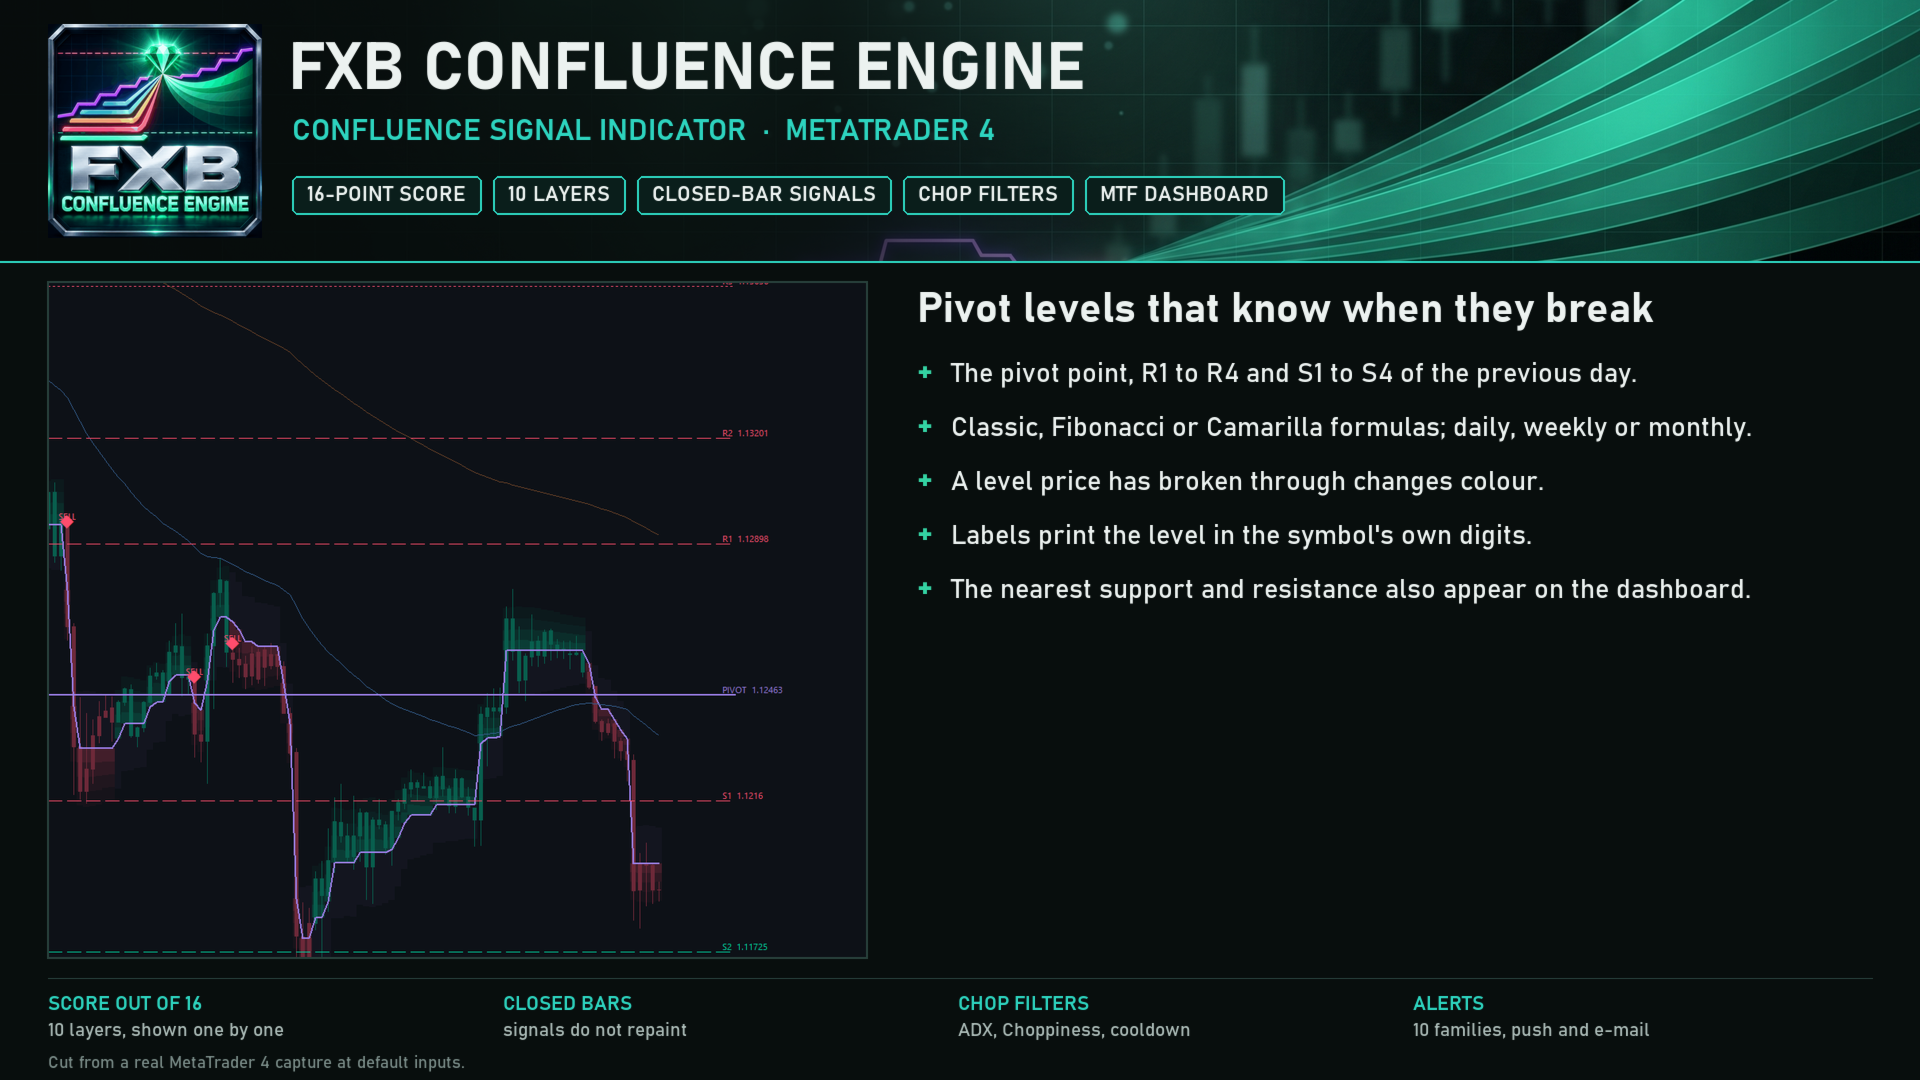
- Pivot levels of the previous day, week or month (Classic, Fibonacci or Camarilla), R1 to R4 and S1 to S4, recoloured once broken, with labels in the symbol's own digits.
- A dashboard: trend and higher-timeframe bias, price and ATR, the score with its band and a breakdown by layer, the state of every filter, both EMAs with their slope, the nearest pivot support and resistance, VWAP, the day's range against its average, the session (London, New York, both, Asian or off-hours, in their own time zones) with a volatility percentile, the last signal with its score, and whether the trend still supports it.
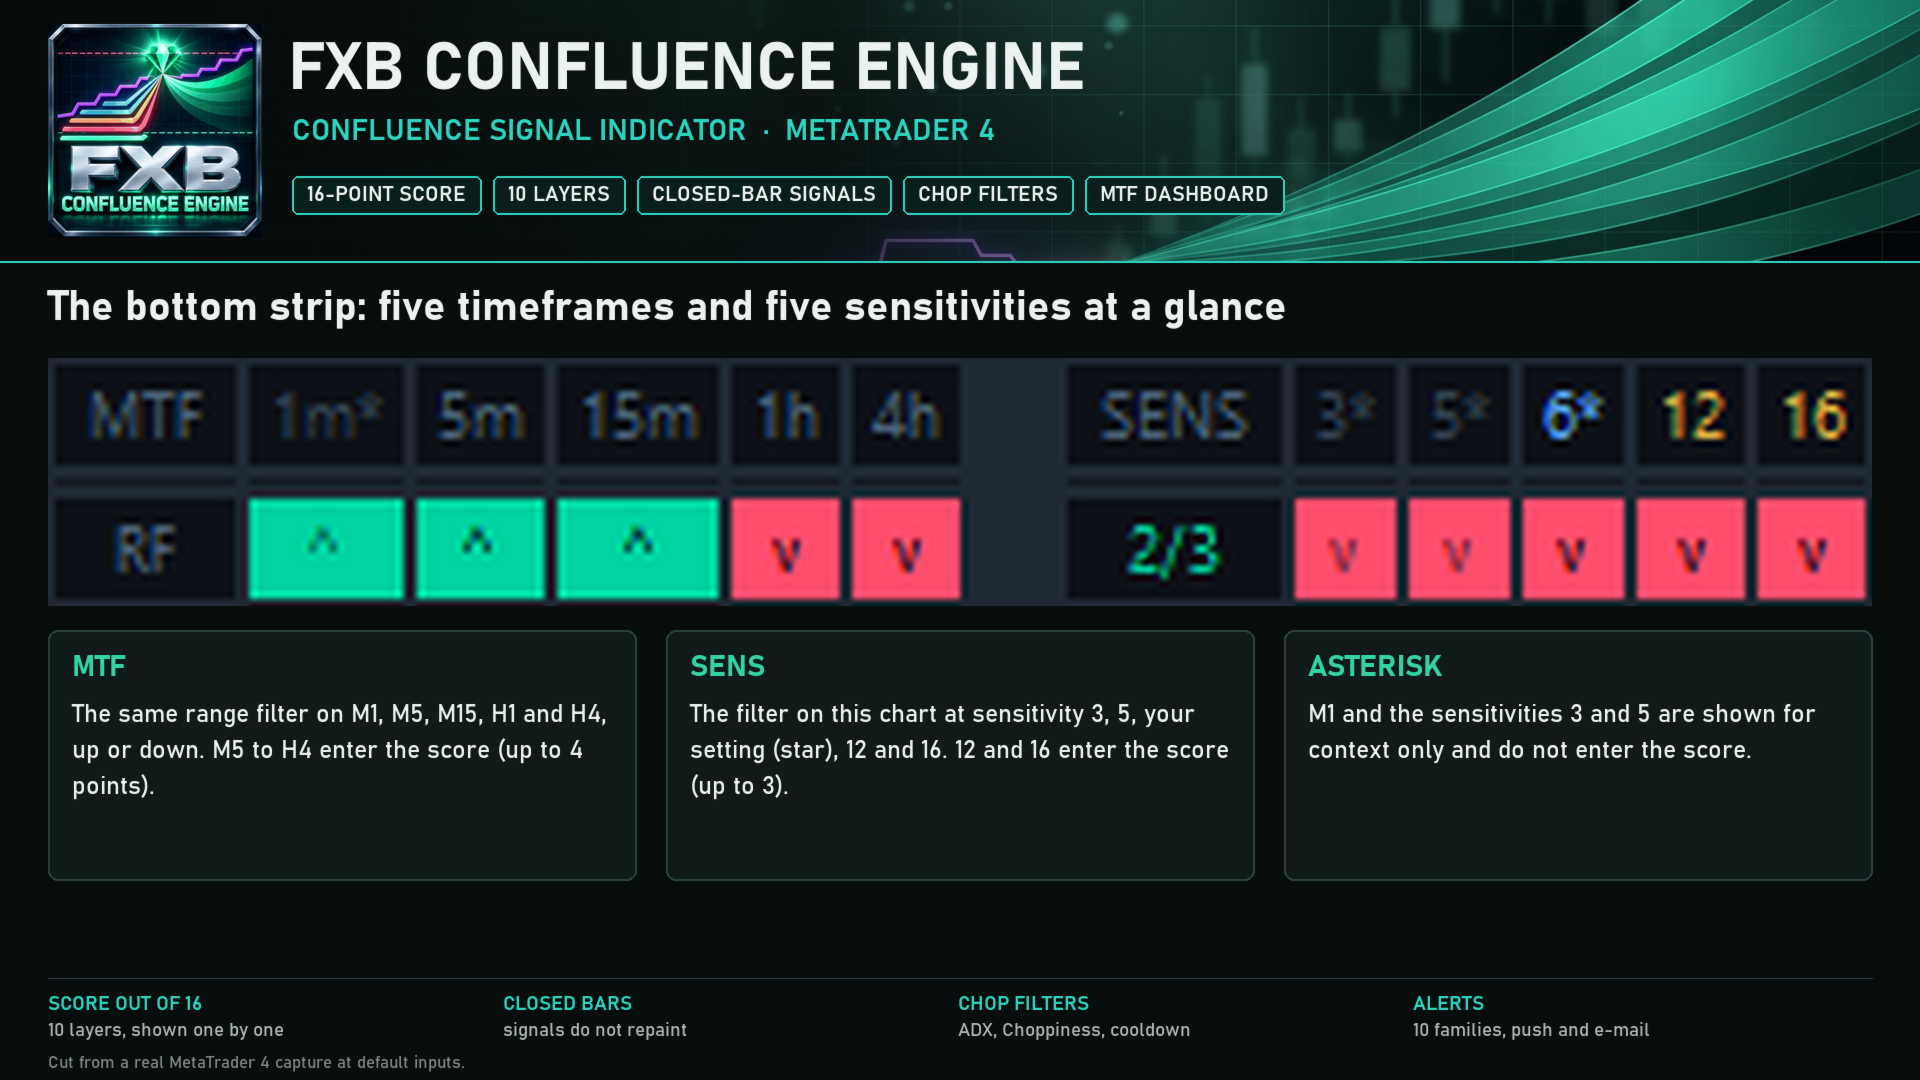
- A bottom strip: the trend on M1, M5, M15, H1 and H4, and the filter at sensitivity 3, 5, your setting, 12 and 16.
- Dark and Light themes. Every colour is blended over your chart background.
ALERTS
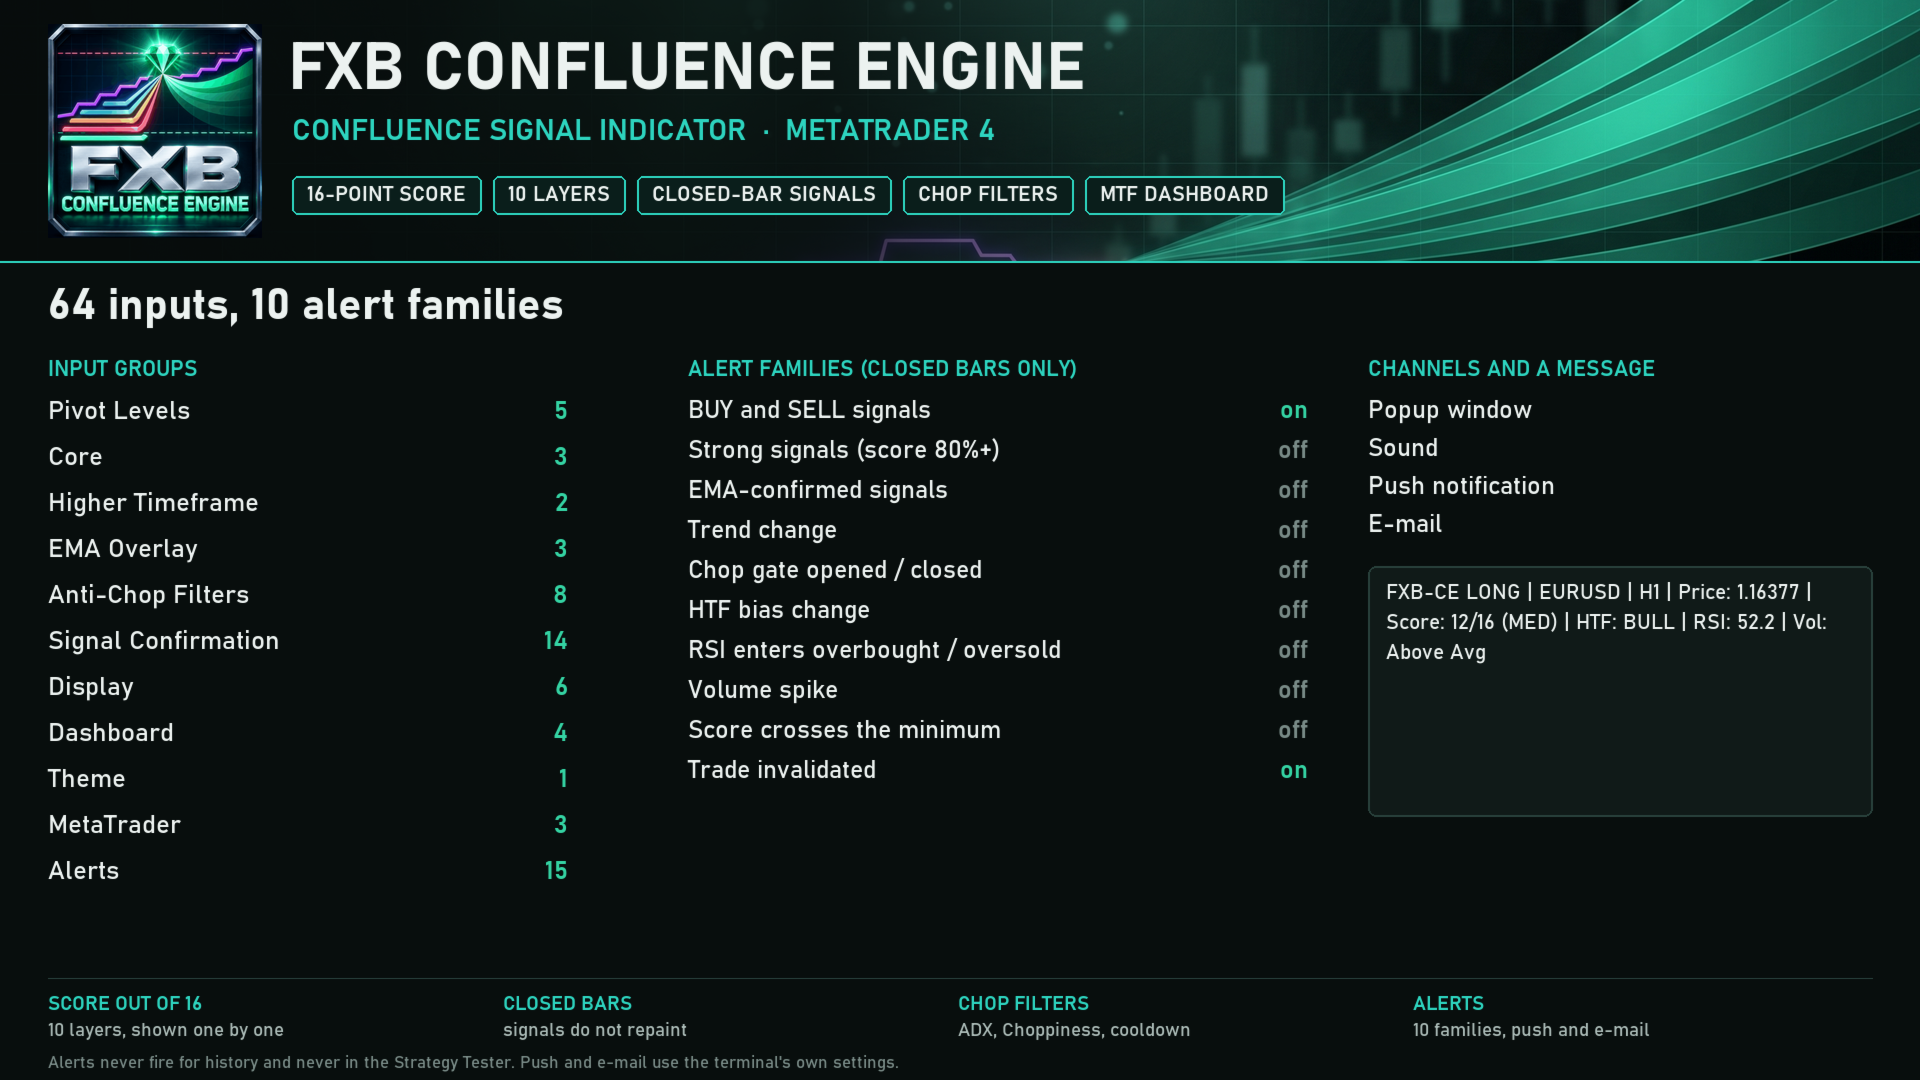
Ten families, each with popup, sound, push notification and e-mail switches. They are: BUY and SELL signals; Strong signals (score 80%+); EMA-confirmed signals; Trend change; Chop gate opened / closed; HTF bias change; RSI enters overbought / oversold; Volume spike; Score crosses the minimum; Trade invalidated. Signals and Trade Invalidated are on by default, as popups. Every alert is evaluated on a closed bar, fires once for that bar, and never fires for history or in the Strategy Tester. A signal alert carries the context in one line:
FXB-CE LONG | EURUSD | H1 | Price: 1.16377 | Score: 12/16 (MED) | HTF: BULL | RSI: 52.2 | Vol: Above Avg
HOW OFTEN IT FIRES
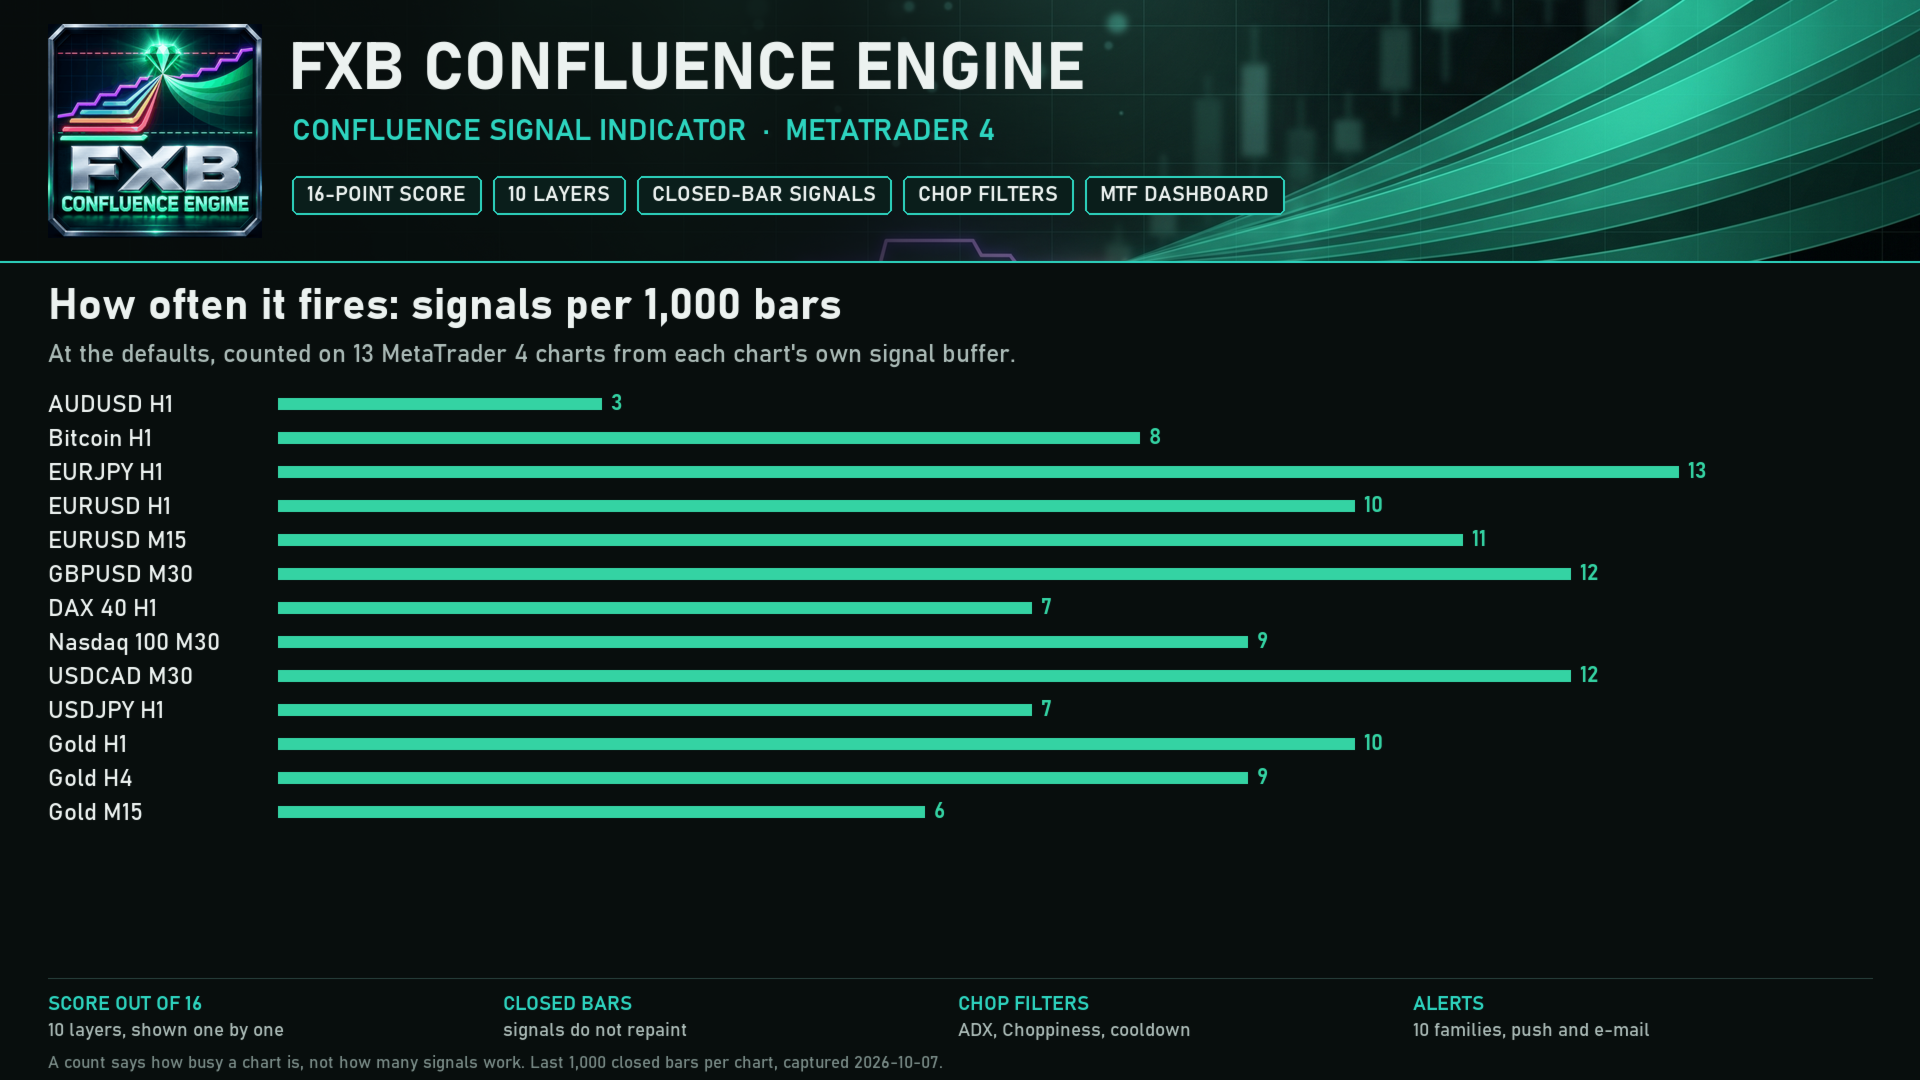
On the last 1,000 closed bars of 13 MetaTrader 4 charts across forex, gold, indices and crypto, the defaults gave 3 to 13 signals. That is the design: fewer signals, each with the trend, the EMAs and the score behind it. A count says how busy a chart will be, not how many signals work.
WHAT IT DOES NOT DO
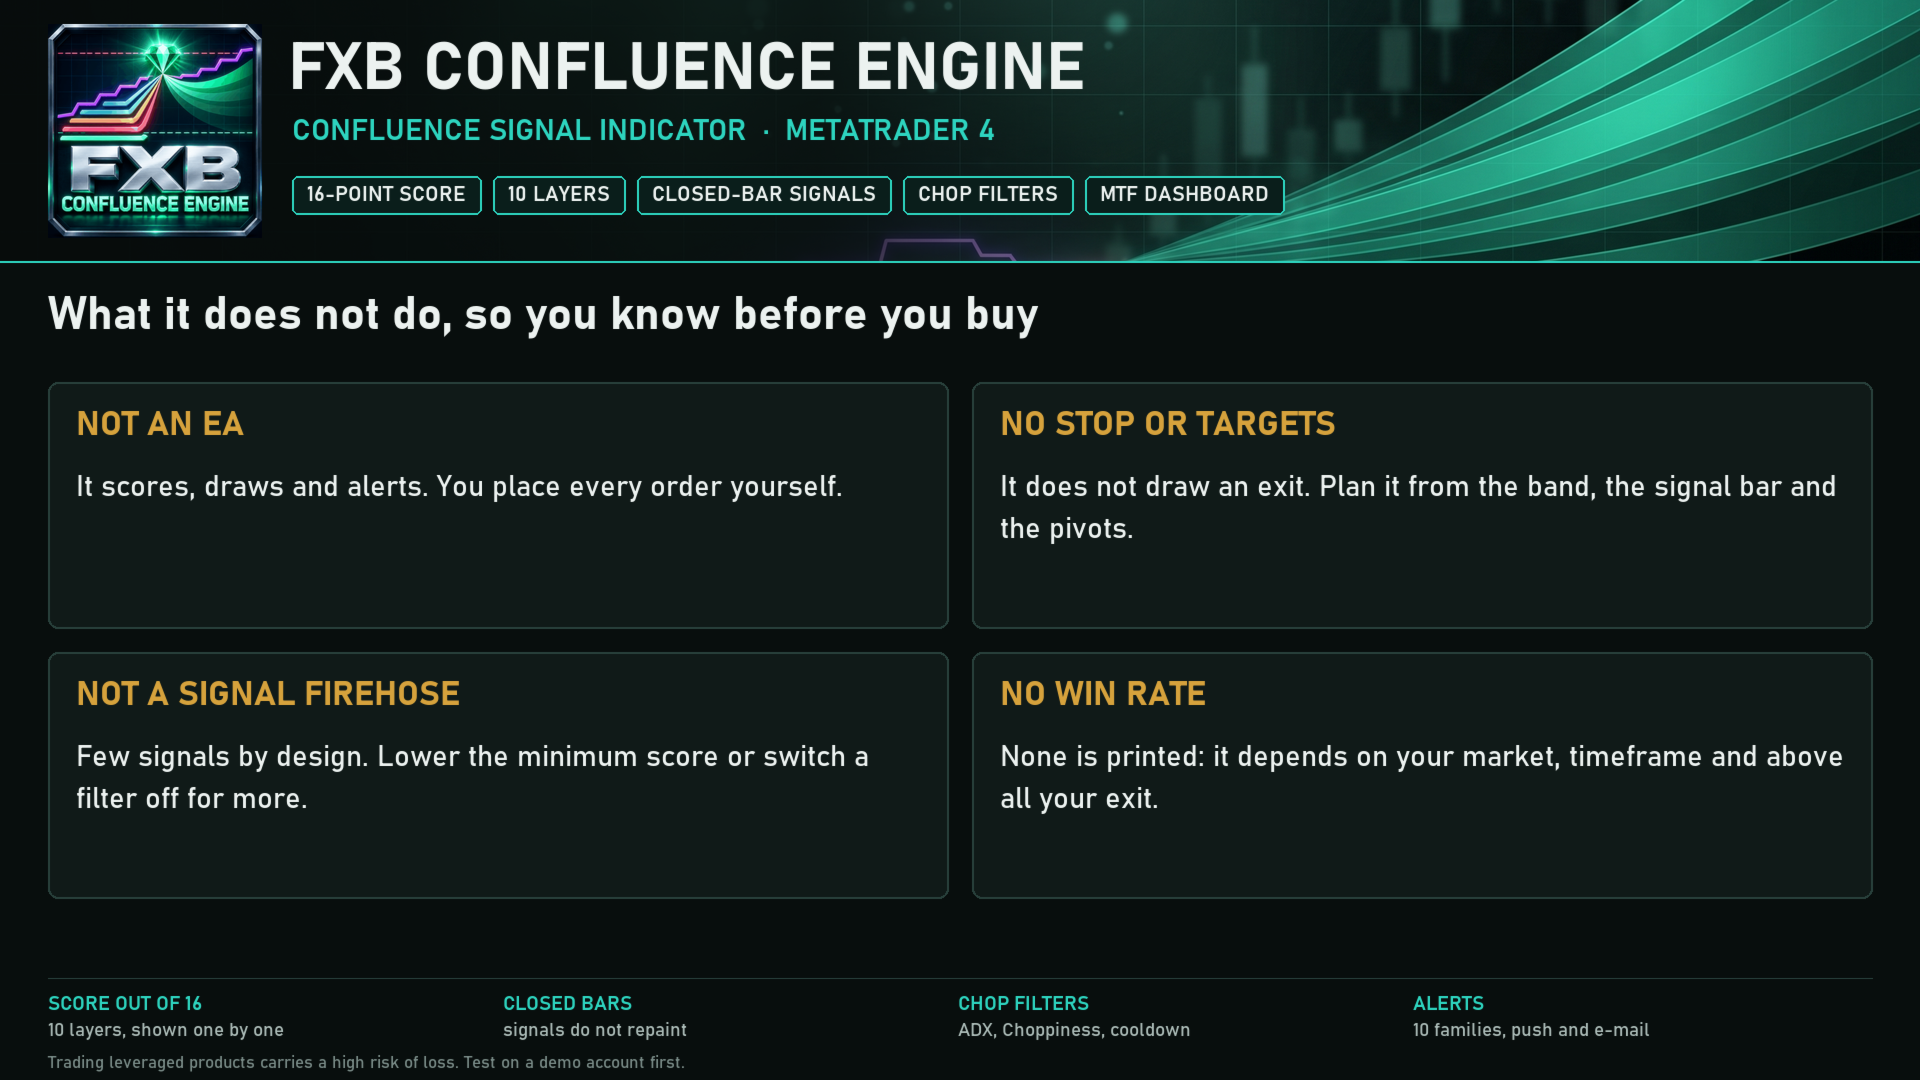
- It does not place trades. It scores, draws and alerts; you place and manage every order.
- It does not draw a stop loss or targets. Plan the exit yourself: the filter line, the band, the signal bar's extreme and the nearest pivot level are the natural references, and the Trade Invalidated alert tells you when the trend turns against the last signal.
- It does not print a win rate. Results depend on the market, the timeframe and above all on your exit.
SETTINGS AND NOTES
- 64 inputs in 11 groups, each explained in the manual. Recommended timeframes M5 to H4; it runs from M1 to monthly.
- Volume on most MetaTrader forex and CFD symbols is tick volume, which is what the volume layer uses.
- Server time zone is used only for the session row. Auto reads the broker clock; fixed offsets are available.
- Bars to calculate (5000 by default) keeps loading fast on long charts.
- If your broker serves no one-minute history, only the M1 cell of the strip shows a dash; nothing else changes.
- Signals are decided on closed bars and do not repaint. The filter line, band, candle colour and dashboard follow the forming bar until it closes.
Trading leveraged products carries a high level of risk and may not be suitable for all investors. FXB Confluence Engine is an analysis tool, not financial advice. Test it on a demo account first.