TCL Boll Bands Trader MT4

TCL Boll Bands Trader is a Bollinger Bands indicator for MetaTrader 4 with a multi-mode trend filter, dual-deviation entry levels, volatility subfilters, and an interactive on-chart dashboard.

How It Works

Standard Bollinger Bands signals can produce signals against the dominant move when the underlying market is in a strong trend. This indicator addresses that by checking each potential signal against a configurable trend filter before plotting it, and by adding squeeze, Average Directional Index (ADX), and session filters that can suppress signals under specific volatility and directional conditions.

Components

  1. Dual-Deviation Bollinger Bands — two band layers are plotted: a standard layer at 2.0 standard deviations and an extreme layer at 3.0 standard deviations.
  2. Multi-Mode Trend Filter — three selectable filter modes determine the market bias: Composite (Exponential Moving Average plus Relative Strength Index plus Moving Average Convergence Divergence agreement), EMA Slope (direction of the trend EMA), or Price Position (price above or below the trend EMA). Signals are only plotted when the chosen filter agrees with the proposed direction.
  3. Volatility Subfilters — optional Squeeze and ADX filters suppress signals during low-volatility or weak-direction conditions.
  4. Session Timing — optional session window with Greenwich Mean Time (GMT) and Daylight Saving Time adjustment so signals only appear during selected trading hours.
  5. Stop Loss and Take Profit Visualizer — each signal arrow is drawn with a fixed-pip Stop Loss line and a dynamic Take Profit line targeting the middle band.
  6. Dashboard Panel — on-chart panel showing band positions, RSI value, trend filter state, and session status. Panel position is remembered between sessions.
  7. Clipboard Copy — recent signal details can be copied to the system clipboard with one click for journaling or external use.

Inputs

  • Show Dashboard Panel — toggle the dashboard (default true)
  • Dashboard Location — chart corner (default top-left)
  • Bollinger Bands Period — central baseline period (default 20)
  • Entry Deviation Standard — first band layer multiplier (default 2.0)
  • Entry Deviation Extreme — second band layer multiplier (default 3.0)
  • RSI Period — RSI lookback (default 14)
  • RSI Oversold Level — level for bullish signal trigger (default 30.0)
  • RSI Overbought Level — level for bearish signal trigger (default 70.0)
  • Stop Loss Pips — fixed Stop Loss distance in pips (default 15)
  • Dynamic Take Profit — toggle dynamic Take Profit at middle band (default true)
  • Enable Trend Filter — toggle the trend filter (default true)
  • Trend MA Period — EMA period for trend bias (default 50)
  • Trend RSI Period — trend RSI lookback (default 14)
  • Trend MACD Fast Period — MACD fast EMA (default 12)
  • Trend MACD Slow Period — MACD slow EMA (default 26)
  • Trend MACD Signal Period — MACD signal line (default 9)
  • Popup Alert — enable MetaTrader popup notifications (default true)
  • Push Notification — enable mobile push notifications (default false)
  • Email Alert — enable email notifications (default false)
  • Sound Alert — enable sound notifications (default false)

Compatibility

The indicator works on MetaTrader 4. It is compatible with all instruments and all timeframes. Signal arrows are calculated on the closed bar and are not repainted.

Installation

  1. Download the file from MQL5 Market
  2. Restart MetaTrader if needed
  3. Drag the indicator onto any chart

For questions about parameters or behavior, please use the Comments tab.

Рекомендуем также
RelicusRoad Daily Pivots — индикатор дневных pivot-точек для MetaTrader 4 и MetaTrader 5, который делит диапазон предыдущего дня на уровни Фибоначчи и продлевает их выше и ниже этого диапазона, от минус 100 до плюс 200 процентов. Вместо классических floor pivots предыдущий завершённый диапазон трактуется как шкала, где минимум — это 0%, а максимум — 100%. Девятнадцать уровней выводятся как компактные цветные маркеры у правого края графика, поэтому размер сегодняшнего движения читается как доля и
FREE
Pivot Points Classic and Camarilla рисует классические уровни Pivot (P, R1-R3, S1-S3) и уровни Camarilla (H1-H4, L1-L4) прямо на графике. Уровни рассчитываются по High, Low и Close предыдущего периода выбранного таймфрейма (по умолчанию D1), и каждый период рисуется горизонтальной линией на протяжении того периода, к которому он относится, поэтому видно, как цена реагировала на уровни в предыдущие дни, недели или месяцы. Возможности Классические пивоты - центральный пивот P с тремя уровнями сопр
FREE
BeST_ Classic Pivot Points is an MT4 Indicator that is based on the widely known and definitely classic Pivot Point of a market prices activity. A pivot point is calculated as an average of significant prices (high,low,close) from the performance of a market in the prior trading period. If the market in the following period trades above the pivot point it is usually evaluated as a bullish sentiment, whereas trading below the pivot point is seen as bearish. A pivot point and the associated suppo
FREE
Indicator support for only: Entry Point to Trend Pro Link indicator  support   :   https://www.mql5.com/en/market/product/70867 Supports all currency pairs declared in the definition. Help investors do not need to open many charts. Notice the DEAL:  multiple time frames confluence   M15, H1, H4. Entry Point to Trend Pro The indicator helps investors to identify the earliest and perfect reversal point. Easy to make decision to trade with the trend   Price action trading. support resistance an
FREE
Rainbow MT4 is a technical indicator based on Moving average with period 34 and very easy to use. When price crosses above MA and MA changes color to green, it’s a signal to buy. When price crosses below MA and MA changes color to red, it’s a signal to sell. The Expert advisor ( Rainbow EA MT4) based on Rainbow MT4 indicator, as you can see in the short video below is now available here .
FREE
Now free. The key Fibonacci pivot levels, drawn for you automatically every day, on any timeframe. Automatic Fibonacci Pivots calculates the daily support and resistance from the Fibonacci sequence and plots them clean on your chart: the daily pivot, S1/S2/S3 below and R1/R2/R3 above. These are the price zones where the market tends to react, bounce or break, and now you see them without drawing a single line. What it does: - Daily Fibonacci pivot levels (pivot, S1/S2/S3, R1/R2/R3), updated
FREE
5/35 Oscillator to be used with our Elliott Wave Indicator as part of the overall strategy on trading the 5th wave. The Elliott Wave Indicator Suite is designed around a simple but effective Swing Trading Strategy. The Indicator Suite is great for Stocks, Futures and Forex trading on multiple timeframes You can find the main Elliott Wave Indicator here  https://www.mql5.com/en/market/product/44034
FREE
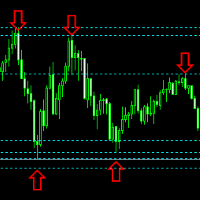
.................................if you need pivot point s levels............................... ............................this is a daily pivot point level creator........................... ...it is for daily pivots and show levels at times period H4 , H1 , M30 , M15 ,M 5... .................................also shows levels for 3 last days.............................. ................can use it with other indicators and see important levels...............
FREE
Полосы VWAP показывают, где находится цена. Algorex VWAP Odds показывает, что это означало в прошлом. Для текущей свечи индикатор учитывает три вещи: время суток в Нью-Йорке, расстояние от сессионного VWAP в сигмах и «свежесть», то есть минуты с последнего касания VWAP. Именно для этой ситуации панель показывает: Возврат к VWAP в течение 2 часов (%) Возврат до конца сессии (%) Среднее время до возврата Heat: насколько дальше от VWAP цена обычно успевает уйти до возврата (среднее и уровень 80 %)
FREE
pivot points using by many traders and pivot levels most of the times are very helpfull . this indicator is a custom with internal parameters. it can show two times pivot (weekly and daily). you can choose periods total for each time showing pivots.( 1 week , 2 week ,...1day , 2day ,...) when use weekly and daily pivots , it can show you many support and resistance zones. if have proposal comment too me for upgrading indicator.
FREE
Liquidity Grab X — Liquidity Sweep & Grab Detector (MT4 & MT5) Liquidity Grab X automatically detects buyside and sellside liquidity sweeps (stop-hunts) at swing pivots and classifies each grab by strength — helping you spot exhaustion moves and potential reversal zones in real time, with instant push notifications to your phone. Full Description Liquidity Grab X is a free rule-based indicator for MetaTrader 4 and MetaTrader 5 that identifies liquidity grabs — moments where price sweeps above a
FREE
Free automatic fibonacci - это индикатор, который автоматически строит коррекции Фибоначчи, основываясь на количестве баров, выбранных в параметре BarsToScan. Линии Фибоначчи автоматически обновляются в реальном времени при появлении новых максимальных и минимальных значений среди выбранных баров. В настройках индикатора можно выбрать уровни, значения которых будут отображены. Также можно выбрать цвет уровней, что позволяет трейдеру прикреплять индикатор несколько раз с разными настройками и цве
FREE
We Trade Live Trend Levels  This indicator is a fantastic addition to the We Trade Live Trend Max this helps filter out noise and helps with better entries into a trade this add on is a must have and we use it all the time along side We Trade Live Trend Max this is a fantastic tool to help with entering a trade and exiting a trade,  This indicator Calculates  Volume strength  indicating levels of support and resistance for a trade, measures momentum in a market making buying or selling into the
FREE
Dual Fibo Auto Pro — профессиональный инструмент технического и волнового анализа, который автоматически находит экстремумы цены с помощью улучшенного зигзага и распределяет по ним две независимые сетки Фибоначчи с использованием интеллектуального алгоритма. Первая сетка отображает текущее направление движения цены относительно последнего завершённого свинга зигзага. Вторая сетка автоматически выбирает в истории свинг, оказывающий наибольшее влияние на текущую рыночную ситуацию (импульсы, резкие
FREE
STRUCTURAL TREND LINES - MT4 Indicator Simple indicator that automatically draws trend lines based on market structure. Features: - 3 degrees of structure detection (short, medium, long term) - Configurable swing strength for each degree - Single color per degree for clean visualization - Adjustable number of lines per degree - Customizable colors and line widths How it works: The indicator identifies swing highs and lows based on the strength parameter, then connects these points to create t
FREE
.....................................hi....................... ................for showing high s and low s and support and resistanses .....................we have a lot of ways............................... it can be helpful for finding trends , higher highs , higher lows , lower highs , lower lows .......................today i write on of thems.......................... ........................you can enter the number of last support and resistanses .........................and it will dra
FREE
Вы отмечаете зоны предложения и спроса вручную и каждый раз получаете немного другой результат? Этот бесплатный индикатор для MetaTrader 4 строит их по одному фиксированному правилу, которое полностью описано ниже, поэтому вы можете проверить каждую зону сами. Идея: сильная свеча (тело не меньше X x ATR) оставляет непосредственно перед собой "базу" из 1-10 маленьких свечей. Бычья сильная свеча, закрывшаяся выше базы, превращает её в зону спроса; медвежья, закрывшаяся ниже базы, - в зону предлож
FREE
Market Profile 3
Hussien Abdeltwab Hussien Ryad
3 (2)
Market Profile 3 MetaTrader 4 indicator  — is a classic Market Profile implementation that can show the price density over time, outlining the most important price levels, value area, and control value of a given trading session. This indicator can be attached to timeframes between M1 and D1 and will show the Market Profile for daily, weekly, monthly, or even intraday sessions. Lower timeframes offer higher precision. Higher timeframes are recommended for better visibility. It is also possible t
FREE
Расширенная версия   индикатора   для визуализации временных диапазонов ключевых торговых сессий: Азиатской, Европейской и Американской. Основным преимуществом данного индикатора является автоматическое построение профиля цены на торговую сессию.  Индикатор обладает функционалом настройки времени начала и окончания каждой торговой сессии, а также автоматическим определением временной зоны торгового сервера. Индикатора включают возможность работы с минимальной загрузкой процессора и экономии опер
FREE
The selective pin bar is designed to identify reversals. To use the selective pin bar effectively, traders typically look for Strong Rejection: The tail of the pin bar should extend significantly beyond the surrounding price action. It indicates that there was a sharp rejection of higher or lower prices during the trading period. A strong rejection suggests that the market sentiment may be changing.
FREE
Absolute Bands
Aleksey Ivanov
4.67 (3)
Принципы построения индикатора.               Индикатор Absolute Bands ( AB ) напоминает своим видом и функциями индикатор Bollinger Bands , но только более эффективен для торговли из-за существенно меньшего количества выдаваемых им ложных сигналов, что обусловлено его более робастным характером.               В индикаторе Bollinger Bands по обе стороны от скользящего среднего – Ma откладываются среднеквадратичные отклонения Std=Sqrt(<(X- Ma )^2>) (где X   -   история цены, <…> - процедура усред
FREE
БЕСПЛАТНО — точки разворота ZigZag вместе с трендовым фильтром на скользящей средней, нарисованные на одном графике. Индикатор показывает уровни разворотов и контекст тренда, на которых торгует система пробоя пивотов. Настроен под золото (XAUUSD). Полностью бесплатно, без ограничений. Если инструмент занял место на ваших графиках, короткий отзыв поможет нам больше всего — это 30 секунд, и именно так другие трейдеры находят этот инструмент. Платформа: MetaTrader 4 (эта страница). Пробой пивота
FREE
Follow The Line
Oliver Gideon Amofa Appiah
3.94 (16)
FOLLOW THE LINE GET THE FULL VERSION HERE: https://www.mql5.com/en/market/product/36024 This indicator obeys the popular maxim that: "THE TREND IS YOUR FRIEND" It paints a GREEN line for BUY and also paints a RED line for SELL.  It gives alarms and alerts of all kinds. IT DOES NOT REPAINT and can be used for all currency pairs and timeframes. Yes, as easy and simple as that. Even a newbie can use it to make great and reliable trades. NB: For best results, get my other premium indicators for more
FREE
Raymond Cloudy Day Indicator for MT4 – Pivot-Based Reversal and Trend Levels Raymond Cloudy Day Indicator is a pivot-based level indicator for MetaTrader 4 (MT4). It was developed by Ngo The Hung based on Raymond’s original idea and is designed to give a structured view of potential reversal zones, trend extensions and support/resistance levels directly on the chart. The default settings are optimised for XAUUSD on the H1 timeframe, but the indicator can be tested and adjusted for other symbols
Updates 9/12/2023 - If you are looking for the Spock EA, I don't sell it anymore. DM me for more info. 24/10/2023  -  Check out my other products. Starting to roll out some EAs & indicators based on this range. Currently there is no MT5 version. I am using MT4 myself. So I will spend my time mostly to develop more extensive stats for the Stats version and maybe even an EA. But I might  develop a MT5 version. All depends on the demand. Meaning, the more people request it, the bigger the chan
FREE
Are you tired of drawing trendlines every time you're analyzing charts? Or perhaps you would like more consistency in your technical analysis. Then this is for you. This indicator will draw trend lines automatically when dropped on a chart. How it works Works similar to standard deviation channel found on mt4 and mt5. It has 2 parameters: 1. Starting Bar 2. Number of bars for calculation The   starting bar   is the bar which drawing of the trend lines will begin, while the   number of bars for c
FREE
Auto Fibonacci Retracement Indicator — Flexible and Reliable This is not just another Auto Fibonacci Retracement indicator — it’s one of the most flexible and dependable tools available . If you find it useful, please leave a review or comment to support the project. Check out my other helpful tools below: Telegram to MT4 using AI   - AI-Powered Signal Copier Bot Timeframes Trend Scanner    - Scan the trend of assets in difference timeframes with multiple indicators Market Trend Scanner   - Scan
FREE
PZ Penta O MT4
PZ TRADING SLU
2.33 (3)
The Penta-O is a 6-point retracement harmonacci pattern which usually precedes big market movements. Penta-O patterns can expand and repaint quite a bit. To make things easier this indicator implements a twist: it waits for a donchian breakout in the right direction before signaling the trade. The end result is an otherwise repainting indicator with a very reliable trading signal. The donchian breakout period is entered as an input. [ Installation Guide | Update Guide | Troubleshooting | FAQ | A
FREE
This indicator is stand alone version from  MP Pivot Levels  (All in one) containing Woodie Pivots. Woodie’s pivot points are made up of multiple key levels, calculated from past price points, in order to frame trades in a simplistic manner. The key levels include the ‘pivot’ itself, and multiple support and resistance levels (usually up to three each). Traders use these levels as a guide for future price movements when setting up trades. The pivot : (Previous high + previous low + 2 x previous
FREE
Индикатор ценового канала за определенное количество баров, заданных в настройках. Линии индикатора представляют собой динамические уровни поддержки или сопротивления. Верхняя граница является ценовым максимумом за определенное число периодов, нижняя – минимумом. В отличии от скользящих средних, которые строят по ценам закрытий, индикатор не «отвлекается» на мелкие колебания. Пересчитываться он будет только в том случае, если изменятся границы. Если же последнее происходит, значит, стоит серьезн
FREE
С этим продуктом покупают
Currency Strength Wizard — очень мощный индикатор, предоставляющий вам комплексное решение для успешной торговли. Индикатор рассчитывает силу той или иной форекс-пары, используя данные всех валют на нескольких тайм фреймах. Эти данные представлены в виде простых в использовании индексов валют и линий силы валют, которые вы можете использовать, чтобы увидеть силу той или иной валюты. Все, что вам нужно, это прикрепить индикатор к графику, на котором вы хотите торговать, и индикатор покажет вам ре
Trend SniperX MT4
Sarvarbek Abduvoxobov
5 (6)
Trend Sniper X — это мультитаймфреймовый трендовый индикатор для MetaTrader 5, который помогает трейдерам точно и четко определять направление тренда и потенциальные точки разворота. Для MT5: https://www.mql5.com/en/market/product/181101 Информация о цене: Текущая цена является промо-ценой и может измениться по мере выхода новых обновлений и функций. Канал Code2Profit Освойте рынок с помощью мультитаймфреймового анализа! Как максимизировать процент побед с Trend Sniper X: ключевые правила и сове
M1 Sniper
Oleg Rodin
4.97 (30)
M1 SNIPER — это простая в использовании торговая система. Это стрелочный индикатор, разработанный для тайм фрейма M1. Индикатор можно использовать как отдельную систему для скальпинга на тайм фрейме M1, а также как часть вашей существующей торговой системы. Хотя эта торговая система была разработана специально для торговли на M1, ее можно использовать и с другими тайм фреймами. Первоначально я разработал этот метод для торговли XAUUSD и BTCUSD. Но я считаю этот метод полезным и для торговли на д
Smart Trend Trading System — индикатор для MetaTrader 4, который объединяет информацию о тренде, сигналы входа и выхода и ценовые уровни на одном графике. Система объединяет более 10 торговых инструментов в одном решении, включая определение тренда, зоны разворота, Smart Cloud, логику трейлинг-стопа, поддержку и сопротивление, окраску свечей, уведомления и мульти-таймфрейм анализ. Система создана, чтобы помочь вам торговать в разных рыночных условиях: Трендовые рынки: Определяйте главный тренд,
SIO Oscillator: самооптимизирующийся осциллятор дисбаланса семивариаций Купите индикатор и получите советник (EA) на его основе БЕСПЛАТНО. Большинство осцилляторов воспринимают любое движение цены одинаково. SIO разделяет давление покупателей и продавцов и измеряет дисбаланс между ними, показывая, какая сторона действительно контролирует рынок. Когда дисбаланс достигает экстремума, SIO выдаёт чёткий сигнал с уровнями входа, Stop Loss и Take Profit. Главное отличие SIO в том, что он не полагается
Liquidity Scalper System — торговая система на основе ликвидности в формате индикатора. Большинство индикаторов показывают только стрелку, а дальше трейдер сам решает, где поставить стоп, где цель и можно ли вообще доверять сигналу. Liquidity Scalper System закрывает весь цикл сделки: находит пулы ликвидности, даёт сигнал при их пробое, сразу рассчитывает Entry, Stop Loss и три цели, а на панели показывает статистику и результаты проверки на новых данных. Система сама подбирает настройки и обнов
Gann Made Easy - это профессиональная, но при этом очень простая в применении Форекс система, основанная на лучших принципах торговли по методам господина У.Д. Ганна. Индикатор дает точные BUY/SELL сигналы, включающие в себя уровни Stop Loss и Take Profit. ПОЖАЛУЙСТА, СВЯЖИТЕСЬ СО МНОЙ ПОСЛЕ ПОКУПКИ, ЧТОБЫ ПОЛУЧИТЬ ТОРГОВЫЕ ИНСТРУКЦИИ И ОТЛИЧНЫЕ ДОПОЛНИТЕЛЬНЫЕ ИНДИКАТОРЫ БЕСПЛАТНО! Вероятно вы уже не раз слышали о торговли по методам Ганна. Как правило теория Ганна отпугивает от себя не только н
Advanced Supply Demand
Bernhard Schweigert
4.91 (302)
Специальное предложение – скидка 30% Этот индикатор является уникальным, качественным и доступным инструментом для торговли, включающим в себя наши собственные разработки и новую формулу. В обновленной версии появилась возможность отображать зоны двух таймфреймов. Это означает, что вам будут доступны зоны не только на старшем ТФ, а сразу с двух таймфреймов - таймфрейма графика и старшего: отображение вложенных зон. Обновление обязательно понравится всем трейдерам, торгующим по зонам спроса и пре
Этот индикатор представляет собой индикатор автоматического волнового анализа, который идеально подходит для практической торговли! Случай... Примечание.   Я не привык использовать западные названия для классификации волн. Из-за влияния соглашения об именах Тан Лунь (Тан Чжун Шуо Дзен) я назвал основную волну   ручкой   , а вторичную полосу волн —   сегментом   Ат. в то же время сегмент имеет направление тренда. Именование   в основном является трендовым сегментом   (этот метод именования буде
В настоящее время скидка 30%! Лучшее решение для новичка или трейдера-эксперта! Эта приборная панель работает на 28 валютных парах. Он основан на 2 наших основных индикаторах (Advanced Currency Strength 28 и Advanced Currency Impulse). Он дает отличный обзор всего рынка Forex. Он показывает значения Advanced Currency Strength, скорость движения валюты и сигналы для 28 пар Forex на всех (9) таймфреймах. Представьте, как улучшится ваша торговля, когда вы сможете наблюдать за всем рынком с помощ
This is a professional chart indicator designed for traders focused on stability and clear price action. It helps filter market noise and provides clear visual entry and exit zones for your trading decisions. Price Information: The current price is promotional and is subject to change as upcoming updates and new features are released. MQL5 public channel:  CLICK HERE for MT5:  Non-repainting MT5 version Core Features: Strictly Non-Repainting: The system is built with strict non-repaint logic. W
Scalper Vault — это мощная, полноценная торговая система, созданная для трейдеров, которые стремятся к стабильным результатам в внутридневной торговле. Этот высокоточный индикатор представляет собой комплексное, самостоятельное торговое решение, обеспечивающее аналитику профессионального (институционального) уровня как для торговли на рынке Forex, так и для работы с бинарными опционами. Пожалуйста, свяжитесь со мной после покупки, чтобы получить мои торговые советы, а также отличный бонус! Исклю
Представляем ON Trade Waves Patterns Harmonic Elliot Wolfe, передовой индикатор, разработанный для обнаружения разнообразных рыночных паттернов с использованием как ручных, так и автоматизированных методов. Вот как это работает: Гармонические паттерны: Этот индикатор может определять гармонические паттерны, появляющиеся на вашем графике. Эти паттерны важны для трейдеров, практикующих теорию гармонической торговли, как это описано в книге Скотта Карни "Гармоническая Торговля том 1 и 2". Независи
RFI LEVELS PRO   определяет разворотные конструкции и ключевые зоны возврата цены, где может появляться активность крупных игроков. Индикатор помогает увидеть формирование нового тренда, определить потенциальную точку входа и заранее контролировать уровни риска и прибыли. VERSION MT5     —   Максимальный потенциал индикатора раскрывается при совместном использовании с   TREND LINES PRO . Что показывает индикатор: Разворотные конструкции и уровни, которые активируются в начале нового тренда. Поте
Zoryk Gold mt4
Reda El Koutbane
5 (4)
Скидка заканчивается через 24 часа — следующая цена $ 69 ограниченное количество копий по стартовой цене ZORYK — продвинутая сигнальная система для XAUUSD в MetaTrader 4 Вам знакомо это чувство. Вы анализируете золото, ждёте вход и наконец открываете сделку. Цена сразу начинает двигаться против вас. Вы закрываете позицию слишком рано, переносите Stop Loss или сомневаетесь несколько секунд. А затем рынок без вас достигает именно той цели, которую вы ожидали с самого начала. Проблема не всегд
ShapeRadar — индикатор классических графических паттернов ShapeRadar автоматически находит на графике классические фигуры технического анализа: двойные и тройные вершины и доньи, «голову и плечи» и её обратную версию, восходящие и нисходящие клинья, прямоугольники, треугольники, флаги и вымпелы. Когда цена закрывается за границей фигуры, индикатор рисует сам паттерн, точку входа, уровень стоп-лосса и цель, а на панели показывает сводку по всем найденным фигурам. Версия для MetaTrader 5:  https:/
PRO Renko System - это высокоточная система торговли на графиках RENKO. Система универсальна. Данная торговая система может применяться к различным торговым инструментам. Система эффективно нейтрализует так называемый рыночный шум, открывая доступ к точным разворотным сигналам. Индикатор прост в использовании и имеет лишь один параметр, отвечающий за генерацию сигналов. Вы легко можете адаптировать алгоритм к интересующему вас торговому инструменту и размеру ренко бара. Всем покупателям с удовол
SR Liquidity — это торговый индикатор, предназначенный для выявления скрытых зон, где концентрируется рыночная ликвидность и наблюдается наиболее сильная реакция цены. Эти особые зоны ликвидности выступают в качестве мощных уровней поддержки и сопротивления, предоставляя вам четкую картину того, где с наибольшей вероятностью произойдет разворот рынка. Вместо построения стандартных линий поддержки и сопротивления, индикатор SR Liquidity анализирует реальное поведение цены, выявляя зоны концентрац
Auto Optimized SpeedAngle — это система векторизации импульса институционального уровня, которая исключает подгонку под исторические данные (curve-fitting) за счет непрерывной форвард-оптимизации (Walk-Forward Optimization, WFO). Вместо того чтобы полагаться на статические входные параметры, которые теряют эффективность при смене рыночных режимов, индикатор динамически перекалибрует свои настройки, используя валидацию на вневыборочных данных (Out-of-Sample, OOS). Это гарантирует, что отображаемы
Professional Volume Profile Индикатор для MetaTrader 4, который строит горизонтальный профиль объема (Volume Profile) на графике цен. Показывает уровни с наибольшим количеством сделок, помогая находить зоны поддержки/сопротивления и оценивать баланс сил на рынке. Что показывает индикатор POC (Point of Control) — уровень с максимальным объемом торгов (красная линия). VAH / VAL (Value Area High / Low) — верхняя и нижняя границы зоны стоимости, где было совершено 70% объема (оранжевые пунктиры). Ги
Italo Volume Indicator
Italo Santana Gomes
4.92 (79)
BUY INDICATOR AND GET EA FOR FREE AS A BONUS + SOME OTHER GIFTS! ITALO VOLUME INDICATOR  is the best volume indicator ever created, and why is that? The Indicator works on all time-frames and assets, indicator built after 7 years of experience on forex and many other markets. You know many volume indicators around the internet are not complete, does not help, and it's difficult to trade, but the Italo Volume Indicator is different , the Italo Volume Indicator shows the wave volume, when market
Индикатор оценивает наиболее вероятное краткосрочное движение цены на основе сложных математических расчетов. Особенности Оценка ближайшего движения цены на таймфрейме графика и на всех старших таймфреймах; Расчет реального тренда рынка; Расчет наиболее важных уровней поддержки и сопротивления; Оповещения о зонах скопления уровней, пересечениях уровней и сменах тренда; Бережно расходует ресурсы системы: линии и панель обновляются только при изменении значения; Самонастройка: работает на любом с
Atomic Analyst — MetaTrader 4 По вопросам продукта, настройки или технической поддержки напишите мне напрямую здесь, на MQL5. Индикатор превращает сложные рыночные расчеты в простые визуальные сигналы, цветные свечи, показания тренда, уровни стоп-лосса и несколько зон тейк-профита, которые трейдеры могут быстро понять и использовать в реальных рыночных условиях. Основные варианты использования: Скальпинг и внутридневная торговля: Создан для быстрого принятия решений, четких стрелок, алертов, цв
Scalping Entry Points - ручная торговая система, которая может подстраиваться под движения цены и давать сигналы для открытия сделок без перерисовки. Направление тренда индикатор определяет центральным уровнем поддержки и сопротивления. Точечный индикатор предоставляет сигналы для входов и выходов. Подходит для ручной торговли внутри дня, скальпинга и бинарных опционов. Работает на всех тайм-фреймах и торговых инструментах. Индикатор дает несколько типов оповещений. Как использовать продукт Си
All in One package includes the  Oscillator Predictor ,  MACD Predictor ,  Thrust Scanner  and  Advanced Fibonacci  indicators which are mandatory for applying  Dinapoli  trade plans.  Please visit below links for detailed explanations of indicators. Advanced Fibonacci Indicator =>  https://www.mql5.com/en/market/product/52834 Thrust Scanner Indicator => https://www.mql5.com/en/market/product/52830 Overbought /Oversold Predictor indicator => https://www.mql5.com/en/market/product/52621 Macd P
Или (TDO), который представляет собой индекс, который измеряет скорость изменения цен, используя принцип « чистого импульса ». Когда цена ценной бумаги повышается с 10 до 15, скорость изменения цены составляет 150%, но когда она снижается с 15 до 10, скорость изменения цены составляет всего 33,3%. Вот почему индикаторы технического анализа, такие как «Скорость изменения цены» (ROC) или «Моментум», дают более высокие значения для восходящих движений цены, чем для нисходящих. TDO устраняет эту про
Quantum Imbalance Profiles   — индикатор фаз баланса и дисбаланса. Он показывает, на каких ценах рынок проторговывал объём, какая сторона доминировала внутри этой зоны и через какие уровни цена затем расширилась импульсом. Классический профиль объёма отвечает на один вопрос: где проходила торговля. Он не показывает, какая сторона доминировала на каждой цене, чем закончилась проторговка и в какую сторону рынок из неё вышел. Quantum Imbalance Profiles строит профиль в режиме Volume Bid/Ask — объём
Индикатор для ручной торговли и технического анализа для Forex. Состоит из трендового индикатора с уровнем открытия торгового дня и стрелочного индикатора для определения точек входа. Индикатор не перекрашивается, работает по закрытию свечи. Содержит несколько типов оповещений для сигнальных стрелок. Можно настроить для работы на любом графике, торговом инструменте или тайм-фрейме. Стратегия работы базируется на поиске движений цены по тренду. Для совершения сделок " Buy ": Трендовая линия д
Индикатор силы, который измеряет движение цены для подтверждения тренда и силы. Продвинутый мультивалютный и мультитаймфреймовый индикатор, который позволяет одним взглядом на график увидеть все валютные пары в тренде , а также самые сильные и слабые валюты, движущие этими трендами. Этот индикатор интеллектуально анализирует движения цен 28 валютных пар одновременно на всех таймфреймах в режиме реального времени , поэтому вы всегда будете знать о самых сильных и слабых валютах в составе пары . C
Dark Support Resistance  is an Indicator for intraday trading. This Indicator is programmed to identify  Support and Resistance Lines , providing a high level of accuracy and reliability. Key benefits Easily visible lines Only the most important levels will be displayed Automated adjustment for each timeframe and instrument Easy to use even for beginners Never repaints, never backpaints, Not Lag 100% compatible with Expert Advisor development All types of alerts available: Pop-up, Email, Push
Другие продукты этого автора
TCL Super Trend
Stratos Digital (PVT) Ltd
TCL Super Trend is a trend-following indicator for MetaTrader 4. It plots a SuperTrend line, ATR-adaptive volatility bands, trend-change arrows, and an on-chart dashboard panel. HOW THE ENGINE WORKS Most SuperTrend indicators use a single Average True Range (ATR) multiplier to place a line above or below price. TCL Super Trend uses a dual-logic state machine that tracks both the highest lows and the lowest highs within a configurable lookback window, called Amplitude. A trend reversal is con
FREE
TCL VWAP Super Bands is a Volume Weighted Average Price (VWAP) indicator for MetaTrader 4 with anchored mode, standard deviation bands, and a squeeze detector. It plots the daily-session VWAP by default and supports anchoring to any specific date. How It Works VWAP is a volume-weighted version of the average price over a chosen period. It is widely used as a reference level for fair value. The indicator computes VWAP from the current session start (daily mode) or from a user-specified date (anch
FREE
TCL Auto S&R Lines is a Support and Resistance indicator for MetaTrader 4. It scans recent price history with a fractal-based algorithm, identifies levels that have been touched multiple times, and draws them on the chart. It also includes a manual lock feature to preserve specific levels between sessions. How It Works The indicator searches for swing pivots within a configurable history window using a fractal sensitivity parameter. Each candidate level is then validated by a touch-verification
FREE
Auto Supply and Demand Oscillator is an indicator for MetaTrader 4 and MetaTrader 5 that detects supply and demand zones automatically and displays them as a single oscillator value at the bottom of the chart, instead of drawing rectangles directly on price. Concept Supply zones are price areas where strong selling created a sharp downward move away from a balance area. Demand zones are price areas where strong buying created a sharp upward move. Traditional implementations draw boxes on the
FREE
Adaptive Super Bands is a volatility band indicator for MetaTrader 4 and MetaTrader 5. Unlike traditional Bollinger Bands, which use Standard Deviation with equal weighting across all bars, this indicator uses an Exponentially Weighted Moving Average (EWMA) variance model. EWMA places more weight on recent price action, allowing the bands to respond more quickly to changes in volatility. The indicator includes a market regime filter and a volatility-compression detector. Core Components 1. E
FREE
TCL Super RSI
Stratos Digital (PVT) Ltd
TCL Super RSI is a Relative Strength Index (RSI) indicator for MetaTrader 4 with timeframe-adaptive settings. It detects the chart's timeframe and applies a different RSI period and overbought/oversold threshold optimised for that timeframe, ranging from a 7-period RSI for M1 scalping to a longer-period smoothed RSI for Daily and Monthly charts. How It Works The standard 14-period RSI is a single fixed setting that responds differently on different timeframes. On fast charts the same period is
FREE
TCL Trend Radar
Stratos Digital (PVT) Ltd
TCL Trend Radar is a multi-timeframe trend dashboard for MetaTrader 4. It applies a three-condition algorithm (Moving Average cross plus Directional Movement Index plus Average Directional Index gate) to grade the trend on every standard timeframe and displays the result on a single panel. How It Works For each timeframe the indicator computes three things: the relationship between a Fast and a Slow Moving Average, the Directional Movement Index (DMI) for trend direction, and the Average Directi
FREE
TCL Boom and Crash
Stratos Digital (PVT) Ltd
TCL Boom Crash is a signal indicator for MetaTrader 4 that combines a Relative Strength Index (RSI) layer, Stochastic oscillator confirmation, optional RSI divergence detection, and a multi-factor trend filter. Signal arrows are plotted on the chart when the configured filters agree. How It Works Each potential signal is built from three layers: RSI crossing its overbought or oversold level, Stochastic oscillator confirmation, and optional RSI divergence detection. A separate trend filter using
FREE
TCL Auto Pivot Points is a daily, weekly, and monthly pivot-point indicator for MetaTrader 4. It calculates classic institutional support and resistance levels (R1 through R3 and S1 through S3) using a choice of four formulas and plots them automatically on the chart. What It Plots The indicator draws seven horizontal lines: the central Pivot Point (P), three Resistance levels (R1, R2, R3) above it, and three Support levels (S1, S2, S3) below. The lines update at the start of each pivot period (
FREE
TCL SQ Super Bands is a volatility band indicator for MetaTrader 4. It replaces the symmetric Standard Deviation math used by Bollinger Bands with either Semi-Sigma (asymmetric volatility) or Quantile (percentile) calculations, producing bands that adapt to market skewness. How It Works Standard Bollinger Bands assume price moves symmetrically around the mean, but real markets often show skew, with larger or more frequent moves in one direction. This indicator offers two alternative band logics
FREE
TCL Correlation Matrix is a multi-symbol correlation dashboard for MetaTrader 4. It scans up to 42 symbols across Forex majors, crosses, exotics, commodities, and cryptocurrencies, calculating a real-time Pearson correlation coefficient between each symbol and the chart's symbol. What It Shows Each symbol's correlation value is displayed as a coefficient between -1.00 and +1.00. Values close to +1.00 mean the two symbols move together; values close to -1.00 mean they move opposite; values near 0
FREE
TCL Power Meter
Stratos Digital (PVT) Ltd
TCL Power Meter is a currency strength dashboard for MetaTrader 4. It analyzes eight major currencies (USD, EUR, GBP, JPY, CHF, AUD, CAD, NZD) against the entire matrix of cross pairs using an aggregated Relative Strength Index (RSI) formula, producing a single 0-to-100 strength score per currency. How It Works For each of the eight major currencies, the indicator computes RSI values across every pair that currency is part of, then aggregates those values into a single strength score. The result
FREE
TCL MA Crossovers
Stratos Digital (PVT) Ltd
TCL MA Crossovers is a Moving Average crossover indicator for MetaTrader 4 with independent Fast and Slow MA settings for every chart timeframe. It plots crossover markers and sends multi-channel alerts when a confirmed crossover occurs. How It Works Most crossover indicators apply one Fast and one Slow Moving Average to whichever timeframe is open. This indicator stores a separate Fast and Slow MA configuration for each timeframe (M1, M5, M15, M30, H1, H4, D1, W1, MN). When the chart timeframe
FREE
Фильтр:
Нет отзывов
Ответ на отзыв