 MetaTrader 5
 Эксперты
 Индикаторы
 Библиотеки
 Утилиты
 Виджеты
 Правила
Смотри обучающее видео по маркету на YouTube
Как купить торгового робота или индикатор
Запусти робота на
виртуальном хостинге
виртуальном хостинге
Протестируй индикатор/робота перед покупкой
Хочешь зарабатывать в Маркете?
Как подать продукт, чтобы его покупали
Бесплатные технические индикаторы для MetaTrader 5 - 27
 На основании сигналов технических индикаторов принимаются решения относительно открытия или закрытия сделки на фондовом и форекс-рынках. Суть индикаторов заключается в математическом преобразовании цены и/или объемов финансового инструмента для прогнозирования изменений цен в будущем.
Протестируйте технические индикаторы, чтобы лучше предсказывать поведение рынка и зарабатывать на этом.

Trading Dashboard FULL - Real-Time Performance & Analytics Calendar Trading Dashboard FULL is an advanced, interactive visual analytics tool for (MT5). Designed for serious traders, prop firm challenge takers, and portfolio managers, this indicator converts your raw trading history into a clear, comprehensive monthly calendar and real-time statistics dashboard right on your main chart window. No more switching between account tabs or downloading report files to analyze your trading performance.
FREE

1. Overview The Ichimoku Kinko Hyo (or Ichimoku Cloud) is a comprehensive, all-in-one technical analysis indicator designed to provide a deep understanding of market trends, momentum, and dynamic support and resistance levels. This indicator provides a clean, standard implementation of the five core Ichimoku lines. Its key feature is a non-intrusive Status Dashboard that gives you an at-a-glance summary of the current market situation according to the Ichimoku system, allowing for quick and effi
FREE

ACE Signals Adaptive Confluence Engine — Precision Entry Signals Through Multi-Layer Validation Tired of repainting arrow indicators that fire late, whipsaw in chop, and leave you holding the bag? Most signal indicators rely on a single condition — a moving average cross, an RSI spike, or a price pattern. In volatile markets, that is not enough. ACE Signals was engineered from the ground up to eliminate false entries by requiring three independent layers of market intelligence to align before a
FREE
Индикатор Money Flow Index (MFI) с поддержкой нескольких таймфреймов, настраиваемыми визуальными сигналами и конфигурируемой системой оповещений.
Услуги фриланс-программирования, обновления и другие продукты TrueTL доступны в профиле MQL5 .
Отзывы и рейтинги очень приветствуются!
Что такое MFI? Money Flow Index (MFI) — это взвешенный по объёму осциллятор импульса, измеряющий силу денежного потока, входящего и выходящего из ценной бумаги за определённый период. Он работает аналогично RSI, но у
FREE

HA Trend Signals is a powerful, non-repainting signal indicator designed to capture massive market trends while effectively filtering out market noise. Inspired by the logic of the popular UT Bot Alerts, this tool is highly optimized with a built-in Heikin Ashi algorithm to provide smooth, sniper-accurate Buy and Sell signals. Whether you are a scalper trading Gold on the 1-minute chart or a swing trader looking for long-term trends, HA Trend Signals gives you the visual clarity you need to ente
FREE

SnR PREMIUM Smart Support & Resistance Indicator Trade from the Zone. Manage with Precision. SnR Premium adalah indikator Support & Resistance yang dirancang untuk membantu trader membaca area penting pada chart dengan visual yang bersih, sederhana, dan mudah digunakan. Tidak hanya menampilkan zona Support & Resistance, SnR Premium juga dilengkapi dengan panel trading management untuk membantu trader melakukan pengelolaan posisi secara lebih praktis. KEY FEATURES SMART SUPPORT & RESISTANCE
FREE

Breakout in Confidence Session Range Breakouts • EMA Momentum • Order Blocks Breakout in Confidence is an intraday breakout-analysis indicator designed to help traders identify and evaluate Opening Range Breakouts (ORB) across three major market sessions: Asian London New York Each session can be independently enabled and its Opening Range can be calculated using M5, M15 or M30 data. The indicator then extends the established session range using Fibonacci-based projection levels while incorpora
FREE

XE Forex Strengh Indicator MT5 displays visual information about direction and strength of a signal for current pair and chosen timeframes (M5, M15, M30 and H1). Calculations are based on multiple factors and results are shown as a colored panel with scale bar, numerical values and arrows. There are also displayed values of current price and spread on the pair. There can be activated an alert (as a mail or pop-up window with sound) for each available timeframes which send a message when the dir
FREE

SMC Blue Shadow Signals SMC Blue Shadow Signals is an all-in-one technical analysis suite engineered for traders utilizing Smart Money Concepts (SMC). The indicator automates the identification of market structure, liquidity zones, and institutional order flow, providing a comprehensive visual framework for multi-timeframe market analysis. Technical Features 1. Advanced Market Structure Mapping The indicator utilizes automated structural logic to map price action in real-time: Break of Structure
FREE

Cobalt MACD Multi-Timeframe (MTF) Panel Покоряйте все уровни рынка одним взглядом. Cobalt MACD MTF — это передовая панель стратегического анализа, разработанная для профессиональных трейдеров. Индикатор в реальном времени сканирует 21 временной интервал (от M1 до месячного) и превращает сложные данные о моментуме в элегантную, интуитивно понятную и интерактивную панель управления прямо на вашем графике. Забудьте о постоянном переключении таймфреймов, чтобы увидеть «общую картину». С мощью Cobalt
FREE
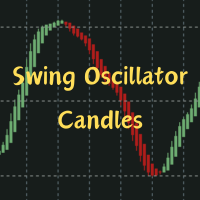
Description:
Heikin-Ashi-like swing oscillator candles. It can be used in the same way as RSI or Stochastic.
For example: Zero crossing. Above the zero line is bullish, below the zero line is bearish.
Overbought or oversold. 100 line is the extreme bought level, -100 line is the extreme sold level.
Divergences.
Time frame: Any time frame.
Instrument: Any instrument.
FREE

Candle Timer Sessions с одного взгляда отвечает на три вопроса: сколько осталось до закрытия этой свечи, какие рынки открыты прямо сейчас и насколько цена уже прошла сегодня. Отсчёт до закрытия свечи, который не зависает Обновляется по таймеру, поэтому продолжает отсчёт, даже когда нет тиков Рядом с ценой и на панели; в последние секунды становится янтарным Опциональное оповещение за несколько секунд до закрытия (один раз на свечу) В выходные и перерывы показывает «рынок закрыт» вместо неверного
FREE

Индикатор отклонения от скользящей средней (MA Deviation) Обзор Данный индикатор отображает процент отклонения цены от скользящей средней и строит верхние/нижние полосы на основе стандартного отклонения. Функции 1. Линия отклонения — показывает, насколько цена отклонилась от скользящей средней, выраженное в процентах. Формула: Отклонение = (Закрытие / Скользящая средняя × 100) − 100 2. Центральная линия — скользящая средняя от значений отклонения. 3. Верхняя/нижняя полосы — статистические грани
FREE

Обзор
KS Candle Countdown Timer — это простой и лаконичный визуальный таймер обратного отсчета для MetaTrader 5, показывающий время, оставшееся до закрытия текущей свечи. Таймер отображает отсчет в формате ММ:СС прямо на графике, рядом с линией текущей цены.
Инструмент особенно полезен для:
Скальперов и дей-трейдеров, принимающих решения на основе момента закрытия свечи
Трейдеров, которым важно точно знать, сколько времени осталось до формирования новой свечи
Всех, кто предпочитает крупный,
FREE

Harmonic Pattern Suite Pro Introduction Harmonic Pattern Suite Pro is an indicator designed to identify and display harmonic structures on the chart based on X-A-B-C-D sequences. Its purpose is to present pattern formations that meet geometric and proportional criteria, providing a clear visual representation directly on the chart. The indicator automates the detection process, removing the need for manual measurement of ratios and allowing the user to review the structural configuration withou
FREE
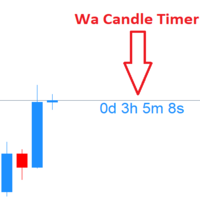
Wa Candle Timer MT5 показывает живой обратный отсчёт до закрытия текущей свечи прямо на основном графике. По мере приближения конца бара таймер меняет цвет (по умолчанию — когда прошло ~95% длительности свечи, т.е. осталось ~5% времени).
Индикатор лёгкий, наглядный и подходит трейдерам, синхронизирующим входы/выходы по закрытию свечи. Ключевые возможности Реальный обратный отсчёт до закрытия бара для любого инструмента и тайм-фрейма. Смена цвета, когда свеча почти завершилась (порог по умолчанию
FREE

CandlePOC Pro – Point of Control for Every Single Candle CandlePOC Pro is a professional MT5 indicator that visualizes the Point of Control (POC) of every individual candle directly on the chart. For each completed candle, the price level with the highest trading activity is identified and displayed as a horizontal line. The calculation is based on MetaTrader 5 Tick Volume , allowing traders to identify the price levels where the highest amount of activity occurred within each candle. Once a can
FREE

Fibo Zones Manual — Manual Fibonacci with Buy/SL/TP Zones
Fibo Zones Manual is a fully manual Fibonacci tool — drag the two points to your swing high/low, exactly like the native MT5 Fibonacci retracement. On top of it, the indicator draws three colored zones directly on the chart: entry zone (Buy/Sell), SL zone, and TP zone, each with the exact price displayed.
Key Features
• Manual placement, drag-and-drop like the native tool • Colored zones (entry, SL, TP), fully adjustable • Price and pe
FREE

Product Name: Golden Pattern Panel Description: Golden Pattern Panel is a multi‑information display tool that shows trend strength across multiple timeframes, dynamic support/resistance levels, candlestick pattern recognition results, and market sentiment data in a compact interface. Key Features: Trend Strength Meter
Combines EMA20 and RSI to generate a 0–100% trend intensity value for each of six timeframes (M1, M5, M15, M30, H1, H4). An aggregated energy bar summarizes the overall directi
FREE

Reference Level Structure Visualizer – Версия 2.0 Мультитаймфреймовая структура рынка, подтверждённые свинги и зоны Fair Value Gap для MetaTrader 5 Обзор Reference Level Structure Visualizer — технический индикатор для MetaTrader 5, который отображает непосредственно на ценовом графике структуру рынка, подтверждённые точки свинга и зоны Fair Value Gap. Версия 2.0 поддерживает визуализацию рыночной структуры на таймфреймах M1, M5, M15 и H1, позволяя анализировать различные уровни ценовой структур
FREE
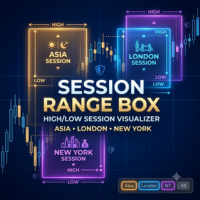
Session Range Box — Session High/Low Visualizer Overview Session Range Box draws live, color-coded rectangles on your chart marking the high and low reached during the Asia, London, and New York trading sessions. As each session unfolds, its box grows in real time to reflect the range built so far, then locks in place once the session closes. A simple on-chart control panel lets you show or hide any session instantly, so you can study one session's range in isolation or view all three overlaid a
FREE

MTF VWAP Dashboard and Signal Suite Short Description: Multi-Timeframe VWAP Dashboard with automatic 7-level confluence buy/sell arrows for Forex, Gold, and Indices. Description: The MTF VWAP Dashboard & Signal Suite is a professional institutional trading tool designed to give traders instant multi-timeframe volume bias across 7 key timeframes simultaneously. By combining Anchored VWAPs (Monthly, Weekly, Daily) with Intraday VWAPs (H4, H1, M15, and Current Chart), this suite eliminates guesswor
FREE

VWAP Institutional Pro: Карта реальной стоимости VWAP Institutional Pro — это незаменимый инструмент для определения справедливой рыночной цены, позволяющий торговать с теми же ориентирами, что и крупные инвестиционные фонды и высокочастотные алгоритмы. Этот индикатор рассчитывает средневзвешенную цену по объему в реальном времени, выявляя невидимые уровни динамической поддержки и сопротивления, на которых институциональный поток ордеров обычно реагирует с филигранной точностью.
Руководство по
FREE
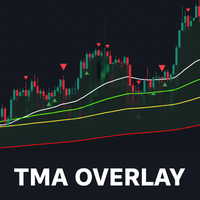
TMA Overlay Indicator for MT5 - User Guide 1. Introduction TMA Overlay is a versatile technical analysis indicator for the MetaTrader 5 platform. The indicator's goal is to provide traders with a comprehensive overview of the trend, potential entry signals, and key trading sessions, all integrated into a single chart. This is not a trading system, but a comprehensive analysis tool designed to help you make more informed decisions. 2. Core Indicator Components The indicator consists of multiple c
FREE

RSI Alert สําหรับ MT5 อินดิเคเตอร์แจ้งเตือน RSI สําหรับ MetaTrader 5 ช่วยให้จับจังหวะ Overbought / Oversold ได้เร็วขึ้น เหมาะกับสายเทรดสั้น สายสวิง และคนที่ไม่อยากเฝ้าจอตลอดเวลา
จุดเด่น
แจ้งเตือนเมื่อ RSI แตะระดับสําคัญ เช่น 70 / 80 / 90 และ 30 / 20 / 10
รองรับ Popup Alert
รองรับ Sound Alert
รองรับ Push Notification ไปมือถือ
ปรับค่า RSI Period ได้
เปิด/ปิดแต่ละระดับการแจ้งเตือนได้ตามต้องการ
ใช้งานง่าย ติดตั้งแล้วพร้อมใช้งานบน MT5
เหมาะสำหรับ
เทรดเดอร์ที่ใช้ RSI เป็นตัวช่วยเข้าออเดอร์
FREE

Floating DD Tracker — Free Risk Monitoring Indicator for MT5 Floating DD Tracker is a lightweight and professional MetaTrader 5 indicator designed to help traders monitor real-time floating drawdown directly on the chart. The indicator continuously tracks your current floating drawdown, records the highest drawdown reached, and displays the historical maximum DD with the exact date and time it occurred. Its compact neon-style dashboard is optimized for all chart sizes and provides instant visual
FREE

Smart Session Breakout MT5 — Precision Range Accumulation & Volatility Expansion Signals
Markets spend part of the trading day accumulating volume inside a tight range, and part of the day breaking out with explosive momentum. Smart Session Breakout draws the exact accumulation range of any session you choose (Asian, London, New York), carries its high and low levels forward as dynamic support/resistance, and marks genuine breakout candles.
Key Features:
- Session Accumulation Box: Draws the
FREE

======================================================== XAUUSD ELLIOTT WAVE + REAL YIELD (BIG DASHBOARD) - MQL5/MT5 MARKET DESCRIPTION (formatting: **bold** = Bold button; lines with • = bullet list; UPPERCASE = heading) ========================================================
OVERVIEW ------------------------------------------------------- **XAUUSD Elliott Wave + Real Yield (Big Dashboard)** is the dashboard edition of the Elliott + real-yield engine: the same ZigZag/Elliott structure and ma
FREE
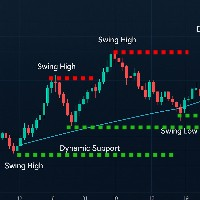
A professional swing point detection indicator that identifies key highs and lows with precision. Features include: Smart Detection : Identifies swing highs/lows based on customizable left/right bar analysis Visual Alerts : Clear arrows and labels (optional) mark swing points Dynamic Lines : Draws support/resistance lines that disappear when price touches them (toggle on/off) Real-Time Alerts : Sound and popup notifications for new swings Non-Intrusive : Preserves all manual chart drawings Perfe
FREE

PositionMap Pro — Account Overview Panel for MT5 A real-time panel that groups all open positions by symbol and shows Buy lots, Sell lots and net profit/loss directly on your chart — the whole account at a glance. Instead of counting lots symbol by symbol in the Terminal tab, PositionMap Pro groups everything automatically. You instantly see how much exposure you have on each symbol, split by direction. Panel example Symbol Buy Lot Sell Lot Net P/L EURUSD 0.50 — +12.30 XAUUSD — 1.00 −45.00 GBPUS
FREE

ChartMarker
is a chart-window indicator for marking up your charts with trend lines and order blocks. You draw directly on the chart with mouse clicks instead of switching MetaTrader drawing tools on and off. ChartMarker keeps markup fast and consistent during review and live trading. One compact panel controls the active tool, visibility, cleanup, and backup. Drawings stay on the chart as standard objects you can still select and adjust in MetaTrader when needed. Main features Trend lines fro
FREE
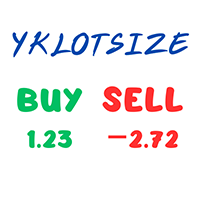
YK Lot Size — A clean, ultra-fast order summary & risk monitor for MetaTrader 5 (MT5). Key Features: Simple 3-Line Display : Shows remaining Equity , BUY Lot & P/L, and SELL Lot & P/L directly on your chart. Smart Colors : Green for profit, Red for loss, Gray when no open orders. Stop Out Warning Line : Automatically plots a red dotted line on the chart showing your exact liquidation/Stop Out price. Symbol or All Positions : Monitor only the current chart or your entire account. Zer
FREE
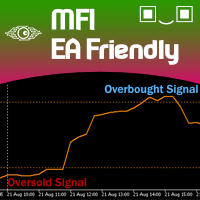
The traditional Money Flow Index indicator, this time, EA friendly . There are 3 buffers exposed that can be used by EAs to automatically analyze the Overbought and Oversold conditions of the quote. Just use the traditional iCustom() function to get these signals. This Money Flow Index calculation is based on the traditional Metaquote's MFI indicator.
SETTINGS
MFI Period Volume type to analyze (Real Volume or Ticks) Starting Overbought region Starting Oversold region
USING WITH EAs
Buffer #0:
FREE

Introduction to the Candle Time Indicator The Candle Time Indicator for MetaTrader 5, helps users know how much time on a candlestick is remaining.
Overview of Candle Time Indicator settings. TextColor: set the color of the countdown clock; FontSize: set the size of the font; Installation Guide Copy and paste the CandleTime.ex5 indicator files into the MQL5 folder of the Metatrader 5 trading platform. You can gain access to this folder by clicking the top menu options, that goes as follows: Fil
FREE

OVERVIEW Swing Profile is a dynamic, structure-aware volume profiling tool that builds a complete volume profile for each completed market swing. Instead of using fixed sessions or arbitrary time ranges, the indicator anchors its profile strictly between confirmed swing highs and swing lows, allowing traders to analyze exactly where volume accumulated inside each directional leg. The profile updates in real time while a swing is still forming and finalizes once the swing direction flips, prov
FREE

Stochastic RSI-RVI Fusion is a next-generation oscillator that goes beyond the standard Stochastic RSI. By combining the momentum precision of the Relative Strength Index (RSI) with the energy and volatility analysis of the Relative Vigor Index (RVI) , this indicator provides a smoother, more reliable oscillating signal for traders looking to filter out market noise. Standard oscillators often give false signals during choppy markets. This "Fusion" edition solves that by averaging market
FREE

Multi Currency Strength Dashboard Mini (FREE) – Currency Strength Meter for MetaTrader 5 Multi Currency Strength Dashboard Mini – это бесплатный индикатор для MetaTrader 5 , который в реальном времени показывает относительную силу 8 основных валют (USD, EUR, GBP, JPY, CHF, CAD, AUD, NZD) в виде понятной и быстрой к чтению панели. Цель: за несколько секунд определить сильные и слабые валюты, чтобы сформировать целевой watchlist (например, выбрать пары, где сильная валюта противостоит слабой). Что
FREE

КАКАЯ СТОРОНА ОТКРЫТА? Вы торгуете золото на M5 или M15, но важный тренд находится на H1. ATS Gold Bias переносит картину H1 на график, на котором вы торгуете, поэтому вам не нужно переключать таймфреймы, чтобы знать, какая сторона открыта. ЛИНИЯ УКЛОНА H1 EMA 50 с H1, нарисованная на вашем графике бар за баром Зелёная, пока последний закрытый бар H1 выше неё: покупки разрешены Красная, пока он ниже: продажи разрешены Точка там, где уклон сменился, плюс опциональное всплывающее или push-оповещен
FREE

El **Heiken Ashi Smoothed** es una versión suavizada del indicador técnico Heiken Ashi, que se utiliza en el análisis de gráficos de velas para identificar tendencias del mercado y pronosticar movimientos de precios. Este indicador se basa en el promedio de datos de precios para formar un gráfico de velas que ayuda a los traders a filtrar el ruido del mercado.
**¿Para qué sirve?** Este indicador se utiliza para identificar cuándo los traders deben permanecer en una operación y cuándo está por
FREE

Supply and Demand indicator powered by advanced multi-timeframe fractal algorithms, Zone Merging technology, and full EA readiness. - Finding the exact areas where institutional buying and selling occur is the key to successful trading. Advanced Supply & Demand Zones Simple takes the guesswork out of chart analysis. By utilizing a dual-layered fractal calculation (Fast and Slow points) combined with dynamic ATR scaling, this indicator pinpoints high-probability reversal and continuation zones
FREE

GoGo Breaker – The Master Candle Signal Умные сигналы, основанные на ценовом действии, с продвинутыми фильтрами GoGo Breaker — это мощный торговый индикатор, который использует паттерн "Master Candle" для выявления высоковероятных возможностей в режиме реального времени. Разработанный для трейдеров, которые ищут быстрые и точные входы , он идеально подходит для скальпинга, внутридневной и свинговой торговли . Автоматически обнаруживает сигналы покупки/продажи с помощью четких стрелок. Работает н
FREE

Three Pushes Free: Стратегия Прецизионного Прайс Экшн ️ ВАЖНО: Данная бесплатная версия ограничена только парой AUDUSD и таймфреймом H1. Трейдинг — это не поиск «святого грааля», это выявление повторяющейся рыночной психологии. Three Pushes Free — это профессиональный инструмент технического анализа, разработанный для идентификации классического паттерна истощения «Три Пуша» с фильтром институционального уровня. В отличие от базовых индикаторов, которые смотрят только на цену, этот инструмент и
FREE

Plus RSI MA Color — Динамическая цветная линия тренда Plus RSI MA Color — это визуальный индикатор тренда для MetaTrader 5. Он отображает непосредственно на основном графике сглаженную линию, которая меняет цвет в зависимости от соотношения между движением цены и внутренним ориентиром. Цель индикатора — облегчить визуальное определение преобладающего направления рынка и возможных переходов между покупательскими и продавательскими движениями. Принцип работы Индикатор использует взвешенную цену ка
FREE

# SSL ST Strategy MT5 Indicator - Russian Version
Индикатор SSL ST Strategy MT5 — это инструмент технического анализа, разработанный для помощи трейдерам в четком определении сигналов покупки и продажи на графике торговли. Он предлагает визуальные индикаторы в виде линий и стрелок, а также звуковые, всплывающие и push-уведомления для своевременного оповещения трейдеров о возможностях торговли.
## Основные преимущества
- Предоставляет четкие визуальные сигналы прямо на графике с использование
FREE
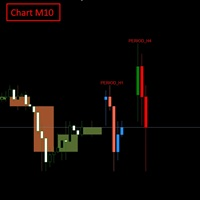
FULL PRODUCT DESCRIPTION Multi-Timeframe Candle Overlay Pro lets you view higher-timeframe candles directly on your current chart with absolute accuracy. When trading lower timeframes like M1–M15, understanding what the H1–H4 candles are forming is a major advantage: you avoid counter-trend entries, read market context faster, and trade with more confidence.
The indicator supports up to 2 higher timeframes, drawing full OHLC candles with precise positioning—no misalignment, no distortion. C
FREE

Mattrix Auto Refresh Short Description Keeps custom symbol charts up to date. Forces periodic candle recalculation without Journal spam.
Essential for any synthetic or custom symbol chart in MT5.
Full Description Custom symbols in MetaTrader 5 do not receive broker ticks. Their charts often show outdated or incomplete candles, especially on lower timeframes.
This lightweight indicator solves the problem. Drop it on any custom symbol chart. It forces a periodic full bar recalculation by re
FREE

Индикатор PipTick OHLC показывает текущие и исторические значения минимума, максимума, открытия, закрытия и средне цены на выбранном периоде. Он может отображать текущие значения или значения за предыдущую сессию. Диапазоном для расчета индикатора может быть дневная, недельная, месячная или любая выбранная пользователем сессия.
Уровни Максимум текущей или предыдущей сессии Минимум текущей или предыдущей сессии Открытие текущей или предыдущей сессии Закрытие текущей или предыдущей сессии Среднее
FREE

Overview Anchor VWAP Multi is a professional-grade MetaTrader 5 indicator that solves a common problem for traders who work with Anchored VWAP: the need to see multiple anchored VWAPs simultaneously without opening several chart windows or running multiple indicator instances. You can now plot up to 10 independent Anchored VWAP lines on one chart, each anchored to its own bar, with its own color and — optionally — its own pair of standard-deviation envelopes. Anchors are placed directly on the c
FREE

THE DAILY BOX SCANNER
The MT5 Indicator That Turns the Previous Daily Candle Into a Reversal Machine
---
What if the market told you exactly where it was going to reverse — every single day — before it happened?
Not with vague arrows. Not with repainting signals. Not with some black-box algorithm that leaves you guessing.
But with the most honest, most reliable, most universally respected structure in all of trading: the previous daily candle's high and low.
That's it. That's the edge.
FREE

-- Просто, но эффективно. Индикатор инверсии - Что это такое?
Индикатор, следующий за трендом, который сочетает в себе логику SuperTrend и технологию экспоненциальной кривой. Он определяет направление тренда, рисует динамический канал на графике и отправляет оповещения в режиме реального времени, когда тренд меняется.
Как он работает?
Индикатор рассчитывает экспоненциальную базовую линию с использованием ATR и коэффициента SuperTrend. Когда цена закрывается выше или ниже этой базовой линии, п
FREE

ALPHABET SMC PRO is an advanced Smart Money Concepts engine designed to identify critical price action setups, including Fair Value Gaps (FVG), Order Blocks (OB), Break of Structure (BOS), and Change of Character (CHoCH). This indicator helps you visualize key market liquidity zones to support precise trading decisions and market structure analysis.
FREE

SIMBA MarketPicker SIMBA MarketPicker is a MetaTrader 5 indicator designed for market scanning, comparison, and market selection . It is provided free of charge and is intended to help traders organize multiple instruments in one view, compare their current technical conditions, and identify markets that may deserve further analysis. iInstead of examining every symbol individually, MarketPicker provides a structured view of configured markets and applies the same analytical framework across them
FREE

Большинство трендовых индикаторов вынуждают выбирать: быстрые сигналы с постоянными ложными входами или сглаженный вывод, пропускающий входы на 20 баров. Проблема не в скользящей средней — в том, что волатильность меняется, а индикатор нет.
Meridian Trend — это адаптивный трендовый индикатор со встроенной нормализацией волатильности и фильтрацией моментума. Адаптируется в реальном времени — идентичное поведение при торговле EURUSD, Bitcoin или Nasdaq. Без настройки по инструментам. Одна конфиг
FREE

Pure SMC is a professional Smart Money Concepts (SMC) based trading indicator designed to help traders analyze institutional market behavior, liquidity movements, and price structure directly on the MetaTrader 5 platform. The indicator focuses on real market structure analysis instead of traditional lagging signals. It helps traders identify important institutional areas such as Break of Structure (BOS), Change of Character (CHoCH), Order Blocks, Fair Value Gaps (FVG), and Liquidity Zones. Main
FREE

Price Sessions is an exclusive MetaTrader 5 indicator that integrates symbol information and trading sessions into your chart. It does not link to any account information or external sources, ensuring user safety. Main Features: 1. Symbol Information Current Symbol Live Price Live Spread 2. Trading Sessions (Time zone UTC/GMT+0) Tokyo session London session New York session If you find this utility helpful, please rate it. If you encounter any issues or have suggestions, pleas
FREE

Volume Profile FAN Indicator
One-line description: Displays volume profile histogram on the left/right side of the chart, showing volume distribution across price levels to identify key support and resistance zones.
Core Features: - Volume Profile Histogram: Divides price range into N levels and calculates volume for each level - POC (Point of Control): Price level with highest volume, displayed as thick orange line - Value Area (VAH/VAL): Price zone containing 70% of total volume, shown as r
FREE

The Simple Background MT5 indicator was created to provide traders with the ease of customizing their MetaTrader interface with a preferred background/wallpaper image. It's very straightforward.
Let's get straight to the point:
1. Install the indicator;
2. Choose your preferred image in formats such as jpg, png, etc. Open the image in Paint and save it as a .bmp file;
3. After saving the image as a .bmp file, place it in the images folder (following this path in the MQL5 terminal: \Images);
FREE

Это активно поддерживаемый релиз, переработанный и расширенный для текущих сборок MT5.
То же расстояние стоп-лосса или размер позиции, которые подходят для спокойного рынка, могут оказаться слишком узкими или слишком большими при изменении волатильности. Оценивать такое изменение на глаз, опираясь исключительно на исходное значение ATR, ненадежно.
Индикатор Phoenix ATR Volatility Meter сравнивает текущее значение ATR с его собственной недавней историей, благодаря чему вы можете увидеть, являе
FREE

NY Opening Range 9:30 Indicator: The NY Opening Range 9:30 indicator is a precision-engineered tool for MetaTrader 5, specifically designed for "Opening Range Breakout" (ORB) traders. It focuses on the high-volatility window that occurs during the New York market open—the most liquid period for indices, equities, and major currency pairs. By identifying and visualizing the price boundaries established in the first few minutes of trading, it provides a definitive structural framework for the rest
FREE

¿Qué hace exactamente? Este Indicador rastrea el gráfico de forma automática para calcular y dibujar Zonas de Oferta (Supply) y Zonas de Demanda (Demand) basándose puramente en la acción del precio. Identifica puntos clave: Busca patrones estructurales (swings de 3 velas) donde el precio ha marcado un máximo o un mínimo importante. Filtra por volatilidad: Utiliza el ATR (Average True Range) para medir la fuerza del movimiento y asegurarse de que la zona trazada tiene un tamaño lógico y no es so
FREE
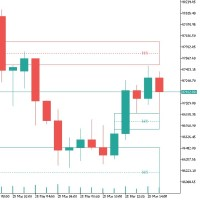
Имбаланс в трейдинге: основы и стратегии Имбаланс в трейдинге — это явление, при котором на рынке наблюдается дисбаланс между спросом и предложением. Это может проявляться как избыток ордеров на покупку (бычий имбаланс) или на продажу (медвежий имбаланс), что приводит к неэффективному ценообразованию и создает возможности для трейдеров. Технические аспекты - «Свечная Модель»: имбаланс часто представлен трехсвечной моделью, где вторая свеча длиннее остальных и определяет направление движения. - «
FREE

Mapa płynności KREDZIA organizuje aktywną płynność opartą na brokerach powyżej i poniżej ceny, pomagając inwestorom planować potencjalne cele płynności i monitorować obszary, w których może rozwinąć się zmiatanie, reakcja lub odwrócenie.
PEŁNY OPIS Ważne maksima i minima mogą stanowić potencjalne cele w zakresie wykorzystania płynności, ale ręczne śledzenie bieżących poziomów wraz ze starszymi, niesprawdzonymi odniesieniami szybko staje się trudne. Mapa płynności KREDZIA tworzy ustrukturyzowa
FREE

QQE Kalman Hybrid
Smarter Trend Detection. Faster Entries. Cleaner Decisions. QQE Kalman Hybrid is built to help you act on what’s happening now.
This momentum and trend confirmation indicator combines the proven structure of classic QQE logic with a modern Kalman adaptive engine designed to reduce lag, smooth noise, and surface high-quality trade opportunities earlier.
The result is a clean, decision-focused tool that helps traders identify:
What’s the trend structure? Where’s the best
FREE
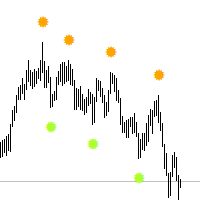
Think of the Super Fractal Indicator as the Bill WIlliams Indicator on Steroids. Indicator Abilities: 1. Adjust Candle around Fractal High or Low. 2. Adjust Lookback period and only plot for a specific number of history candles avoiding cluttering your trading desk. 3. The Indicator uses buffers so you call and use it from any EA.
Note : The higher the candles around Fractal, the stronger the Turning point anfd viceversa is true.
FREE
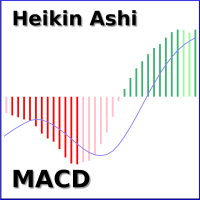
This is the moving average convergence divergence (MACD) indicator based on Heikin Ashi calculations. Here you find multi-colored histogram which corresponds to bull (green) / bear(red) trend. Dark and light colors describes weakness/strenght of price trend in time. Also you can switch calculations between normal and Heikin Ashi price type.
Note: Buffers numbers for iCustom: 0-MACD, 2-Signal line
FREE

Technical and Professional Description of the Indicator Price Structure, Fibonacci, Financial Volume, and Interest Zone Indicator This indicator was developed based on in-depth studies of price structure, Fibonacci levels, financial volume behavior, and the identification of market interest zones . Its primary purpose is to transform these different analytical elements into a structured visual tool, allowing users to identify key levels and areas of greater structural relevance on the chart in a
FREE

Volume Profile показывает, где накопился объём по ценам за последние N баров. Он рисует горизонтальную гистограмму справа от последнего бара и отмечает три опорных уровня: Point of Control, а также верхнюю и нижнюю границы Value Area.
Как это работает - Ценовой диапазон последних N баров (по умолчанию 200) делится на строки (по умолчанию 40). - Объём каждого бара равномерно распределяется по его диапазону high-low и добавляется к строкам, которых он касается. Можно использовать тиковый объём (в
FREE

Индикатор TWAP/VWAP - это профессиональный инструмент технического анализа, который отображает на графике две важные скользящие средние: TWAP (Time Weighted Average Price) - средневзвешенная по времени цена. Рассчитывается как простое среднее арифметическое цен закрытия за указанный период. VWAP (Volume Weighted Average Price) - средневзвешенная по объему цена. Рассчитывается с учетом типичной цены (high+low+close)/3, взвешенной по объему торгов. Ключевые особенности: Двойной индикатор в о
FREE

MT4 Version Most indicators draw lines.
This one draws the battlefield. If you ever bought an EA or indicator based on a perfect equity curve — and then watched it bleed out live — you’re not alone.
The problem? Static logic in a dynamic market. Fibonacci Bollinger Bands adapts.
It combines Bollinger structure with customizable Fibonacci levels to mark zones of control — where price reacts, pauses, or reverses. No magic. Just logic that follows volatility. Why this tool matters It
FREE

Aegis Current Force
Aegis Current Force is a professional signal indicator designed to identify structured trading opportunities using market direction, trend strength, momentum recovery, and predefined risk levels.
The indicator combines an internal Gann and Fibonacci price-alignment engine with ADX directional confirmation and CCI recovery filtering. A signal appears only when the selected conditions agree, helping reduce weak and unstructured entries.
BUY and SELL arrows are displayed dir
FREE
А знаете ли вы, почему MetaTrader Market - лучшее место для продажи торговых стратегий и технических индикаторов? Разработчику у нас не нужно тратить время и силы на рекламу, защиту программ и расчеты с покупателями. Всё это уже сделано.

Вы упускаете торговые возможности:
- Бесплатные приложения для трейдинга
- 8 000+ сигналов для копирования
- Экономические новости для анализа финансовых рынков
Регистрация
Вход
Вы принимаете политику сайта и условия использования
Если у вас нет учетной записи, зарегистрируйтесь