• Visão global
  • Comentários
  • Discussão
  • O que há de novo

Nine Lives of ADX

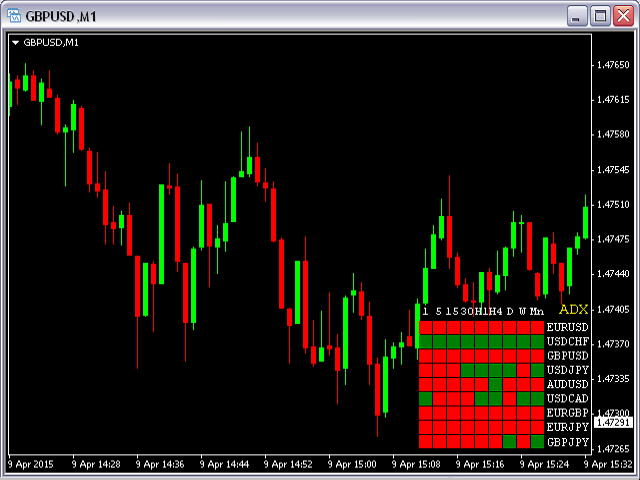
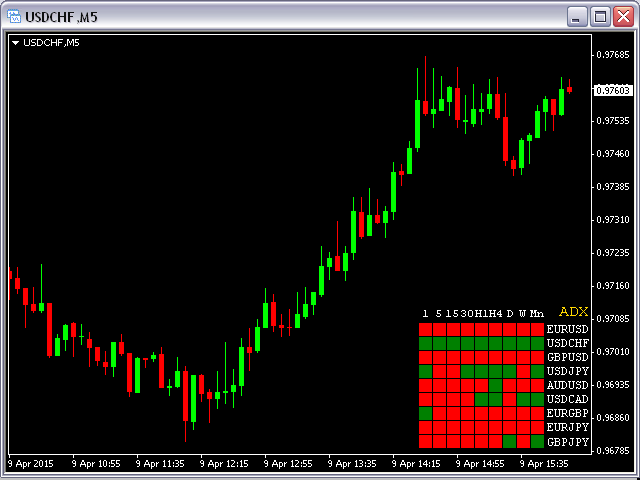
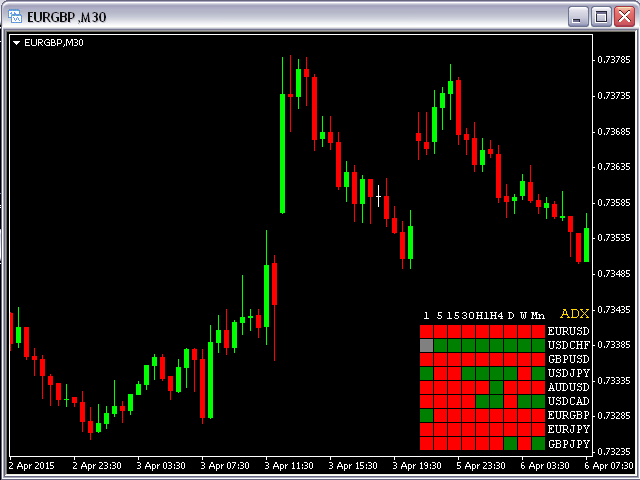
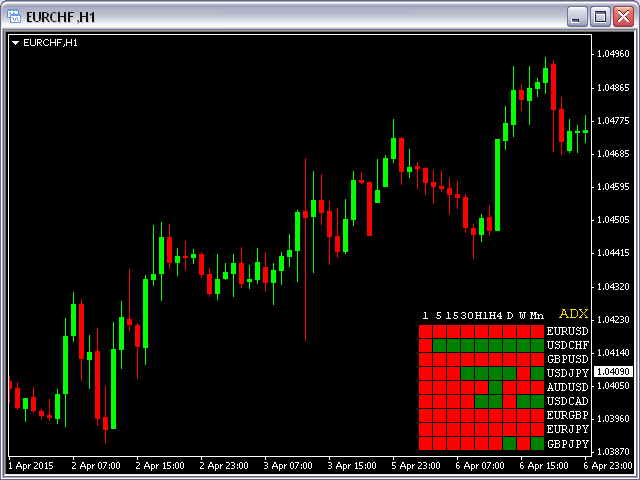
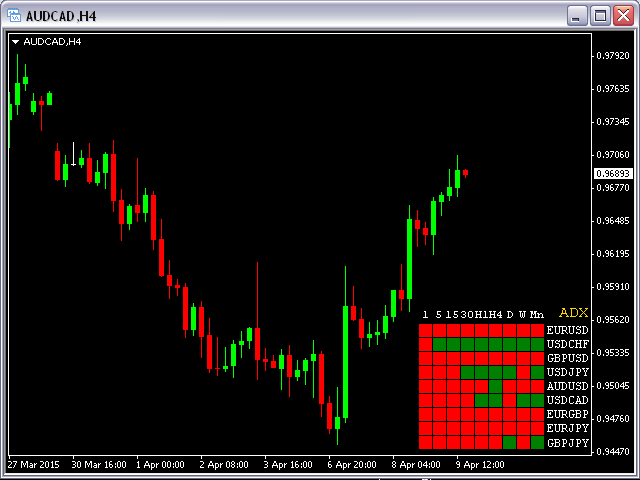
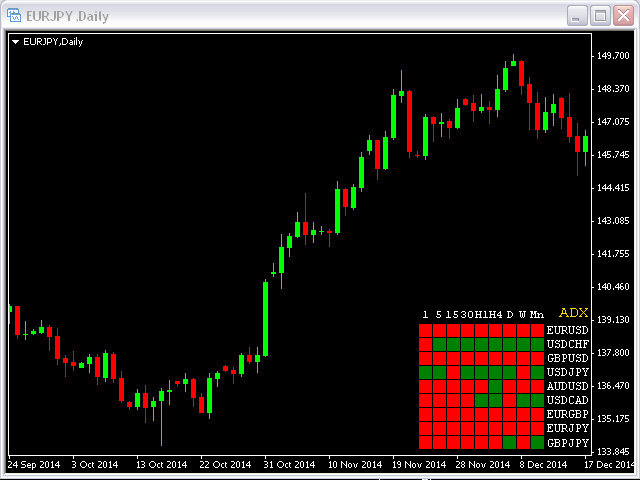
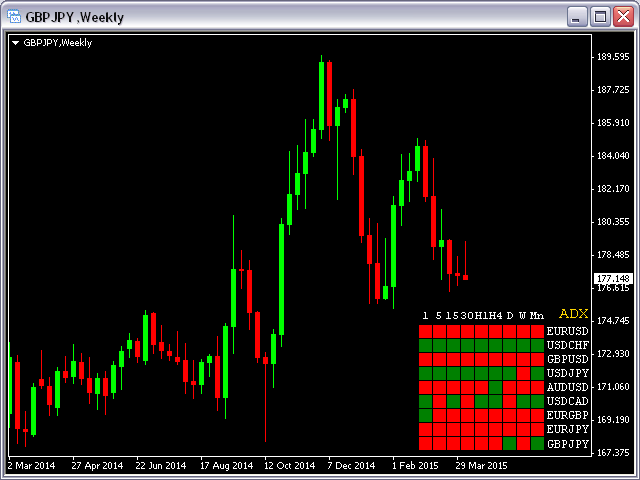
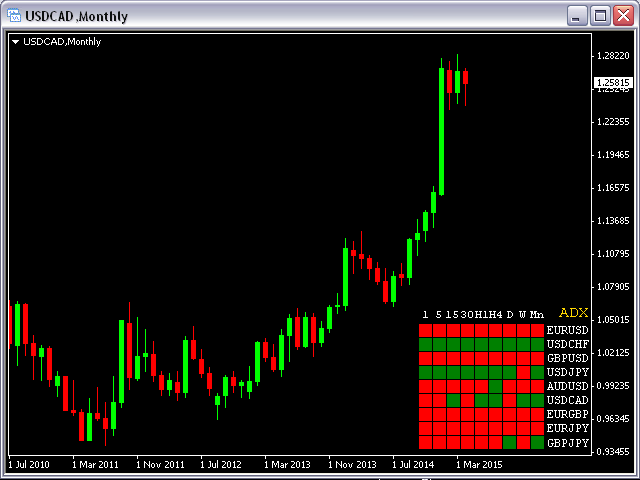
The Average Directional Index (ADX), Minus Directional Indicator (-DI) and Plus Directional Indicator (+DI) represent a group of directional movement indicators that form a trading system.

This indicator shows ADX data from 9 currency pairs by your choice for all 9 Time Frames.

Input parameters

  • From Symb1 to Symb9 - you may change any of this Symbol to any legal currency pair existed on your platform.
  • MainLine = false; - if TRUE then the ADX measures trend strength without regard to trend direction will be used
  • adxPeriod = 14; - averaging period for the ADX.
  • appPrice = PRICE_CLOSE; - applied price for the ADX.
  • SymbColor = clrWhite; - you may change the color of all labels.
Produtos recomendados
MA3 Trend MT4
Sergei Linskii
4.5 (2)
MA3 Trend - is the good trend indicator  on three MAs.   Benefits of the indicator: The indicator produces signals with high accuracy. The confirmed signal of the indicator does not disappear and is not redrawn. You can trade on the MetaTrader 4 trading platform of any broker. You can trade any assets (currencies, metals, cryptocurrencies, stocks, indices etc.). You can trade on any timeframes (M5-M15 scalping and day trading / M30-H1 medium-term trading / H4-D1 long-term trading). Indiv
FREE
Smart Reversal Signal  is a professional indicator for the MetaTrader 4 platform; it has been developed by a group of professional traders. This indicator is designed for Forex and binary options trading. By purchasing this indicator, you will receive: Excellent indicator signals. Free product support. Regular updates. Various notification options: alert, push, emails. You can use it on any financial instrument (Forex, CFD, options) and timeframe. Indicator Parameters Perod - indicator calcula
Современный индикатор паттернов PinBar по торговой стратегии RAIT. Работает по тренду и без него. Имеет настройки таймфрейма для отображения. Можно настроить количество баров для отображения индикатора на графике. Используется несколько паттернов PinBar. Индикатор предпочтительно использовать на часовом таймфрейме и выше,   но работает и ниже   . Паттерны:  PinBar, InsPinBar, PinInside. Отображаются одной стрелкой.
*This is tradingview indicator converted to mql4* The Chandelier Exit Indicator is a popular technical analysis tool developed by Chuck LeBeau. It is designed to help traders identify potential exit points for their trades based on market volatility and the concept of trailing stops. The Chandelier Exit Indicator consists of three main components: Average True Range (ATR): The indicator utilizes the Average True Range, which measures market volatility. The ATR calculates the average range bet
StatPredict
Aleksey Ivanov
Introdução.              O indicador prevê o preço de acordo com a tendência prevalecente e as suas próprias pequenas flutuações estatísticas de preço. No StatPredict, você precisa definir o horizonte de tempo dos eventos previstos, que é definido pelas configurações de parâmetros do indicador « Length of forecast in bars» e determinado pela escala de tempo característica da tendência atual, que é melhor medida pelo indicador ProfitMACD .                         O cálculo final das leituras do i
Custom Pattern Detector Indicator This indicator lets you define your own custom pattern instead of the typical candlestick patterns. Everybody already knows about common candlestick patterns like the Doji pattern. This indicator is different though. The pattern you will define is a custom pattern based on CANDLE FORMATIONS . Once the indicator knows the pattern you want it to look for, then it will go through history on the chart and find matching patterns, make them visible to you, and calcul
FREE
The indicator allows you to trade binary options. The recommended time frame is М1 and the expiration time is 1,2,3 minutes. The indicator suitable for auto and manual trading. A possible signal is specified as a arrows above/under a candle. You should wait until the candle closes! Arrows are not re-painted Trade sessions: TOKYO section (Half-end) Currency pairs: USD/JPY Working time frame: M1 Expiration time: 1,2,3 minutes. The indicator also shows good results when using the martingale strateg
FREE
Gecko
Profalgo Limited
4.4 (10)
NEW PROMO: Only a few copies copies available at 349$ Next price: 449$ Make sure to check out our " Ultimate EA combo package " in our   promo blog ! Gecko runs a simple, yet very effective, proven strategy.  It looks for important recent high and lows and will trade the breakouts.  The actual execution of this strategy however, is what makes this EA truly shine.  Entry calculations and exit algorithms are not only unique but also very advanced. LIVE RESULTS: https://www.mql5.com/en/signals/7
EZT MultiTF CCI
Tibor Rituper
5 (2)
This indicator can display 1-3 CCI indicator on different time frames and settings. The active indicators can give visual and sound alert on oversold/overbought level if the user choose that option. Alert can be set on one or all active indicator, even if the time frame, the period and the oversold/overbought level different on each. There is a display panel with buttons on the main chart, what is show the active indicators and their settings. There is an option to hide this panel. With the butt
FREE
This indicator softens the value of the RSI (Relative Strength Index) and reduces its volatility. You can use this indicator in your expert advisors, indicators and strategies. With this indicator, you don't need to have two indicators on the chart at the same time. For example, an RSI indicator and a Moving Average indicator If you have any questions or concerns, contact me.
FREE
Professional histogram   (PH) é uma ferramenta altamente eficiente e confiável para negociar forex, CFDs e opções binárias. O PH é fácil de usar e configurar para iniciantes e comerciantes experientes. Ao contrário da maioria dos indicadores, o Professional Histogram encontra tendências mais longas e fornece menos sinais falsos. Quando uma compra ou um sinal de venda aparece, um alerta é acionado, permitindo que você abra uma posição em tempo hábil e evite ficar sentado no seu PC o tempo
Padrão de barra de acumulação de indicador Forex para MT4 O indicador "Barra de Acumulação" é um indicador muito poderoso, focado em breakouts, para negociação de Price Action O indicador detecta acumulação de preços em área estreita durante 1 barra e mostra: direção de rompimento, ordem pendente e locais de SL Barra de acumulação de alta - sinal de seta azul no gráfico (ver fotos) Barra de acumulação de baixa - sinal de seta vermelha no gráfico (ver fotos) Sem repintura; Sem atrasos; Alta re
Infinity Trend Pro
Yaroslav Varankin
1 (1)
This is a trend indicator without redrawing Developed instead of the binary options strategy (by the color of the Martingale candlestick) Also works well in forex trading When to open trades (binary options) A signal will appear in the place with a candle signaling the current candle It is recommended to open a deal for one candle of the current timeframe M1 and M5 When a blue dot appears, open a deal up When a red dot appears, open a trade down. How to open trades on Forex. When a signal is rec
Iceberg Divergen Indicator
Komang Putra Riswanjaya
5 (2)
Iceberg Divergence Indicator will help traders to find divergent patterns that occur on the charts very easily and simply This indicator will visualize divergences pattern that occur on the chart by combining it with an awesome oscillator indicator Key Features: Easy to use : The Iceberg divergent indicator is made as simple as possible so that it is easy to use Pattern Visualization : Divergent patterns will be visualized on the live chart Precision : The indicator detects divergent patterns
FREE
MA on Fractals is a professional trend-following indicator for MetaTrader 4 . It builds a moving average using Bill Williams' fractals. We believe that MA on Fractals is much more efficient than a standard moving average. Its combination with other indicators allows receiving more accurate trading signals. It is most suitable for M15, M30, H1 and H4. Advantages Unique indicator. Generates minimum false signals. Suitable for beginners and experienced traders. Simple and easy indicator configur
Owl smart levels
Sergey Ermolov
4.63 (54)
Versão MT5  |  FAQ O   Indicador Owl Smart Levels   é um sistema de negociação completo dentro de um indicador que inclui ferramentas populares de análise de mercado, como   fractais avançados de Bill Williams , Valable ZigZag que constrói a   estrutura de onda correta   do mercado e   níveis de Fibonacci que marcam os níveis exatos de entrada no mercado e lugares para obter lucros. Descrição detalhada da estratégia Instruções para trabalhar com o indicador Consultor de negociação Owl Helper Ch
This indicator is a visual combination of 2 classical indicators: Bulls and MACD. The main idea behind the MACD is that it subtracts the longer-term moving average from the shorter-term moving average. This way it turns a trend-following indicator into the momentum one and combines the features of both. Usage of this indicator could be the same as both classical indicators separately or combined. Input parameters: BullsPeriod = 9; maMethod = MODE_SMA;  ENUM_MA_METHOD maPrice = PRICE_CLOSE;  ENUM
This candlestick indicator searches for candlesticks, at which the direction on all selected timeframes coincides (M1, M5, M15, M30, H1, H4, D1, W1, MN). For example, if the candlestick on all timeframes is rising (bullish) or falling (bearish). You can: Turn off the display of unnecessary arrows and leave, for example, only those showing changes in signal direction, i.e. only the first arrow in each direction. Set the candlestick for the signal: the zero candlestick or a completely formed one.
Power Currency
PHAM KIM QUY RuaCoder
Rua Power Currency This is an indicator that measures the strength of each currency based on current data. Indicator allows selecting timeframe to calculate the power of money. High timeframes like H4, H1, D1 are often used to identify trends. Smaller timeframes are often used to fight Scalping. Input parameters: Seconds: Time to refresh the data x: coordinates x y: y coordinates Timeframe: timeframe retrieves data Period: Period A product of Ruacoder.
FREE
The Crossing
Anton Iudakov
5 (1)
+ 2 bonus strategies! Alerts! I recommend watching my advisor -   Night Zen EA The indicator combines the most popular moving average strategies: Simple moving average crossover. Moving average crossover relative to the position of the slower moving average. 2 bonus strategies : The crossing of the fast moving average with the calculation of the opening prices of the slow moving average with the calculation of the closing prices taking into account the slower moving average. (The settings for th
FREE
GT Trend M1
Oleg Rodin
5 (5)
GT Trend é um indicador de tendência especialmente projetado para negociação em gráficos M1 e M5 . O indicador é ideal para traders que preferem negociações intradiárias. Você pode usar este indicador como base para o seu sistema de negociação ou como uma solução de negociação independente. O indicador é fácil de usar. Você só precisa seguir os sinais. Também fornecerei indicadores adicionais para todos os usuários deste indicador gratuitamente, o que ajudará a usar esse método da maneira mais e
Alligator Analysis
Aleksey Ivanov
4.75 (4)
Indicator description.            The “ Alligator Analysis ” ( AA ) indicator allows you to build various (by averaging types and by scales) “ Alligators ” and their combinations, i.e. allows you to analyze the state of the market based on the correlation of this state with a whole range of different " Alligators ".  The classic " Alligator " by Bill Williams is based on moving averages and Fibonacci numbers, which makes it one of the best indicators now. The classic " Alligator "   is based on
FREE
The indicator of a Professional Trader is an arrow indicator for predicting the direction of price movement. I have been working on this indicator since 2014. You can use this indicator as your main indicator, use its entry signals, and use it as your only indicator to find entry points. About the product: Recommended TF [H4-D1-W1]   . The indicator predicts the direction of the next candle. Fits a variety of tools; Flexibility in settings for different instruments and intervals through the
Market Structure Zig Zag
Lesedi Oliver Seilane
4.77 (22)
Free Market structure zig zag to assist in price action trading the screenshots describe how to use and how to spot patterns new version comes with alerts, email alert and  push notification alert can be used on all pairs  can be used on all timeframes  you can add additional confirmation indicators the indicator shows you your higher high and low highs as well as your lower lows and lower highs  the indication makes price action analysis easier to spot.
FREE
The zero line is characterized the Flat trend. V-shaped impulse indicates the entrance to the opposite direction. U-shaped impulse = entry orders in the same direction. If AlertsEnabled = true, the indicator will show the Alert (message window) with a text like this: "Price going Down on ", Symbol(), " - ", Period(), " min", " price = ", Bid; If eMailEnabled = true the indicator will send you an eMail with the same text an Alert message with subject: "Trinity-Impolse" (of course you have to
StarSwing
Gabriele Tedeschi
StarSwing è un indicatore NO REPAINT che unisce in un unico strumento oscillatori e indicatori di forza.  I parametri esterni permettono di bilanciare il peso delle componenti e di regolare a proprio piacimento l'indicatore stesso. StarSwing, graficamente, è composto da segmenti di 2 colori: uno rappresentante il rialzo e uno il ribasso. Il colore non dipende dalla pura direzione del segmento ma dal trend di fondo calcolato dall'indicatore stesso. Sul grafico, si può far disegnare una media mobi
Trend PA
Mikhail Nazarenko
5 (3)
The Trend PA indicator uses   Price Action   and its own filtering algorithm to determine the trend. This approach helps to accurately determine entry points and the current trend on any timeframe. The indicator uses its own algorithm for analyzing price changes and Price Action. Which gives you the advantage of recognizing, without delay, a new nascent trend with fewer false positives. Trend filtering conditions can be selected in the settings individually for your trading style. The indicator
Imagic01
Aleksandr Morozov
The indicator represents 4 moving averages, shifted back. Created, like any moving average indicators, in order to see the approximate balance of volatility and the number of bulls and bears. The difference from other Moving Averages is that an attempt is made here to bring the moving averages of different periods to a common denominator, respectively, to bring the number of traders trading on different timeframes to a common denominator. The indicator is distributed as is. MnojitelMA1, Mnoji
FREE
Rosoku Robot
Hong Ling Mu
3 (2)
This EA has a very unique logic, meaning it does not use any indicators at all. It relies solely on monitoring the movement of candlesticks to determine entries. Specifically, it enters trades when certain conditions are met, such as the relationship between the previous candlestick and the current candlestick, or the timing of new highs or lows being reached. The number of entries is not significant, but it consistently generates profits by increasing the lot size when a loss occurs. Please T
FREE
Smart Line is a trend indicator. It helps you find trend reversal points. This trading strategy is designed for trend trading. The indicator algorithm accurately determines the trend on various trading instruments, at different time intervals. The Smart Line indicator can be used as an additional tool, or as the main one. The color of the indicator lines changes depending on the current trend, as well as built-in indicators of possible entries in the position, indicated by arrows. Paramet
Os compradores deste produto também adquirem
Gann Made Easy
Oleg Rodin
4.95 (44)
Gann Made Easy é um sistema de negociação Forex profissional e fácil de usar, baseado nos melhores princípios de negociação usando a teoria do sr. W. D. Gann. O indicador fornece sinais precisos de COMPRA e VENDA, incluindo níveis de Stop Loss e Take Profit. Você pode negociar mesmo em movimento usando notificações PUSH. Entre em contato comigo após a compra! Vou compartilhar minhas dicas de negociação com você e ótimos indicadores de bônus de graça! Provavelmente você já ouviu muitas vezes sobr
Apresentamos o Indicador Milagroso de Forex: Desencadeie o Poder da Negociação Precisa Você está cansado de procurar o melhor indicador de Forex que realmente ofereça resultados excepcionais em todos os períodos de tempo? Não procure mais! O Indicador Milagroso de Forex chegou para revolucionar sua experiência de negociação e impulsionar seus lucros a novas alturas. Construído com base em tecnologia de ponta e anos de desenvolvimento meticuloso, o Indicador Milagroso de Forex se destaca como o á
Actualmente 20% OFF ! A melhor solução para qualquer novato ou comerciante especializado! Este software de painel de instrumentos está a funcionar em 28 pares de moedas. É baseado em 2 dos nossos principais indicadores (Advanced Currency Strength 28 e Advanced Currency Impulse). Dá uma grande visão geral de todo o mercado Forex. Mostra valores avançados de força da moeda, velocidade de movimento da moeda e sinais para 28 pares de divisas em todos os (9) períodos de tempo. Imagine como a sua
Atomic Analyst
Issam Kassas
5 (1)
Primeiramente, vale ressaltar que este Indicador de Negociação não repinta, não redesenha e não apresenta atrasos, tornando-o ideal tanto para negociação manual quanto automatizada. O Analista Atômico é um Indicador de Ação de Preço PA que utiliza a força e o momentum do preço para encontrar uma vantagem melhor no mercado. Equipado com filtros avançados que ajudam a remover ruídos e sinais falsos, e aumentam o potencial de negociação. Utilizando múltiplas camadas de indicadores complexos, o A
TPSproTREND PrO
Roman Podpora
5 (15)
TPSpro TRENDPRO  - is a trend indicator that automatically analyzes the market and provides information about the trend and each of its changes, as well as giving signals for entering trades without redrawing! The indicator uses each candle, analyzing them separately. referring to different impulses - up or down impulse. Exact entry points into transactions for currencies, crypto, metals, stocks, indices!  -  Version MT5               DETAILED DESCRIPTION        /       TRADING SETUPS           
TPSpro RFI Levels
Roman Podpora
5 (13)
A key element in trading is zones or levels from which decisions to buy or sell a trading instrument are made. Despite attempts by major players to conceal their presence in the market, they inevitably leave traces. Our task was to learn how to identify these traces and interpret them correctly. Reversal First Impulse levels (RFI)   -  Version MT5                INSTRUCTIONS                 RUS                 ENG                                       R ecommended to use with an indicator   -  
Apresentando       Quantum Trend Sniper Indicator   , o inovador Indicador MQL5 que está transformando a maneira como você identifica e negocia as reversões de tendência! Desenvolvido por uma equipe de traders experientes com experiência comercial de mais de 13 anos,       Indicador de Atirador de Tendência Quântica       foi projetado para impulsionar sua jornada de negociação a novos patamares com sua forma inovadora de identificar reversões de tendência com precisão extremamente alta. ***C
Gold Stuff
Vasiliy Strukov
4.89 (250)
Gold Stuff-um indicador de tendência projetado especificamente para o ouro, também pode ser usado em qualquer instrumento financeiro. O indicador não é redesenhado ou atrasado. O timeframe recomendado é H1. O EA Gold Stuff Expert Advisor está escrito neste indicador, você pode encontrá-lo no meu perfil. Importante! Entre em contato comigo imediatamente após a compra para obter instruções e bônus! PARÂMETRO Draw Arrow-incl.desligado. desenhar setas no gráfico. Alertas-ligado.desligado.al
ACTUALMENTE COM 26% DE DESCONTO A melhor solução para qualquer novato ou comerciante especializado! Este Indicador é uma ferramenta comercial única, de alta qualidade e acessível, porque incorporámos uma série de características proprietárias e uma nova fórmula. Com apenas UM gráfico, pode ler a força da moeda para 28 pares de Forex! Imagine como a sua negociação irá melhorar porque é capaz de apontar o ponto exacto do gatilho de uma nova tendência ou oportunidade de escalada? Manual do u
TrendMaestro
Stefano Frisetti
5 (2)
note: this indicator is for METATRADER4, if you want the version for METATRADER5 this is the link: TRENDMAESTRO recognizes a new TREND in the bud, he never makes mistakes. The certainty of identifying a new TREND is priceless. DESCRIPTION TRENDMAESTRO identifies a new TREND in the bud, this indicator examines the volatility, volumes and momentum to identify the moment in which there is an explosion of one or more of these data and therefore the moment in which prices have strong probability of f
Scalper Inside PRO
Alexey Minkov
4.75 (55)
An exclusive indicator that utilizes an innovative algorithm to swiftly and accurately determine the market trend. The indicator automatically calculates opening, closing, and profit levels, providing detailed trading statistics. With these features, you can choose the most appropriate trading instrument for the current market conditions. Additionally, you can easily integrate your own arrow indicators into Scalper Inside Pro to quickly evaluate their statistics and profitability. Scalper Inside
Antes de tudo, vale ressaltar que esta Ferramenta de Negociação é um Indicador Não Repintante, Não Redesenhante e Não Atrasado, o que a torna ideal para negociação profissional. O Indicador de Conceitos de Ação de Preço Inteligente é uma ferramenta muito poderosa tanto para traders novos quanto experientes. Ele combina mais de 20 indicadores úteis em um único, combinando ideias avançadas de negociação como Análise do Trader do Círculo Interno e Estratégias de Negociação de Conceitos de Dinhei
Trend Screener
STE S.S.COMPANY
4.83 (86)
Indicador de tendência, solução única inovadora para negociação e filtragem de tendências com todos os recursos de tendências importantes construídos dentro de uma ferramenta! É um indicador multi-timeframe e multi-moedas 100% sem repintura que pode ser usado em todos os símbolos/instrumentos: forex, commodities, criptomoedas, índices e ações. O Trend Screener é um indicador eficiente que segue a tendência do indicador que fornece sinais de tendência de seta com pontos no gráfico. Os recursos qu
XQ Indicator MetaTrader 4
Marzena Maria Szmit
3 (2)
Step into the realm of Forex trading with confidence and precision using XQ, a cutting-edge Forex indicator designed to elevate your trading game to unprecedented heights. Whether you're a seasoned trader or just stepping into the world of currency exchange,   XQ Forex Indicator   empowers you with the insights and signals needed to make informed trading decisions. The signal conditions are a combination of three indicators, and XQ Forex Indicator only display  medium and long-term trends . The
Quantum Breakout Indicator PRO
Bogdan Ion Puscasu
4.96 (26)
Apresentando       Quantum Breakout PRO   , o inovador Indicador MQL5 que está transformando a maneira como você negocia Breakout Zones! Desenvolvido por uma equipe de traders experientes com experiência em negociação de mais de 13 anos,   o Quantum Breakout PRO   foi projetado para impulsionar sua jornada comercial a novos patamares com sua estratégia inovadora e dinâmica de zona de rompimento. O Quantum Breakout Indicator lhe dará setas de sinal em zonas de breakout com 5 zonas-alvo de luc
O sistema PRO Renko é um sistema de negociação altamente preciso especialmente concebido para a negociação de gráficos RENKO. Trata-se de um sistema universal que pode ser aplicado a vários instrumentos de negociação. O sistema neutraliza eficazmente o chamado ruído de mercado, dando-lhe acesso a sinais de inversão precisos. O indicador é muito fácil de usar e tem apenas um parâmetro responsável pela geração de sinal. Você pode facilmente adaptar a ferramenta a qualquer instrumento de negoc
FX Power MT4 NG
Daniel Stein
5 (8)
Receba a sua atualização diária do mercado com detalhes e screenshots através do nosso Morning Briefing aqui no mql5 e no Telegram ! O FX Power MT4 NG é a próxima geração do nosso medidor de força de moeda muito popular de longa data, o FX Power. E o que é que este medidor de força da próxima geração oferece? Tudo o que adorou no FX Power original MAIS Análise de força GOLD/XAU Resultados de cálculo ainda mais precisos Períodos de análise configuráveis individualmente Limite de cálculo personal
Apresentamos o ON Trade Waves Patterns Harmonic Elliot Wolfe, um indicador avançado projetado para detectar diversos tipos de padrões no mercado, usando métodos manuais e automáticos. Aqui está como ele funciona: Padrões Harmônicos: Este indicador pode identificar padrões harmônicos que aparecem em seu gráfico. Esses padrões são essenciais para traders que praticam a teoria de negociação harmônica, conforme popularizada no livro de Scott Carney "Harmonic Trading vol 1 e 2". Seja desenhando-os m
Advanced Supply Demand
Bernhard Schweigert
4.92 (310)
Atualmente com 33% de desconto! A melhor solução para qualquer Trader Novato ou especialista! Este indicador é uma ferramenta de negociação exclusiva, de alta qualidade e acessível porque incorporamos uma série de recursos proprietários e uma nova fórmula. Com esta atualização, você poderá mostrar fusos horários duplos. Você não só será capaz de mostrar um TF mais alto, mas também mostrar ambos, o TF do gráfico, MAIS o TF mais alto: MOSTRANDO ZONAS ANINHADAS. Todos os traders de Oferta e Demanda
Descubra o segredo da negociação forex bem -sucedida com nosso indicador MT4 personalizado! Você já se perguntou como obter sucesso no mercado de Forex, obtendo lucros consistentemente e minimizando o risco? Aqui está a resposta que você está procurando! Permita -nos apresentar nosso indicador proprietário do MT4 que revolucionará sua abordagem à negociação. Versatilidade única Nosso indicador foi projetado especialmente para usuários que preferem as formações de vela Renko e Rangebar. En
Currency Strength Wizard é um indicador muito poderoso que fornece uma solução completa para uma negociação bem-sucedida. O indicador calcula o poder deste ou daquele par forex usando os dados de todas as moedas em vários intervalos de tempo. Esses dados são representados em uma forma de índice de moeda fácil de usar e linhas de energia de moeda que você pode usar para ver o poder desta ou daquela moeda. Tudo o que você precisa é anexar o indicador ao gráfico que deseja negociar e o indicador mo
Scalper Vault
Oleg Rodin
5 (27)
Scalper Vault é um sistema profissional de escalpelamento que fornece tudo o que você precisa para um escalpelamento bem-sucedido. Este indicador é um sistema de negociação completo que pode ser usado por comerciantes de forex e opções binárias. O período de tempo recomendado é M5. O sistema fornece sinais de seta precisos na direção da tendência. Ele também fornece sinais superiores e inferiores e níveis de mercado Gann. Os indicadores fornecem todos os tipos de alertas, incluindo notificações
Entry Points Pro
Yury Orlov
4.7 (224)
Este é um indicador para MT4 que fornece sinais precisos para entrar em uma negociação sem redesenhar. Ele pode ser aplicado a qualquer ativo financeiro: forex, criptomoedas, metais, ações, índices. Ele fornecerá estimativas bastante precisas e informará quando é melhor abrir e fechar um negócio. Assista o vídeo (6:22) com um exemplo de processamento de apenas um sinal que compensou o indicador! A maioria dos traders melhora seus resultados de negociação durante a primeira semana de negociação c
Antes de mais nada, vale ressaltar que este Sistema de Negociação é um Indicador Não Repintado, Não Redesenhado e sem Atrasos, o que o torna ideal para negociações profissionais. O "Sistema de Negociação de Suporte e Resistência Inteligente" é um indicador avançado projetado para traders novos e experientes. Empodera os traders com precisão e confiança no mercado forex. Este sistema abrangente combina mais de 7 estratégias, 10 indicadores e vários métodos de negociação, incluindo estratégias
TrendDecoder Premium
Christophe, Pa Trouillas
5 (2)
Identifica os intervalos e os próximos movimentos prováveis   |  Obter os primeiros sinais e a força das tendências   |  Obter saídas claras antes da reversão   |  Detetar os níveis Fibo que o preço irá testar Indicador não repintável e não atrasado - ideal para trading manual e automatizado - adequado para todos os activos e todas as unidades de tempo Oferta por tiempo limitado >>   50% OFF Após a compra,   por favor contacte-me neste canal  para obter as definições recomendadas Versão   MT5 :
TakePropips Donchian Trend Pro
Eric John Pajarillaga Aldana
4.82 (17)
TakePropips Donchian Trend Pro   (MT4) é uma ferramenta poderosa e eficaz que detecta automaticamente a direção da tendência usando o Canal Donchian e fornece sinais de negociação de entrada e saída! Este indicador multifuncional inclui um scanner de tendências, sinais de negociação, painel estatístico, rastreador, sessões de negociação e painel de histórico de alertas. Ele foi projetado para fornecer sinais de negociação e economizar horas analisando os gráficos! Você pode baixar o manual do us
Apresentando o Indicador Zeus: Sua Ferramenta Definitiva para Romper com os Lucros no Trading. Este indicador simplifica a negociação, eliminando a necessidade de uma análise detalhada com estratégias de rompimento. Ele desenha automaticamente zonas com base nos seus intervalos de tempo predefinidos, sugere níveis de Stop Loss (SL), Take Profit (TP) e Trailing Stop. O Indicador Zeus irá notificá-lo prontamente e exibir setas de sinal quando o preço se aproximar dos pontos de entrada de compra ou
Trend Forecasting
Mohamed Hassan
5 (11)
This indicator is unstoppable when combined with our other indicator called Katana . After purchase, send us a message and you could get Katana  for FREE as a BONUS!  You can also ask to join our private group where we discuss together with other members!  MT5 version: click here There are limited copies available at $45 (3 copies left). Next price is $99. Don't miss this great deal!  The Trend Forecasting indicator is a very unique & easy tool that is able to make prediction a
FX Volume
Daniel Stein
4.6 (35)
Receba a sua atualização diária do mercado com detalhes e screenshots através do nosso Morning Briefing aqui no mql5 e no Telegram ! O Volume FX é o PRIMEIRO e ÚNICO indicador de volume que fornece uma visão REAL do sentimento do mercado do ponto de vista de um corretor. Ele fornece uma visão incrível de como os participantes do mercado institucional, como corretores, estão posicionados no mercado Forex, muito mais rápido do que os relatórios COT. Ver essas informações diretamente no seu gráfi
Shepherd Harmonic Pattern
Abdullah Alrai
4.68 (59)
Este indicador detectará padrões harmônicos desenhados no gráfico por métodos manuais e automáticos. Você pode ver o manual do usuário neste link: Adicione sua avaliação e entre em contato conosco para obtê-lo Existe uma versão gratuita para experimentar este produto no mt4. Você pode usá-lo para detectar padrões de Gartley e Nenstar: https://www.mql5.com/en/market/product/30181 Você pode comprar a versão completa do MT4 em: https://www.mql5.com/en/market/product/15212 Notas O indicador possui u
Mais do autor
This indicator is based on a classic Commodity Channel Index (CCI) indicator. Multi TimeFrame indicator MTF-CCI shows CCI data from the 4 timeframes by your choice. By default this indicator has external parameters: TF1 = 1; TimeFrame2b = true; TF2 = 5; TimeFrame3b = true; TF3 = 15; TimeFrame4b = true; TF4 = 60; InpPeriod = 13; InpPRICE = 5; You can change TF1-TF4 in the next limits: TF1 from M1 (1) to H4 (240) TF2 from M5 (5) to D1 (1440) TF3 from M15 (15) to W1 (10080) TF4 from M30 (30) to MN1
This Multi TimeFrame indicator is based on the "Fractals" classical indicator. 2 Inputs: TimeFrame1; TimeFrame2; You can put any available TimeFrame values (from M1 (Period_M1) to MN1 (Period_MN1)) equal or greater ( >= ) than the Period of the current Time Frame. The last Fractals will shown as color lines (Dots Line) of Support and Resistance for the Price moving.
This is a Multi-Time indicator which allows to display RSI and Stochastic indicators from upper timeframes on a single chart. As an example: a single chart EURUSD M5 and RSI (blue line) and Stochastic (yellow line) from H1. Red Histogram is representing Lower trend and Green Histogram is representing Upper trend.
When you put this Multi TimeFrame Parabolic SAR indicator on the chart it will automatically use Parabolic SAR from next available 3 timeframes. Green arrow will show the beginning of Up trend and Red arrow will show the beginning of Down trend. If AlertsEnabled = true, the indicator will show the Alert (message window) with a text like this: "Price going Down on ", Symbol(), " - ", Period(), " min", " price = ", Bid; If eMailEnabled = true the Indicator will send you an eMail with the same text
The zero line is characterized the Flat trend. V-shaped impulse indicates the entrance to the opposite direction. U-shaped impulse = entry orders in the same direction. If AlertsEnabled = true, the indicator will show the Alert (message window) with a text like this: "Price going Down on ", Symbol(), " - ", Period(), " min", " price = ", Bid; If eMailEnabled = true the indicator will send you an eMail with the same text an Alert message with subject: "Trinity-Impolse" (of course you have to
The indicator displays the usual Moving Average with input parameters: maPeriod_1; maMethod_1; maAppPrice_1. Then it calculates and displays MA on MA1 with input parameters: maPeriod_2; maMethod_2. Then it calculates and displays MA on MA2 with input parameters: maPeriod_3; maMethod_3. If AlertsEnabled = true the Indicator will show the Alert (message window) with a text like this: "Price going Down on ", Symbol(), " - ", Period(), " min", " price = ", Bid; If eMailEnabled = true the Indicator w
Multi TimeFrame Indicator "MTF CCI Trigger" based on the Commodity Channel Index from the upper TF (input parameter "TimeFrame") yellow line. Aqua line is representing ATR envelopes from the current TF. Green and Red arrows is triggered by CCI and represented UP and DOWN trends accordingly.
The BBImpulse indicator is based on the standard Moving Average indicator. You have MA input parameters: maPeriod - Moving Average period; maMODE - Moving Average mode (0 = MODE_SMA; 1 = MODE_EMA; 2 = MODE_SMMA; 3 = MODE_LWMA); maPRICE - Applied price (0=PRICE_CLOSE; 1=PRICE_OPEN; 2=PRICE_HIGH; 3=PRICE_LOW; 4=PRICE_MEDIAN; 5=PRICE_TYPICAL; 6=PRICE_WEIGHTED). Green Histogram is representing an UP-trend, Red Histogram is representing a Down-trend.
Multi TimeFrame indicator MTF ADX with Histogram shows ADX indicator data from the TF by your choice. You may choose a TimeFrame equal or greater than current TF. Yellow line is representing a price trend from the upper TF. Green line is representing +DI from the upper TF. Red line is representing -DI from the upper TF. Green histogram is displaying an Up-trend. Red histogram is displaying a Down-trend.
This Indicator creates 2 white lines based on Exponential Moving Averag e of High and Low prices. You can regulate how many bars will be involved in the calculation with input parameter HL_Period. Red and Blue arrows are displaying the moment to go Short and Long trades accordingly.
The most common way to interpreting the price Moving Average is to compare its dynamics to the price action. When the instrument price rises above its Moving Average, a buy signal appears, if the price falls below its moving average, what we have is a sell signal. To avoid a spontaneous entries one may use this update from Moving Average Indicator = Stepper-MA.
Envelopes technical Indicator is formed with two Moving Averages one of which is shifted upward and another one is shifted downward. Envelopes define the upper and the lower margins of the price range. Signal to sell appears when the price reaches the upper margin of the band; signal to buy appears when the price reaches the lower margin. To avoid a spontaneous entries one may use this update from Envelopes Indicator = Envelopes-Stepper.
The interpretation of the Bollinger Bands is based on the fact that the prices tend to remain in between the top and the bottom line of the bands. Abrupt changes in prices tend to happen after the band has contracted due to decrease of volatility; If prices break through the upper band, a continuation of the current trend is to be expected; If the pikes and hollows outside the band are followed by pikes and hollows inside the band, a reverse of trend may occur; The price movement that has sta
Fibonacci sequence is defined by integer sequence: 0, 1, 1, 2, 3, 5, 8, 13, 34, 55, 89, 144, ... By definition, it starts from 0 and 1, the next number is calculated as a sum of two previous numbers. Instead of the standard moving average, the indicator uses the caluclation of average price in form: Bar0 + Bar1 + Bar2 + Bar3 + Bar5 + Bar8 + Bar13 +... Input parameters:  FiboNumPeriod (15) - Fibonacci period; nAppliedPrice (0) - applied price (PRICE_CLOSE=0; PRICE_OPEN=1; PRICE_HIGH=2; PRICE_LOW
This indicator present a main Moving Average line with input parameters maPeriod_1, maMethod_1 and maAppPrice_1. The second line will be a calculation of the Moving Average data of a first line with input parameters maPeriod_2, maMethod_2. The third line will be a calculation of the Moving Average data of a second line with input parameters maPeriod_3, maMethod_3. To avoid a spontaneous entries one may use this indicator-stepper.
This indicator (as almost all others) is based on classical Moving Averages. It shows the Average Bar under the current bar colored in aqua or over the current bar colored in orange. Input Parameters: ma_Period and ma_Method. The Average Bar maybe helpful to predict where the price will move in the nearest future. Of course, this "near future" depends of the current time frame.
Buy when the market is falling and sell when the market is rising. When the market is moving down you start observing and looking for buy signals. When the market is moving up you start looking for sell signals. This indicator points to the moments to Buy (Blue arrow) and to Sell (Orange arrow). Two input parameters: barsNumber and step for optimization (depending on symbol and Time Frame).
This indicator shows: A green light in case the price goes up; A red light in case the price goes down; A yellow light in case there are a sideways trend. A sideways trend is the horizontal price movement that occurs when the forces of supply and demand are nearly equal. This typically occurs during a period of consolidation before the price continues a prior trend or reverses into a new trend
This indicator is created for M1 timeframe. It shows how many ticks has occurred during current minute and ( after the slash) the sum of points Up (aqua color) and Down (orange color). In times of a high trading activity a grow up number of ticks Up and Down will signal of a big move of the price in the near future. In times of a high trading activity a grow up number of sum of points Up and Down will signal of a big move of the price in the near future too.
Two yellow lines. This is similar to classical Envelopes but with automatic deviation. The Envelopes indicator is   a tool that attempts to identify the upper and lower bands of a trading range. Aqua line. This is a classical Commodity Channel Index added to the Envelopes on the chart, not in a separate window. The Commodity Channel Index ( CCI ) is a technical   indicator   that measures the difference between the current price and the historical average price.
Probability deals with the likelihood of an event happening.   Forex   probability indicates a possibility at a specific time. This is because the forex market is highly volatile, and predicting future events affecting it is impossible. This indicator will show a positive number above the current High or negative number under the current Low as a probability of the trend. Higher time frames usually show a higher probability, even more then 100%.
Envelopes is an excellent indicator when the market is trending. Open Long position when the ClosePrice crossed the upper Aqua band. Close Long position when the Price crossed the upper Yellow band moving down. Open Short position when the ClosePrice crossed the lower Aqua band. Close Short position when the Price crossed the lower Yellow band moving up.
Moving Average Bars is a self-explanatory indicator with one input parameter: nPeriod. When the previous Price Close is above the previous indicator Bar, the probability to go Long is very high.   When the previous Price Close is under the previous indicator Bar, the probability to go Short is very high.
This indicator is based on the same idea as https://www.mql5.com/en/market/product/2406 , but instead of Average Bars it uses series or Fibonacci sequence. When the previous Price Close is above the previous indicator Bar, the probability to go Long is very high. When the previous Price Close is under the previous indicator Bar, the probability to go Short is very high.
This indicator is based on two ideas: Correlations between 5 main currency pairs: EURUSD, GBPUSD, USDCHF, USDJPY, USDCAD; US Dollar Index = the value of the United States dollar relative to a basket of foreign currencies. The use of the indicator is the same as classical  Commodity Channel Index  (CCI) indicator. CCI is calculated with the following formula:  (Typical Price - Simple Moving Average) / (0.015 x Mean Deviation) (Typical Price - Simple Moving Average) / (0.015 x Mean Deviation)
A  tick  is a measure of the minimum upward or downward movement in the  price  of a security. A  tick  can also refer to the change in the  price  of a security from one trade to the next trade.  This indicator will show amounts of ticks when the price goes up and down. This indicator is designed for M1 time frame and shows: Sum of points when the price goes up (Green Histogram). Sum of points when the price goes down (Red Histogram). 
This indicator is a combination of 2 classical indicators MA and RVI. The Relative Vigor Index (RVI) is a momentum indicator used in technical analysis that measures the strength of a trend by comparing a security's closing price to its trading range while smoothing the results using a simple moving average   The input parameter  counted_bars  determines how many bars the indicator's lines will be visible. The input parameter MaRviPeriod  is used for MA and RVI calculation.
This indicator is a combination of 2 classical indicators: MA and Force Index. The input parameter  counted_bars  determines on how many bars the indicator lines will be visible. The input parameter  MaForcePeriod  is used for MA and Force calculation. You may go Long if the current price crossed Up the Ribbon (HISTOGRAM)  and you may go Short if the current price crossed Down the Ribbon (HISTOGRAM)
This indicator is a combination of 2 classical indicators: MA and CCI. Two moving averages form Upper and Lower bands. The input parameter  counted_bars  determines on how many bars the indicator's lines will be visible. The input parameter  barsNum  is used for MA and CCI calculation.
This indicator is using 2 classical indicators: Commodity Channel Index from the higher TF (which you may change using input parameter TimeFrame ) and Average True Range from the current TF. The Green ribbon indicates the upper trend and the Red ribbon indicates the down trend. Buy when the Yellow line crosses the Upper bound (Aqua line). Sell when the Yellow line crossover the Lower bound (Aqua line).
Filtro:
Sem comentários
Responder ao comentário
Versão 4.7 2020.05.23
A new version, compiled by the latest MetaEditor build.