Thunder Scalper
- Indicadores
- Versão: 1.0
- Ativações: 5

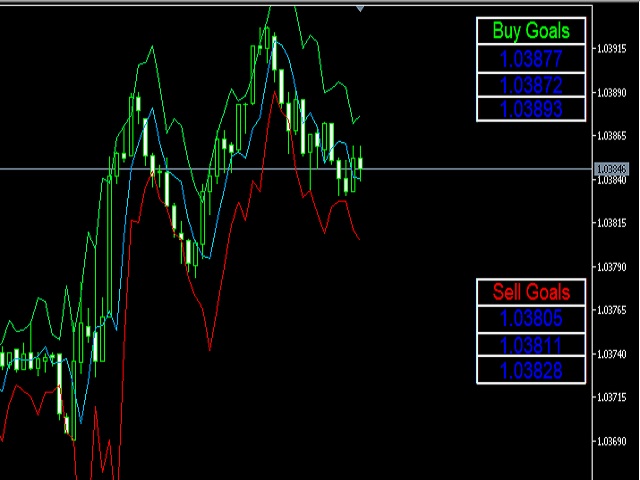
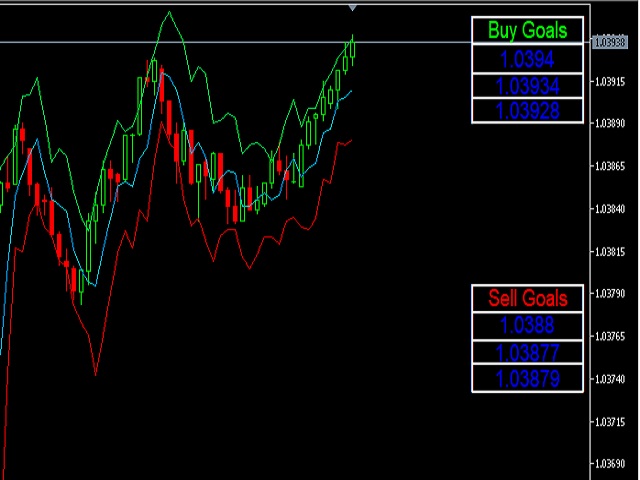
Buy and Sell Targets Indicator
You can see the buying and selling goals in the box and they are inevitably achieved.
It consists of three lines: the first green color sets buying targets, the second red color sets selling targets, and the third blue color is the average price.
Trading Method
For Buy Trade:
The entry point will be where the wavy blue line (representing the average price) is 'broken' by the ascending 'Buy' candle from beneath
Please wait until the next candle appears to enter into a Buy Trade.
For Sell Trade:
When the wavy blue line (average price) is broken from the top by the descending "Sell" Candle.
Please wait until the next candle appears to enter into a Sell Trade.
Take Profit
The 2 Boxes showing "Buy Goals" and "Sell Goals" each display TP1, TP2 and TP3 respectively.