AIS Ogival Shape Filter

Este indicador é baseado em formas de ogiva. Tais formas são usadas em aerodinâmica e tecnologia espacial. Até as balas têm uma forma ogival.
O uso de tais formulários em um indicador técnico permite alcançar um compromisso entre a sensibilidade do indicador e sua estabilidade. Isso dá possibilidades adicionais em sua aplicação.
Parâmetros do indicador:
  • iType - o tipo da forma ogiva.
  • iPeriod - período do indicador.
  • iFactor é um parâmetro adicional usado nas formas parabólica e exponencial. O valor válido é 0 - 255. Se iFactor = 0, o indicador degenera em uma média móvel simples.
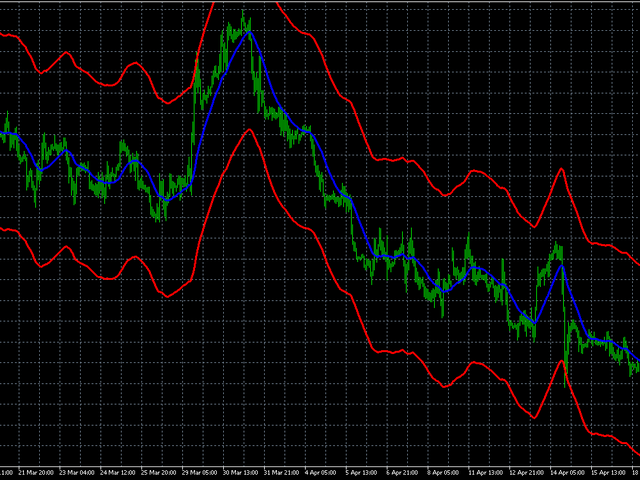
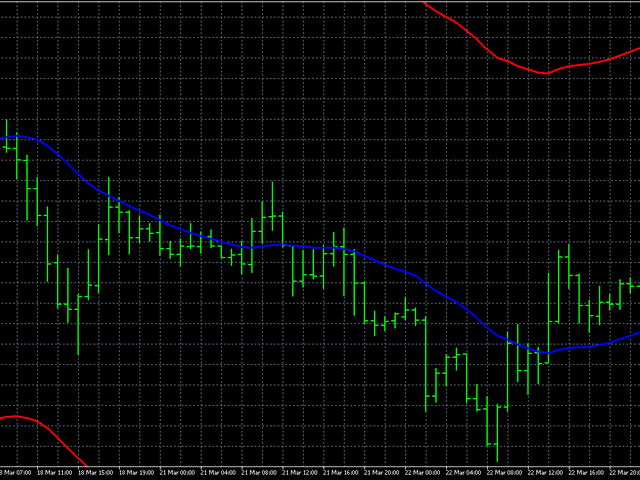
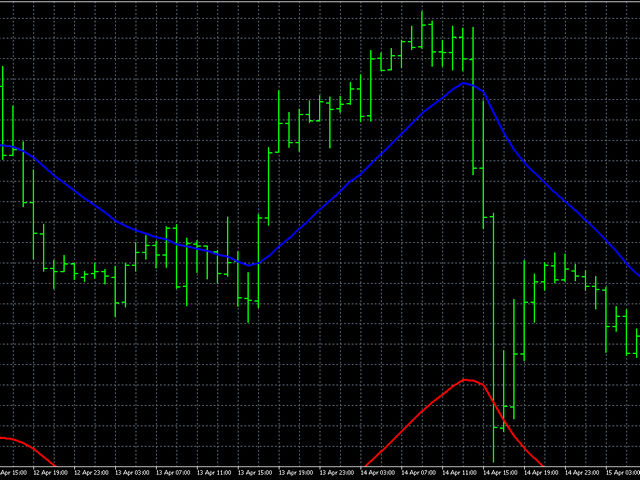
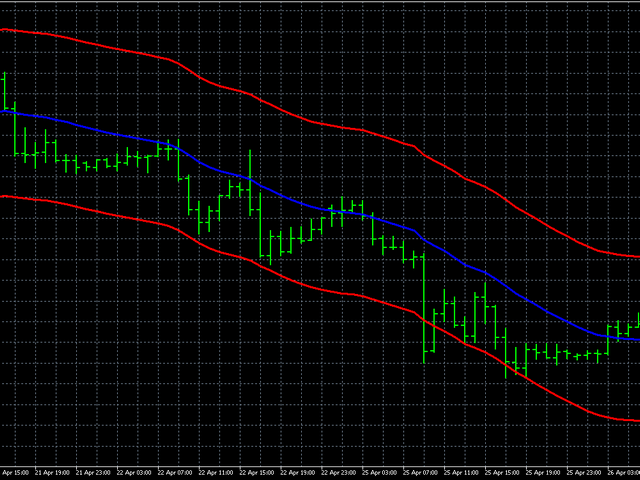
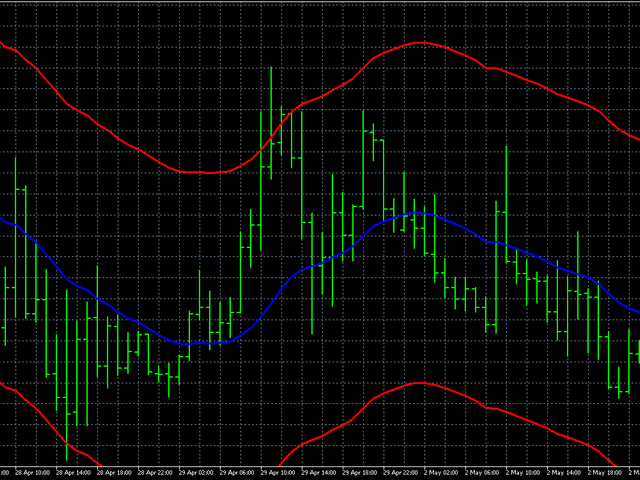
  • iChannel - um parâmetro que permite construir canais superiores e inferiores dentro dos quais o preço se move. Os valores válidos são de -128 a 127. Se o valor for positivo, o canal superior é desenhado, e se o valor for negativo, o canal inferior é desenhado.
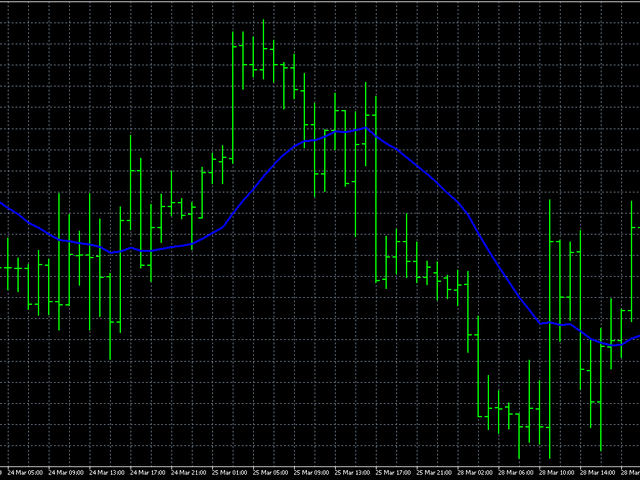
Combinando esses parâmetros, diferentes resultados podem ser alcançados. O indicador pode ser usado para rastrear tendências de movimentos de preços no mercado. Ao construir canais, você pode obter os alvos mais próximos para os quais o preço pode se mover. Os valores da fronteira do canal podem ser usados ​​como obter lucros e parar perdas. Usando o iFactor, você pode alcançar o grau desejado de suavização da série temporal financeira.
Produtos recomendados
Price Magnet — Price Density and Attraction Levels Indicator Price Magnet is a professional analytical tool designed to identify key support and resistance levels based on statistical Price Density. The indicator analyzes a specified historical period and detects price levels where the market spent the most time. These zones act as “magnets,” attracting price action or forming a structural base for potential reversals. Unlike traditional Volume Profile tools, Price Magnet focuses on price-time d
O indicador Crypto_Forex "Auto FIBO Pro" é uma ótima ferramenta auxiliar na negociação! - O indicador calcula e coloca automaticamente no gráfico os níveis de Fibonacci e as linhas de tendência locais (cor vermelha). - Os níveis de Fibonacci indicam áreas-chave onde o preço pode reverter. - Os níveis mais importantes são 23,6%, 38,2%, 50% e 61,8%. - Pode utilizá-lo para scalping de reversão ou para negociação de grelha de zona. - Existem muitas oportunidades para melhorar o seu sistema atual ut
Zig Zag 123
Stephen Reynolds
Zig Zag 123 tells us when a reversal or continuation is more likely by looking at the shift in supply and demand. When this happens a signature pattern appears known as 123 (also known ABC) will often break out in direction of higher low or lower high. Stop loss and take profit levels have been added. There is a panel that shows the overall performance of your trades for if you was to use these stop loss and take profit levels.  We get alerted if a pattern 123 appears and also if the price re
FREE
O indicador cria cotações atuais, que podem ser comparadas com as históricas e, com base nisso, fazer uma previsão do movimento dos preços. O indicador possui um campo de texto para navegação rápida até a data desejada. Opções: Símbolo - seleção do símbolo que o indicador exibirá; SymbolPeriod - seleção do período do qual o indicador coletará dados; IndicatorColor - cor do indicador; HorisontalShift - deslocamento das cotações desenhadas pelo indicador pelo número especificado de barras; I
Spread Monitor Live Real-time Spread Monitoring Tool for MT4 Version:   1.00 Last update:   15.06.2026 Author:   Aleksandr Bezverkhikh Description Spread Monitor Live   is a lightweight and efficient indicator for MetaTrader 4 that displays the current spread in real time directly on your chart. Perfect for scalpers, day traders, and anyone who needs to keep a close eye on trading conditions. The indicator shows the spread in points with clear color coding, allowing you to instantly s
FREE
Gold Venamax MT4
Sergei Linskii
3 (2)
Gold Venamax   - este é o melhor indicador técnico de ações. O algoritmo do indicador analisa o movimento do preço de um ativo e reflete a volatilidade e as zonas de entrada potenciais. Recursos do indicador: Este é um super indicador com Magic e dois blocos de setas de tendência para uma negociação confortável e lucrativa. O botão vermelho para alternar blocos é exibido no gráfico. Magic é definido nas configurações do indicador, para que você possa instalar o indicador em dois gráficos exibin
Money Flow Profile MT5 HERE   Here   our more valuable tools SMC Trend Trading   ,  Easy SMC Trading  ,  Institutional SMC Architect Volume Analysis Tools  ,  Volume flow Profile  ,  Market volume profile  , FVG with Volume  , Liquidity Heatmap Profile  ,  Volume Spread Analysis This Master Edition is engineered for clarity and speed, featuring a unique Auto-Theme Sync system that instantly beautifies your chart layout upon loading. Key Features: True Money Flow Calculation: Goes beyond stand
Quantum Falcon Signal Free is a smart visual trading indicator for MetaTrader 4 designed for Forex and Gold traders. The indicator combines: • Trend analysis • RSI momentum confirmation • MACD momentum filtering • ATR volatility filtering • Higher timeframe confirmation • Smart exit signal detection Main Features: • Smart Buy and Sell signals • Exit Buy / Exit Sell alerts • Real-time dashboard on chart • Professional candle arrows • Multi-timeframe trend confirmation • ATR market volatility filt
FREE
The indicator allows you to trade binary options. The recommended time frame is М1 and the expiration time is 1,2,3 minutes. The indicator suitable for auto and manual trading. A possible signal is specified as a arrows above/under a candle. You should wait until the candle closes! Arrows are not re-painted Trade sessions: TOKYO section (Half-end) Currency pairs: USD/JPY Working time frame: M1 Expiration time: 1,2,3 minutes. The indicator also shows good results when using the martingale strateg
FREE
The indicator analyzes the change in the minimum and maximum prices of the previous bars fixing the entrance of the big players. If the change (delta) increases, a signal is displayed on the graph in the form of an arrow. At the same time, virtual trade on history is carried out. In case of a repeat of the signal, the positions are increased (refilling). Thus the lot of positions can differ. The results of virtual trading in the form of losses / losses, profitability, drawdown and transaction li
LE Oscillator
Svyatoslav Kucher
LE Oscillator   - индикатор предназначенный для поиска локальных экстремумов, определения текущей тенденции. В расчетах индикатора используется авторская методика. С помощью индикатора можно определять места возможного разворота цены желательно в направлении тенденции, но также с достаточной точностью и против нее. Также с помощью индикатора можно определять текущую тенденцию. Индикатор подходит для любых валютных пар, но для адекватного отображения показания необходимо, чтобы было достаточно ис
Market Profile 3
Hussien Abdeltwab Hussien Ryad
3 (2)
Market Profile 3 MetaTrader 4 indicator  — is a classic Market Profile implementation that can show the price density over time, outlining the most important price levels, value area, and control value of a given trading session. This indicator can be attached to timeframes between M1 and D1 and will show the Market Profile for daily, weekly, monthly, or even intraday sessions. Lower timeframes offer higher precision. Higher timeframes are recommended for better visibility. It is also possible t
FREE
Dollar mint indicator is a special workmanship with years of experience in forex.   Dollar mint ea is a fully non repaint indicator optimised with price action data such that once it gives you a signal t . The indicator   can be used to trade anything on the mt4 with much ease. Benefits ; Fully non repaint Use in any timeframe Use in all the available tradable assets on mt4 Best to use on h4. It generates fully analysed buy and sell signals based on trend and also filters out retracements and
Volatility Ratio
Noiros Tech
4.27 (15)
YOU CAN NOW DOWNLOAD FREE VERSIONS OF OUR PAID INDICATORS . IT'S OUR WAY OF GIVING BACK TO THE COMMUNITY ! >>>    GO HERE TO DOWNLOAD The Volatility Ratio was developed by Jack D. Schwager to identify trading range and signal potential breakouts. The volatility ratio is defined as the current day's true range divided by the true range over a certain number of days N (i.e. N periods).  How to Use Volatility Ratio The use of a volatility ratio helps to identify situations where the price of a s
FREE
Alpha Trend sign has been a very popular trading tool in our company for a long time. It can verify our trading system and clearly indicate trading signals, and the signals will not drift. Main functions: Based on the market display of active areas, indicators can be used to intuitively determine whether the current market trend belongs to a trend market or a volatile market. And enter the market according to the indicator arrows, with green arrows indicating buy and red arrows indicating se
Custom Pattern Detector Indicator This indicator lets you define your own custom pattern instead of the typical candlestick patterns. Everybody already knows about common candlestick patterns like the Doji pattern. This indicator is different though. The pattern you will define is a custom pattern based on CANDLE FORMATIONS . Once the indicator knows the pattern you want it to look for, then it will go through history on the chart and find matching patterns, make them visible to you, and calcula
FREE
Axiom Points
Tatiana Savkevych
Axiom Point — Precision Structural Breakout Indicator Axiom Point is a high-performance analytical indicator designed to identify high-probability reversal zones using price-action behaviour and adaptive balance filtering. The indicator applies a multi-layer analytical model to detect moments when price transitions beyond its normal equilibrium area, indicating a potential shift in market momentum. Unlike conventional trend-following tools, Axiom Point focuses on so-called points of no return —
VR Cub
Vladimir Pastushak
VR Cub é um indicador para obter pontos de entrada de alta qualidade. O indicador foi desenvolvido para facilitar cálculos matemáticos e simplificar a busca por pontos de entrada em uma posição. A estratégia de negociação para a qual o indicador foi escrito tem provado a sua eficácia há muitos anos. A simplicidade da estratégia de negociação é a sua grande vantagem, o que permite que até mesmo os comerciantes novatos negociem com sucesso com ela. VR Cub calcula os pontos de abertura de posição e
VSA Histogram
Richard Bystricky
VSA - P (Volume Spread Analysis) Period-Based Histogram is a tool that visually represents market volume dynamics using Volume Spread Analysis principles, with a focus on highlighting key volume changes over specific time periods. The histogram captures changes in volume and price spread relationships in real-time, enabling traders to detect early signals of accumulation, distribution, and shifts in buying or selling pressure. Indicator is non repainting and working with real-time on tick data.
The indicator analyzes the change in the minimum and maximum prices of the previous bars fixing the entrance of the big players. If the change (delta) increases, a signal is displayed on the graph in the form of an arrow. At the same time, virtual trade on history is carried out. In the free version, virtual trade is performed without refills in case of a repeat of the signal. The results of virtual trading in the form of losses / losses, profitability, drawdown and transaction lines are display
FREE
Rira Renko
Vitor Palmeira Abbehusen
RENKO on Time Chart This indicator is an enhanced Renko, so you can watch the Renko bricks on the chart to understand price movement more clearly the other improvement is automated box size according to ATR (Average True Range) period you can set the ATR number as you want and the box size of Renko changes automatically based on price movement Inputs Mode: Box size is the input to specify the size of the Renko box you want to print on the chart. This input lets you choose the fixed box siz
Forex Market Profile and Vwap
Lorentzos Roussos
4.86 (7)
Perfil do mercado Forex (FMP para breve) O que isso não é: O FMP não é a exibição TPO clássica codificada por letras, não exibe o cálculo geral do perfil de dados do gráfico e não segmenta o gráfico em períodos e os calcula. O que faz : Mais importante ainda, o indicador FMP processará dados que residem entre a borda esquerda do espectro definido pelo usuário e a borda direita do espectro definido pelo usuário. O usuário pode definir o espectro apenas puxando cada extremidade do indicador co
FREE
Magic Balance
Daniil Evstratenko
The indicator shows which trading pairs, strategies, robots and signals that you use are profitable and which are not. The statistic of trades and balance graph are displayed in the account currency and pips - to switch simply click on the graph. button "$"(top left) - minimize/expand and move the indicator panel button ">"(bottom right) - stretching and resetting to the original size Statistic of trades 1 line - account balance, current profit and lot of open trades; 2 line - the number of all
The indicator detects and displays Shark harmonic pattern (see the screenshot). The pattern is plotted by the extreme values of the ZigZag indicator (included in the resources, no need to install). After detecting the pattern, the indicator notifies of that by a pop-up window, a mobile notification and an email. The indicator highlights the process of the pattern formation and not just the complete pattern. In the former case, it is displayed in the contour triangles. After the pattern is comple
Trend Ray
Andriy Sydoruk
The indicator shows the potential trend direction by cyclical-wave dependence. Thus, all the rays of the intersection will be optimal rays, in the direction of which the price is expected to move, taking into account the indicator period. Rays can be used as a direction for potential market movement. But we must not forget that the approach must be comprehensive, the indicator signals require additional information to enter the market.
Blahtech Market Profile
Blahtech Limited
4.53 (15)
Was: $249  Now: $99   Market Profile defines a number of day types that can help the trader to determine market behaviour. A key feature is the Value Area, representing the range of price action where 70% of trading took place. Understanding the Value Area can give traders valuable insight into market direction and establish the higher odds trade. It is an excellent addition to any system you may be using. Blahtech Limited presents their Market Profile indicator for the MetaTrader community. Ins
Spread and Close MT4
Alexander Denisovich Jegorov
Spread & Candle Close Timer Indicator for MT4  Optimize your trading with this lightweight and efficient indicator, designed to display the real-time spread and candle close countdown directly on your MT4 chart. Features: Live Spread Monitoring – Instantly see market conditions. Candle Close Timer – Stay prepared for the next price movement. Simple & Non-Intrusive Design – No unnecessary settings, just clear and accurate data. Ideal for scalpers, day traders, and those who need real-time exec
AP VWAP Bands Pro (MT4) Volume-weighted average price with ±σ bands for clear intraday bias, mean-reversion zones, and dynamic support/resistance. Works on crypto (incl. BTC), FX, indices, and metals. Uses tick-volume when real volume isn’t available. What it shows VWAP line (volume-weighted mean price). Two envelopes around VWAP (default ±1σ and ±2σ) to highlight balance vs. extension. Reset modes: Day, Week, or Anchor Time (HH:MM) to start VWAP where you need it (e.g., exchange open). Why
FREE
Rainbow MT4
Jamal El Alama
Rainbow MT4 is a technical indicator based on Moving average with period 34 and very easy to use. When price crosses above MA and MA changes color to green, it’s a signal to buy. When price crosses below MA and MA changes color to red, it’s a signal to sell. The Expert advisor ( Rainbow EA MT4) based on Rainbow MT4 indicator, as you can see in the short video below is now available here .
FREE
Hedge Trading King
Stefano Frisetti
5 (1)
Hedge Trading Monitor is my indicator that instantly monitors the difference or ratio between two assets useful for hedge trading. How to use it + Download the indicator + Apply the indicator on an open chart + You can change the assets using the settings. Distribution + It is distributed only on MQL5.vom + Free license (FREE) - Contact me privately on MQL5.com: send me a message
FREE
Os compradores deste produto também adquirem
Neuro Poseidon MT4
Daria Rezueva
4.84 (43)
Neuro Poseidon is a new indicator by Daria Rezueva. It combines precise trading signals with adaptive TP/SL levels - creating best possible trades as a result! Message me and get  Neuro Poseidon Assistant  as a gift to automize your trading process! What makes it stand out? 1. Proven profitability on all assets and timeframes 2. Only confirmed BUY and SELL signals present on the chart 3. Adaptive TP & SL levels generated by the software for each trade 4. Easy to understand - suitable for all
Gann Made Easy
Oleg Rodin
4.84 (167)
Gann Made Easy é um sistema de negociação Forex profissional e fácil de usar, baseado nos melhores princípios de negociação usando a teoria do sr. W. D. Gann. O indicador fornece sinais precisos de COMPRA e VENDA, incluindo níveis de Stop Loss e Take Profit. Você pode negociar mesmo em movimento usando notificações PUSH. Entre em contato comigo após a compra para receber instruções de negociação e ótimos indicadores extras gratuitamente! Provavelmente você já ouviu muitas vezes sobre os métodos
Prop Firm Sniper
Mohamed Hassan
5 (1)
Prop Firm Sniper MT4  is a professional market structure indicator that automatically identifies high-probability BUY and SELL opportunities using BOS and CHoCH analysis. Recommended Timeframes: For backtesting, use the indicator on   M5 or M15   for Gold (XAUUSD), and   M15 or H1   for more volatile Forex pairs such as   GBPUSD, USDJPY, EURGBP , and similar markets. CONTACT ME AFTER PURCHASE TO CLAIM YOUR FREE BONUSES! Prop Firm Sniper  is a professional market structure indicator designed t
Super Signal – Skyblade Edition Sistema profissional de sinais de tendência sem repintar / sem atraso com taxa de acerto excepcional | Para MT4 / MT5 Funciona melhor em timeframes mais curtos, como 1 minuto, 5 minutos e 15 minutos. Principais características: Super Signal – Skyblade Edition é um sistema inteligente de sinais desenvolvido especificamente para operações com tendência. Utiliza uma lógica de filtragem em múltiplas camadas para detectar apenas movimentos direcionais fortes sustenta
Este produto foi atualizado para o mercado de 2026 e otimizado para as versões mais recentes do MT5. AVISO DE ATUALIZAÇÃO DE PREÇO: Smart Trend Trading System está atualmente disponível por $99 . O preço aumentará para $199 após as próximas 30 compras . OFERTA ESPECIAL: Após comprar o Smart Trend Trading System, envie-me uma mensagem privada para receber o Smart Universal EA GRÁTIS e transformar seus sinais do Smart Trend em operações automatizadas. Smart Trend Trading System é um sistema de tr
Indicador Miraculous – Ferramenta 100% Não Repintável para Forex e Opções Binárias Baseada no Quadrado de Nove de Gann Este vídeo apresenta o Indicador Miraculous , uma ferramenta de negociação altamente precisa e poderosa, desenvolvida especificamente para traders de Forex e Opções Binárias . O que torna este indicador único é a sua base no lendário Quadrado de Nove de Gann e na Lei da Vibração de Gann , tornando-o uma das ferramentas de previsão mais precisas disponíveis na negociação moderna.
System Trend Pro
Aleksandr Makarov
5 (3)
System Trend Pro - This is the best trend trading indicator!!! The indicator no repaint!!!  The indicator has   MTF   mode, which adds confidence to trading on the trend (   no repaint   ). How to trade? Everything is very simple, we wait for the first signal (big arrow), then wait for the second signal (small arrow) and enter the market in the direction of the arrow. (See screens 1 and 2.) Exit on the opposite signal or take 20-30 pips, close half of it, and keep the rest until the opposite
Neo Wave PRO
Nikolay Raykov
5 (1)
Price & Time Market Structure Indicator A professional market structure tool that analyzes waves through both price and time — not price alone. Main Description NeoWave PRO is a professional market structure indicator for MetaTrader 4 designed for traders who want to move beyond traditional one-dimensional wave tools such as ZigZag, swing indicators, and basic high/low systems. Most wave indicators analyze only one thing: Price. But a real market wave is not only a price movement. A true wave de
Advanced Supply Demand
Bernhard Schweigert
4.91 (300)
Atualmente com 30% de desconto! A melhor solução para qualquer Trader Novato ou especialista! Este indicador é uma ferramenta de negociação exclusiva, de alta qualidade e acessível porque incorporamos uma série de recursos proprietários e uma nova fórmula. Com esta atualização, você poderá mostrar fusos horários duplos. Você não só será capaz de mostrar um TF mais alto, mas também mostrar ambos, o TF do gráfico, MAIS o TF mais alto: MOSTRANDO ZONAS ANINHADAS. Todos os traders de Oferta e Demanda
M1 Sniper
Oleg Rodin
5 (24)
O M1 SNIPER é um sistema indicador de negociação fácil de usar. É um indicador de seta projetado para o período M1. O indicador pode ser usado como um sistema independente para scalping no período M1 e pode ser usado como parte do seu sistema de negociação existente. Embora este sistema de negociação tenha sido projetado especificamente para negociação no M1, ele também pode ser usado em outros períodos. Originalmente, desenvolvi este método para negociar XAUUSD e BTCUSD. Mas considero-o útil ta
Owl smart levels
Sergey Ermolov
4.26 (38)
Ao operar a favor da tendência, a principal dificuldade não é encontrar um nível, mas entender onde uma entrada é realmente válida. O preço frequentemente reage aos níveis, mas não consegue dar continuidade — o que leva a entradas falsas ou movimentos perdidos. Owl Smart Levels não apenas mostra níveis , mas zonas formadas com base na estrutura do mercado e nos pullbacks. Isso permite avaliar os pontos de entrada de forma diferente e evitar parte dos sinais falsos. O que está incluído no sistem
PZ Trend Trading
PZ TRADING SLU
4.8 (5)
O Trend Trading é um indicador projetado para lucrar o máximo possível com as tendências que ocorrem no mercado, cronometrando retrocessos e rupturas. Ele encontra oportunidades de negociação analisando o que o preço está fazendo durante as tendências estabelecidas. [ Guia de instalação | Guia de atualização | Solução de problemas | FAQ | Todos os produtos ] Negocie mercados financeiros com confiança e eficiência Lucre com as tendências estabelecidas sem ser chicoteado Reconhecer retrocessos
ORB Seeker
Marcela Goncalves De Oliveira
Preço especial de lançamento! Apenas 79 dólares! O preço aumentará após 10 vendas, preço final de $199. Após a compra, entre em contato comigo para receber um EA bônus GRATUITO que pode operar com sinais de rompimento de forma totalmente automatizada e com arquivos de configuração otimizados. Faça sessões de tratamento eficazes com confiança! O ORB Seeker é um indicador profissional de Ruptura da Faixa de Abertura (ORB, na sigla em inglês) desenvolvido para traders que buscam precisão, simplic
Scientific trade
Aleksey Ivanov
5 (1)
An extremely convenient indicator that truly makes the process of making money on the exchange easy. It is based on the scientifically rigorous theory of the market developed by the author, the beginning of which is presented here .                The full algorithm of this indicator operation is presented in the article .               The indicator calculates the most probable price movement trajectory and displays it on the chart. Based on the predicted price movement trajectory
Cycle Sniper
Elmira Memish
4.39 (36)
Please contact us after your purchase and we will send you the complimentary indicators to complete the system Cycle Sniper is not a holy grail but when you use it in a system which is explained in the videos, you will feel the difference. If you are not willing to focus on the charts designed with Cycle Sniper and other free tools we provide, we recommend not buying this indicator. We recommend watching the videos about the indiactor and system before purchasing. Videos, settings  and descri
Nota do Desenvolvedor:   Após a compra, entre em contato comigo para receber o mais recente   arquivo de configuração recomendado (Set File) , dicas de trading e um convite para o nosso   Grupo VIP de Suporte , onde você pode se conectar com outros usuários do M1 Quantum. Versão MT5 disponível : Visitar MT5 M1 Quantum é um sistema profissional de negociação para M1 que fornece sinais de trading rápidos e precisos, com Stop Loss, Take Profit e gerenciamento inteligente de capital integrados. M1
Market Structure Patterns MT4
Samuel Manoel De Souza
5 (18)
Market Structure Patterns   é um indicador baseado em   smart money concepts   que apresenta elementos de   SMC/ICT   capazes de elevar suas decisões de negociação a um novo patamar. Aproveite os   alertas ,   notificações   push   e   mensagens  por  e-mail   para ser informado sobre quando um elemento se forma no gráfico, o preço cruza um nível e/ou entra em uma região delimitada por uma retângulo. Desenvolvedores podem acessar valores dos elementos do indicador por meio de   variáveis globais
Scalping Lines System -  é um sistema de scalping concebido especificamente para negociar o ativo Ouro (XAUUSD) em timeframes de M1 a H1. Combina indicadores de tendência, volatilidade e análise de mercado de sobrecompra/sobrevenda, reunidos num único oscilador para identificar sinais de curto prazo. Os principais parâmetros internos das linhas de sinal estão pré-configurados. Alguns parâmetros permanecem para ajuste manual: "Duração da Onda de Tendência", que regula a duração de uma série de
Actualmente 30% OFF ! A melhor solução para qualquer novato ou comerciante especializado! Este software de painel de instrumentos está a funcionar em 28 pares de moedas. É baseado em 2 dos nossos principais indicadores (Advanced Currency Strength 28 e Advanced Currency Impulse). Dá uma grande visão geral de todo o mercado Forex. Mostra valores avançados de força da moeda, velocidade de movimento da moeda e sinais para 28 pares de divisas em todos os (9) períodos de tempo. Imagine como a sua n
Friends, we present to your attention our new Forex Gump Laser indicator. Since there are no designers in our team, but mainly mathematicians, financiers, programmers and traders, we did not make any special changes in the indicator design. In appearance, it resembles the usual Forex Gump. On the other hand, Forex Gump has become not just the name of an indicator, it is a brand. And we try to preserve the corporate identity in all its varieties. The whole essence of the indicator in its operatio
Scalper Inside PRO
Alexey Minkov
4.68 (69)
Scalper Inside PRO Scalper Inside PRO is an intraday trend and scalping indicator that uses exclusive built-in algorithms to evaluate market direction and key target levels. The indicator automatically calculates entry and exit points and several profit target levels, and it shows detailed performance statistics, so you can see how different instruments and strategies behaved on historical data. This helps you select instruments that fit current market conditions. You can also connect your own a
Atomic Analyst
Issam Kassas
5 (8)
Este produto foi atualizado para o mercado de 2026 e otimizado para as versões mais recentes do MT5. AVISO DE ATUALIZAÇÃO DE PREÇO: Atomic Analyst está atualmente disponível por $99 . O preço aumentará para $199 após as próximas 30 compras . OFERTA ESPECIAL: Após comprar o Atomic Analyst, envie-me uma mensagem privada para receber o Smart Universal EA GRÁTIS e transformar seus sinais do Atomic Analyst em operações automatizadas. Atomic Analyst é um indicador de trading de Price Action sem repa
Easy Breakout
Mohamed Hassan
4.71 (14)
After your purchase, feel free to contact me for more details on how to receive a bonus indicator called VFI, which pairs perfectly with Easy Breakout for enhanced confluence!    Easy Breakout is a powerful price action trading system built on one of the most popular and widely trusted strategies among traders: the Breakout strategy ! This indicator delivers crystal-clear Buy and Sell signals based on breakouts from key support and resistance zones. Unlike typical breakout indicators, it levera
CRT Candle Range Theory HTF MT4.   Ultimate CRT Indicator: Advanced ICT Concepts and Malaysian SnR Trading System Master the Market Maker's Footprints with the Most Advanced Candle Range Theory Indicator Discounted   Price   $50  !!     Secure your lifetime access   now   before it switches to   subscription-only ! Unlock the true power of  Smart Money Concepts (SMC)  and trade precisely like the institutions with the  Ultimate CRT Indicator . Built exclusively for serious traders, this indicat
Day Trader Master é um sistema de negociação completo para day traders. O sistema é composto por dois indicadores. Um indicador é um sinal de seta para comprar e vender. É o indicador de seta que você obtém. Eu fornecerei o segundo indicador gratuitamente. O segundo indicador é um indicador de tendência especialmente projetado para ser usado em conjunto com essas setas. OS INDICADORES NÃO SE REPETEM E NÃO SE ATRASAM! A utilização deste sistema é muito simples. Você só precisa seguir os sinais de
BTMM State Engine Pro is a MetaTrader 4 indicator for traders who use the Beat The Market Maker approach: Asian session context, kill zone timing, level progression, peak formation detection, and a multi-pair scanner from a single chart. It combines cycle state logic with a built-in scanner dashboard so you do not need the same tool on many charts at once. What it does Draws the Asian session range; session times can follow broker server offset or be set in inputs. Tracks level progression (L
Dynamic Forex28 Navigator
Bernhard Schweigert
4.43 (7)
Dynamic Forex28 Navigator - A ferramenta de negociação Forex de última geração. ATUALMENTE 49% DE DESCONTO. Dynamic Forex28 Navigator é a evolução dos nossos indicadores populares de longa data, combinando o poder de três em um: Indicador Advanced Currency Strength28 (695 avaliações) + Advanced Currency IMPULSE com ALERTA (520 avaliações) + Sinais CS28 Combo (Bônus). Detalhes sobre o indicador https://www.mql5.com/en/blogs/post/758844 O que o Next-Generation Strength Indicator oferece?  Tudo
Channel Trend Bands – A Comprehensive Indicator for Market Analysis MetaTrader 5 Version Simple to Use, Effective in Application User-Friendly and Suitable for All Traders This indicator stands out due to its straightforward functionality. Whether you're a beginner exploring the market or an experienced trader refining your strategy, this tool offers valuable insights. Using a Triangular Moving Average (TMA) with additional ATR-based bands , it provides structured market data to support well-i
O sistema PRO Renko é um sistema de negociação altamente preciso especialmente concebido para a negociação de gráficos RENKO. Trata-se de um sistema universal que pode ser aplicado a vários instrumentos de negociação. O sistema neutraliza eficazmente o chamado ruído de mercado, dando-lhe acesso a sinais de inversão precisos. O indicador é muito fácil de usar e tem apenas um parâmetro responsável pela geração de sinal. Você pode facilmente adaptar a ferramenta a qualquer instrumento de negocia
O Apollo BuySell Predictor é um sistema de negociação profissional que inclui vários módulos de negociação. Ele fornece ao trader zonas de rompimento exclusivas, níveis de suporte e resistência baseados em fibonacci, linha de tendência de pivô, sinais de volume de recuo e outros recursos úteis que qualquer trader precisa diariamente. O sistema funcionará com qualquer par. Os prazos recomendados são M30, H1, H4. Embora o indicador também possa funcionar com outros prazos, exceto os prazos superio
Mais do autor
MinDeposit MT5
Aleksej Poljakov
3 (1)
The script analyzes the history of quotes and gives recommendations on the minimum deposit. The calculations take into account the variability of prices and the standard deviation. Margin requirements for the instrument are also taken into account. The result of the script is the minimum recommended deposit for trading the given currency pair.
FREE
The script allows selecting the required 'Filter level' value of the AIS-MTF MT5 indicator. Run the script on the required chart and selected timeframe. Once its operation is complete, the HPS.csv file will be created in the Files folder. Open the file. You will see three columns. The 'Filter lvl' column represents the value of the 'Filter level' for the AIS-MTF indicator. Am. dev. - degree and direction of the indicator's deviation from the price level (sorted in ascending order). Negative valu
FREE
This script allows selecting the TakeProfit and StopLoss levels. It analyzes the history data, and then calculates the probability of reaching a given price level. How the script works Suppose you have a trading strategy and you want to select the TakeProfit and StopLoss levels. Run the script and set the parameter: Number of Bars - the average position holding time in bars. Once the script operation is complete, the AIS-PPL.csv file will be created in the Files folder in the terminal data cata
FREE
O script é baseado na simulação de transações comerciais usando um gerador de números aleatórios. Isso permite obter resultados completamente diferentes, mesmo com os mesmos parâmetros de entrada. Quando você executa o script, é aberta uma caixa de diálogo na qual você pode definir os valores desejados para variáveis ​​externas. No bloco,  TradingOptions  define os parâmetros básicos necessários para simular a negociação. StartBalance  - define o tamanho inicial da balança comercial. NumberTrad
FREE
O indicador AIS Correct Averages permite definir o início de um movimento de tendência no mercado. Outra qualidade importante do indicador é um sinal claro do fim da tendência. O indicador não é redesenhado ou recalculado. Valores exibidos h_AE - limite superior do canal AE l_AE - limite inferior do canal AE h_EC - Valor previsto alto para a barra atual l_EC - Valor previsto baixo para a barra atual Sinais ao trabalhar com o indicador O sinal principal é a interseção dos canais AE e EC. U
O indicador de média móvel ponderada AIS calcula uma média móvel ponderada e permite determinar o início de um movimento de mercado de tendência. Os coeficientes de peso são calculados levando em consideração as características específicas de cada barra. Isso permite que você filtre os movimentos aleatórios do mercado. O principal sinal que confirma o início de uma tendência é uma mudança na direção das linhas do indicador e o preço cruzando as linhas do indicador. WH (linha azul) é a média
O indicador AIS Advanced Grade Feasibility foi projetado para prever os níveis que o preço pode atingir no futuro. Seu trabalho é analisar as últimas três barras e construir uma previsão com base nisso. O indicador pode ser usado em qualquer período de tempo e em qualquer par de moedas. Com a ajuda de configurações, você pode obter a qualidade desejada da previsão. Profundidade da previsão - define a profundidade de previsão desejada em barras. Este parâmetro é recomendado para ser selecionado
The indicator is designed to measure the price volatility. This allows determining the moments for opening or closing trade positions more accurately. High intensity of the market indicates the instability of its movement, but allows for better results. And, conversely, low intensity of the market indicates the stability of its movement. Parameters Bars to process - the number of bars to measure the price movements. A low value of this parameter allows determining the moments of rapid price mov
This indicator uses the Fibonacci p-numbers to smooth a price series. This allows combining the advantages of the simple and exponential moving averages. The smoothing coefficients depend on the level of the p-number, which is set in the indicator parameters. The higher the level, the greater the influence of the simple moving average and the less significant the exponential moving average. Parameters Fibonacci Numbers Order - order of the Fibonacci p-number, specified by trader. Valid values a
MinDeposit
Aleksej Poljakov
5 (1)
The script analyzes the history of quotes and gives recommendations on the minimum deposit. The calculations take into account the variability of prices and the standard deviation. Margin requirements for the instrument are also taken into account. The result of the script is the minimum recommended deposit for trading the given currency pair.
FREE
The indicator is based on the analysis of interaction of two filters. The first filter is the popular Moving Average. It helps to identify linear price movements and to smooth minor price fluctuations. The second filter is the Sliding Median. It is a non-linear filter. It allows to filter out noise and single spikes in the price movement. A predictive filter implemented in this indicator is based on the difference between these filters. The indicator is trained during operation and is therefore
This indicator studies the price action as a combination of micro-trends. All micro-trends are analyzed and averaged. Price movement is filtered based on this averaging. IP_High and IP_Low (blue and red dashed lines) show the instantaneous price movement. They display the forecast only for the current price values, taking into account only the number of bars defined by the 'Filter level' parameter. SP_High and SP_Low (blue and red solid lines) smooth the price movements with respect to history.
The script allows selecting the required 'Filter level' value of the AIS-MTF indicator. Run the script on the required chart and selected timeframe. Once its operation is complete, the HPS.csv file will be created in the Files folder. Open the file. You will see three columns. The 'Filter lvl' column represents the value of the 'Filter level' for the AIS-MTF indicator. Am. dev. - degree and direction of the indicator's deviation from the price level (sorted in ascending order). Negative values i
FREE
Este indicador implementa um processo de suavização linear simples. Uma das desvantagens da suavização exponencial é o rápido decaimento do sinal. Isso torna impossível rastrear totalmente as tendências de longo prazo na faixa de preço. A suavização linear permite ajustar com mais precisão e precisão a filtragem de sinal. O indicador é configurado selecionando os parâmetros: LP - este parâmetro permite selecionar o período de suavização. Quanto maior o seu valor, mais tendências de longo pra
This script allows selecting the TakeProfit and StopLoss levels. It analyzes the history data, and then calculates the probability of reaching a given price level. How the script works Suppose you have a trading strategy and you want to select the TakeProfit and StopLoss levels. Run the script and set the parameter: Number of Bars - the average position holding time in bars. Once the script operation is complete, the AIS-PPL.csv file will be created in the Files folder in the terminal data cata
FREE
Este indicador é um filtro híbrido sequencial baseado em uma combinação de propriedades médias e médias móveis. Usar a mediana permite filtrar outliers anormais e impulsos aleatórios nos valores da série de preços. Ao mesmo tempo, o filtro mediano não atua na tendência do movimento dos preços, deixando-o inalterado. Como o filtro mediano não é linear, a média usando uma média móvel simples é usada para suavizar seus valores. Essa abordagem nos permite identificar com mais precisão não apenas a
Este indicador é uma combinação de dois filtros Lanczos modificados. O primeiro filtro serve para extrapolar o preço. Com base em valores anteriores, ele prevê um possível movimento de preços dentro da barra atual. Isto é, mostra qual seria o preço se as tendências passadas permanecessem inalteradas. O segundo filtro para suavizar e calcular a média de preços dentro da janela, determinado pelo nível do filtro. Graças à seleção de pesos, este filtro responde mais ativamente ao componente periódic
O script é baseado na simulação de transações comerciais usando um gerador de números aleatórios. Isso permite obter resultados completamente diferentes, mesmo com os mesmos parâmetros de entrada. Quando você executa o script, é aberta uma caixa de diálogo na qual você pode definir os valores desejados para variáveis ​​externas. No bloco, TradingOptions define os parâmetros básicos necessários para simular a negociação. StartBalance - define o tamanho inicial da balança comercial. NumberTrade -
FREE
Este script é projetado para que o trader possa determinar a duração média das transações comerciais, na qual a proporção de possíveis lucros e perdas será ótima. Primeiro, vamos examinar a abordagem geral para determinar a duração ótima das transações comerciais. Nós introduzimos as seguintes variáveis: R - o resultado da transação; T - o tempo durante o qual a transação foi aberta; W - o tempo entre o fechamento da transação anterior e a abertura da próxima. Cada comerciante se esforça para ob
FREE
Vejamos a natureza das mudanças de preço no mercado Forex, não prestando atenção às razões pelas quais essas mudanças ocorrem. Essa abordagem nos permitirá identificar os principais fatores que afetam o movimento dos preços. Por exemplo, vamos considerar os preços de abertura das barras no par de moedas EUR-USD e no período de tempo H1. Por esses preços, construímos o diagrama de Lameray (Figura 1). Neste diagrama, pode-se ver que o movimento dos preços ocorre basicamente de acordo com uma equaç
Escolher os níveis de StopLoss e TakeProfit pode ter um impacto muito forte no desempenho geral da negociação. Além dos parâmetros óbvios de uma transação comercial - o tamanho de uma possível vitória ou perda provável - os níveis de StopLoss e TakeProfit também afetam a duração esperada da transação e a rentabilidade da negociação em geral. Se você já determinou a duração ideal da transação usando o script “ AIS-ODT ”, poderá começar a determinar os parâmetros associados aos níveis StopLoss e T
FREE
Este indicador é mais informativo. Seu trabalho é baseado na suposição de que o movimento de preços no mercado pode ser escrito como o barulho de uma cor que depende dos valores dos preços dos parâmetros de distribuição. Isso torna possível analisar a variação dos preços dos diferentes partidos, e considerando o movimento de preços como o som de uma determinada cor, você pode obter informações sobre a situação atual no mercado e fazer uma previsão sobre o comportamento dos preços. Na análise do
Apesar de algumas desvantagens do indicador “ AIS Color Noise Filter ”, a ideia de usá-lo para suavizar a série de preços e os preços previstos parece bastante atraente. Isso se deve a vários motivos: em primeiro lugar, tendo em conta vários componentes de ruído permite construir uma previsão sobre fatores independentes uns dos outros, o que pode melhorar a qualidade da previsão; em segundo lugar, as características de ruído da série de preços se comportam de maneira bastante estável ao longo d
Muitas vezes, no estudo das séries financeiras, aplica-se a suavização. Usando suavização, você pode remover componentes de alta freqüência - acredita-se que eles são causados ​​por fatores aleatórios e, portanto, irrelevantes. A suavização sempre inclui alguma forma de calcular a média dos dados, na qual alterações aleatórias na série temporal se absorvem mutuamente. Na maioria das vezes, para esse propósito, métodos de média móvel simples ou ponderados são usados, assim como a suavização expo
Para isolar componentes de longo prazo e não aleatórios, é necessário saber não apenas quanto o preço mudou, mas também como essas mudanças ocorreram. Em outras palavras, estamos interessados ​​não apenas nos valores dos níveis de preços, mas também na ordem em que esses níveis se substituem uns aos outros. Por meio dessa abordagem, é possível encontrar fatores estáveis ​​e de longo prazo que influenciam (ou podem influenciar) a mudança de preço em um determinado ponto no tempo. E o conheciment
Um dos métodos poderosos de análise é a modelagem de séries financeiras usando processos Levy. A principal vantagem desses processos é que eles podem ser usados ​​para modelar um grande número de fenômenos - do mais simples ao mais complexo. É suficiente dizer que a idéia do movimento dos preços fractais no mercado é apenas um caso especial dos processos de Levy. Por outro lado, com a seleção adequada de parâmetros, qualquer processo Levy pode ser representado como uma média móvel simples. A Fi
Muitas vezes, o comerciante é confrontado com a tarefa de determinar a medida em que o preço pode mudar no futuro próximo. Para este propósito, você pode usar o tipo de distribuição Johnson SB. A principal vantagem dessa distribuição é que ela pode ser usada mesmo com uma pequena quantidade de dados acumulados. A abordagem empírica usada na determinação dos parâmetros dessa distribuição permite determinar com precisão os níveis máximo e mínimo do canal de preço. Esses valores podem ser usados ​
Este indicador permite determinar a probabilidade de o preço atingir um ou outro nível. Seu algoritmo é bastante simples e baseia-se no uso de dados estatísticos nos níveis de preços de um par de moedas específico. Graças aos dados históricos coletados, é possível determinar até que ponto o preço será alterado durante a barra atual. Apesar de sua simplicidade, este indicador pode fornecer assistência inestimável na negociação. Assim, com sua ajuda, é possível determinar os níveis TakeProfit e S
Distribuições sustentáveis ​​podem ser usadas para suavizar séries financeiras. Como uma história bastante profunda pode ser usada para calcular os parâmetros de distribuição, essa suavização, em alguns casos, pode ser ainda mais eficaz em comparação com outros métodos. A figura mostra um exemplo da distribuição dos preços de abertura do par de moedas EUR-USD no período H1 por dez anos (Figura 1). Parece fascinante, não é? A principal idéia subjacente a esse indicador é determinar os parâmetr
Ao tomar decisões comerciais, é útil confiar não apenas em dados históricos, mas também na situação atual do mercado. Para tornar mais conveniente monitorar as tendências atuais do movimento do mercado, você pode usar o indicador AIS Current Price Filter . Esse indicador leva em consideração apenas as variações de preço mais significativas em uma direção ou outra. Graças a isso, é possível prever tendências de curto prazo em um futuro próximo - não importa como a situação atual do mercado se de
Filtro:
Sem comentários
Responder ao comentário