QQE Advanced MT4
- Indicadores
-
KEENBASE SOFTWARE SOLUTIONS
 A Keenbase Trading desenvolve indicadores profissionais e Expert Advisors para MetaTrader 4 e MetaTrader 5, ajudando traders a tomar decisões de negociação mais informadas.
 - Versão: 1.0
- Ativações: 10
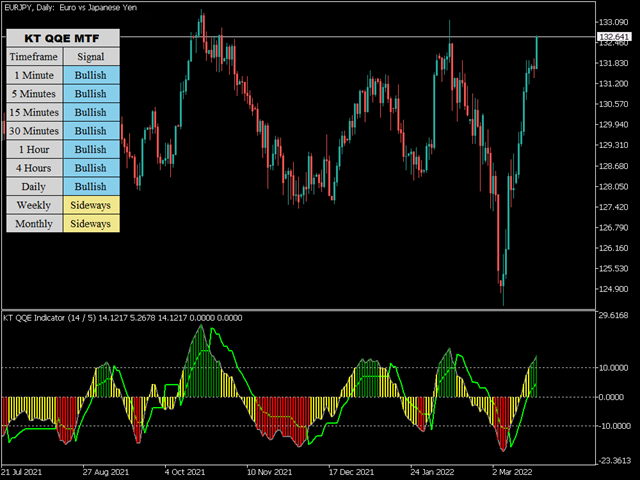
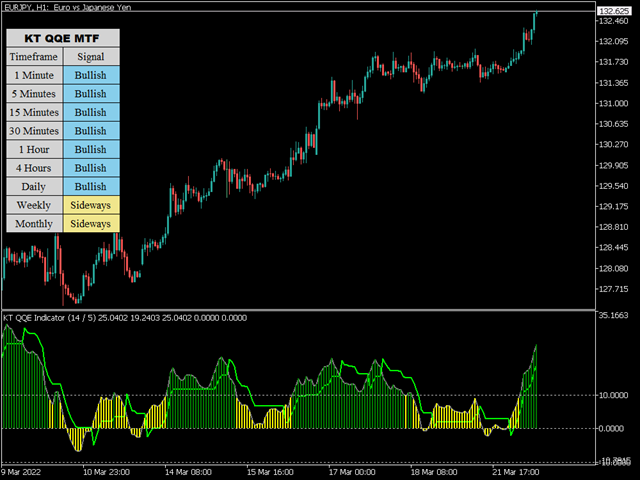
O KT QQE Advanced é uma versão modificada do oscilador QQE clássico que o apresenta de forma mais fiel por meio de um histograma colorido com Trailing Line (TL) rápido e lento.
Diferente do QQE tradicional, o KT QQE Advanced traz um histograma com níveis de sobrecompra/sobrevenda.
Aplicações
- Encontre sinais rápidos de compra/venda em todos os timeframes usando o scanner MTF.
- Determine a direção da tendência com maior precisão.
- Detecta mercado sobrecomprado/sobrevendido.
- Mostra o momentum do preço.
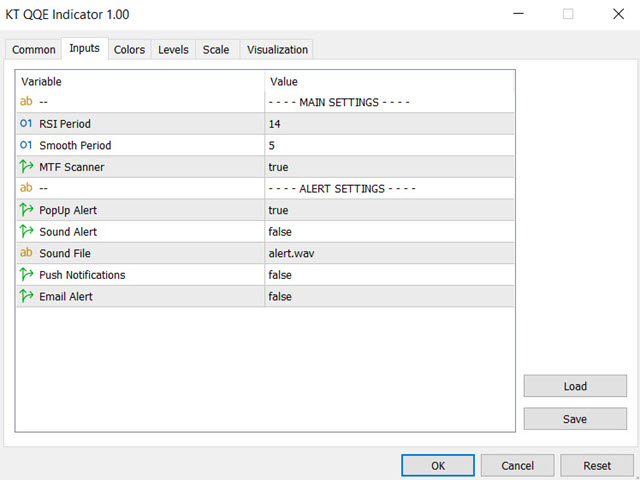
Entradas
- Período do RSI
- Período de suavização
- Scanner MTF
- Configurações de alerta
O que é exatamente o QQE?
QQE significa Quantitative Qualitative Estimation. O oscilador QQE deriva de um RSI super‑suavizado combinado com o ATR.
Em vez do RSI clássico, usa‑se o RSI de Wilder, baseado numa forma diferente de média móvel exponencial.
Suavização de Wilder = MA anterior + (1/ n períodos × (Fechamento − MA anterior))