Daily Pivots Multi indicator for MT5
- Indicadores
-
Renaud Herve Francois Candel
 ITC SOFTWARE is a technology company based in the United States since 2010.
🟠🔴 The company develops financial software and indicators for different trading platforms:
-Metatrader 4 and Metatrader 5
-TradingView
-NinjaTrader - Versão: 1.20
- Atualizado: 4 julho 2023
- Ativações: 5
Daily Pivots Multi Indicator
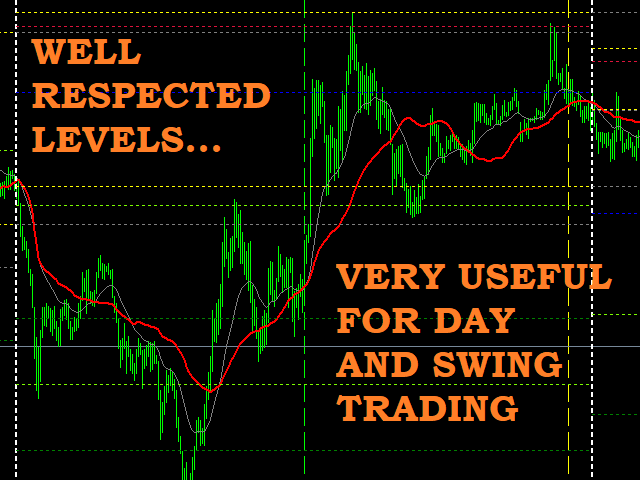
Daily Pivots Multi is an exclusive indicator to draw your pivots levels and much more.Most indicators draw daily pivots for the day. Daily Pivots Multi is able to draw levels for different days.
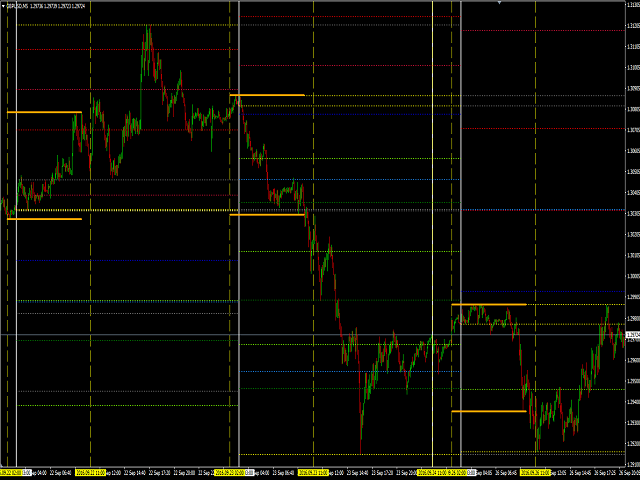
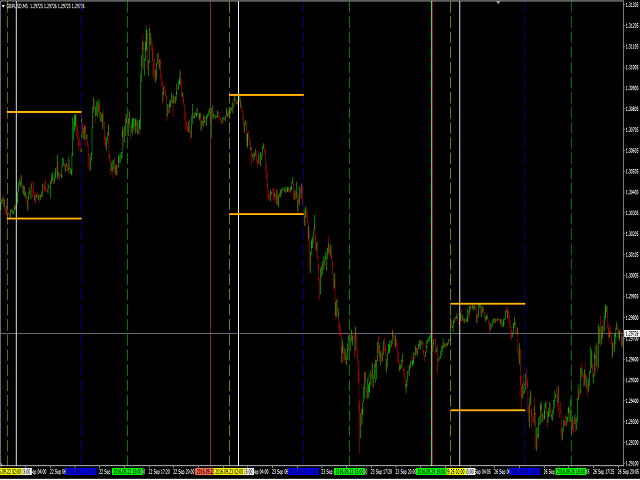
The indicator can do the calculation for unlimited number of days backward. It means that you can draw the levels for today but also for the past days.
This is very useful if you want to study a strategy with Pivots levels over a period of time.
Another problem is that each broker uses a different time zone. So with usual Pivots indicators you might have different results for pivots calculations.
With Daily Pivots Multi, you can specify the GMT time zone and the pivots calculations will not depend from broker time anymore.
Furthermore, the indicator can draw vertical lines to show opening and closing of trading sessions: Sydney, Tokyo, London, New York, as well as specific hours that might be useful for you.
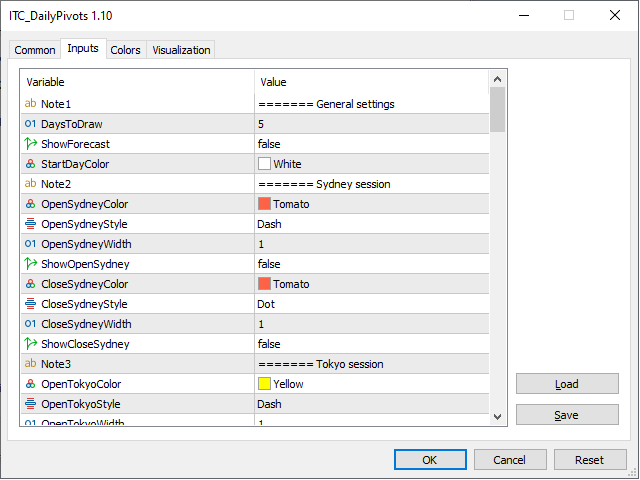
Main inputs of the indicator are:
- DaysToDraw: number of days you want to draw the pivots levels in your chart
- ShowMainPivots (True/False): draw main pivots levels
- ShowIntermediateFibo (True/False): draw intermediate pivots levels (like 0.5x(R1+R2))
- ShowATRRange (True/False): show the estimated daily ATR price range upper and lower limits
- ShowTokyoRHL (True/False): show Tokyo price range high and low
- Daily High/Low (True/False): show price high and low of the day
- Daily Open/Close (True/False): show price open and close of the day
- Open/Close Sidney: show time of opening and closing of Sydney session as a vertical bar
- Open/Close Tokyo: show time of opening and closing of Tokyo session as a vertical bar
- Open/Close London: show time of opening and closing of London session as a vertical bar
- Open/Close NY: show time of opening and closing of New York session as a vertical bar
- Formula (Standard Fibonacci/Modified Fibonacci/Camarilla): formula to be used for pivots calculation
- ServerZone: time zone of your broker servers
The indicator has more than 40 inputs so that you can customize it according to your requirements:
- select the information that you want to show in your chart
- setup the line styles you want to use
- setup colors of lines you want to use
The indicator can be used with any time frame lower than daily.
Other indicators for MT4:
We developed more than 60 indicators and utilities for Metatrader 4 and Metatrader 5.
Indicators for MT5:
All our indicators are developed both for MT4 and MT5.
List of all our indicators:
👉 You can get the complete list of our indicators visiting our profile page.