MTF MA2 for MT4 and Traders Club
- Indicadores
- Versão: 1.5
- Ativações: 5

特徴:
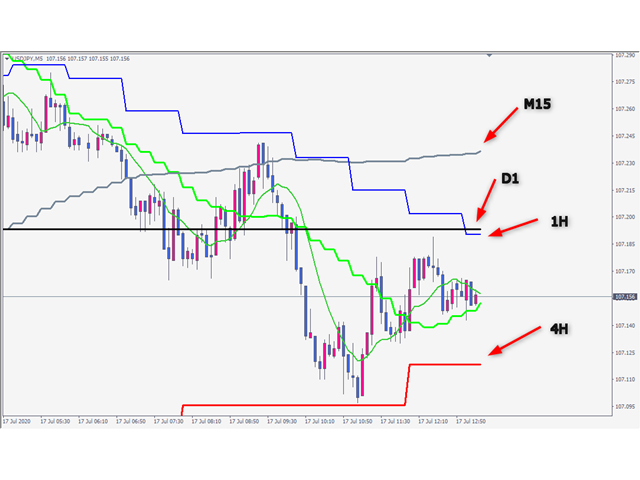
MTF Moving Averageを8本一気に表示してくれるインジケータになります。
8本も必要ない場合にももちろん非表示にできます。
どの通貨でも使用可能になります。
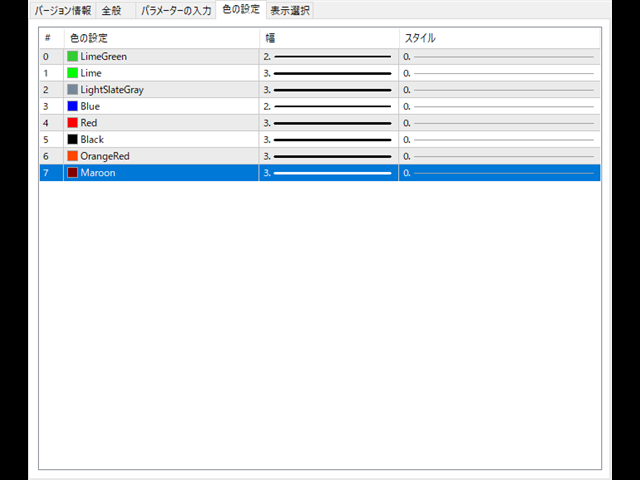
それぞれのMTF Moving Averageの色や太さを変更できます。
各パラメータの説明:
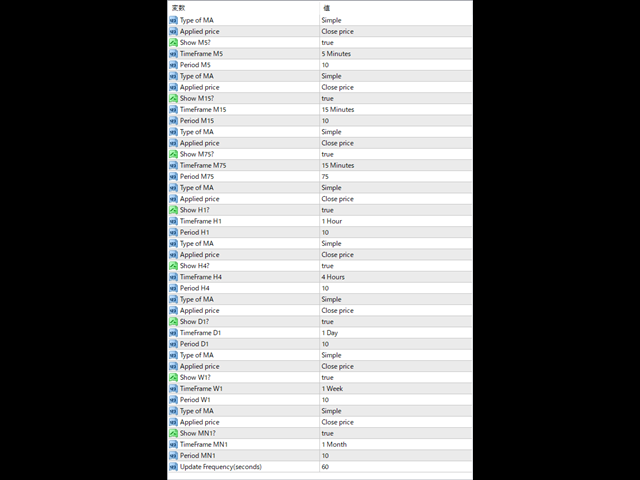
■Method:MAの種類設定をします。
■Applied price:MAで使用する価格を設定をします。
TimeFrame M5:使用するMAの時間足を設定します。
Period M5:使用するMAの期間を設定します。
※ラベルに関係なく8本のMTF MAはどの時間足でも期間設定可能になります。
■ Update Frequency(seconds):MTF Moving Averageの再作成更新頻度を入力します。