MTF MA2 for MT4 and Traders Club

特徴:
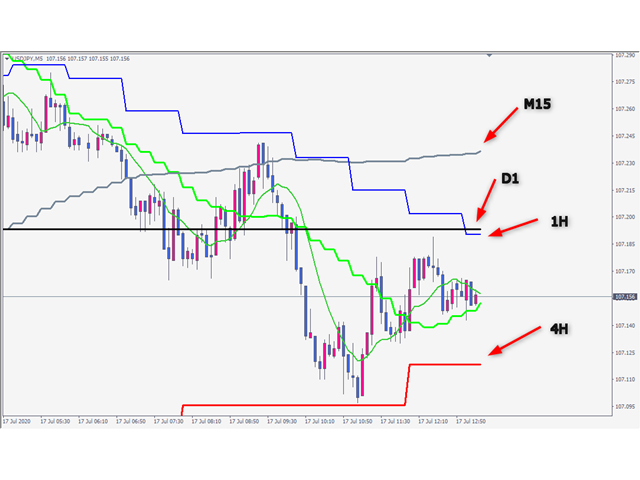
MTF Moving Averageを8本一気に表示してくれるインジケータになります。
8本も必要ない場合にももちろん非表示にできます。

どの通貨でも使用可能になります。

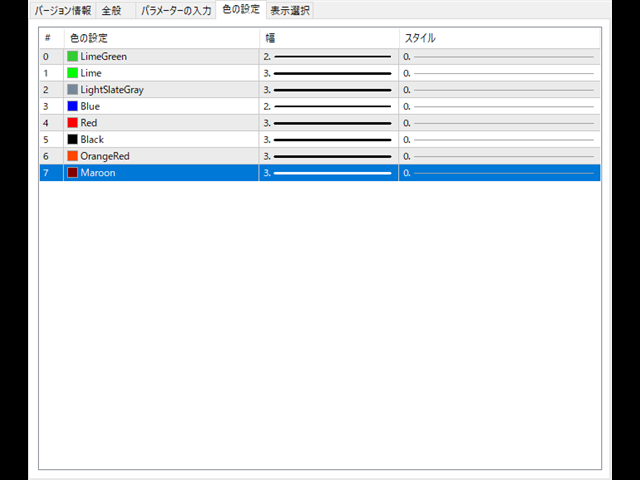
それぞれのMTF Moving Averageの色や太さを変更できます。

各パラメータの説明:

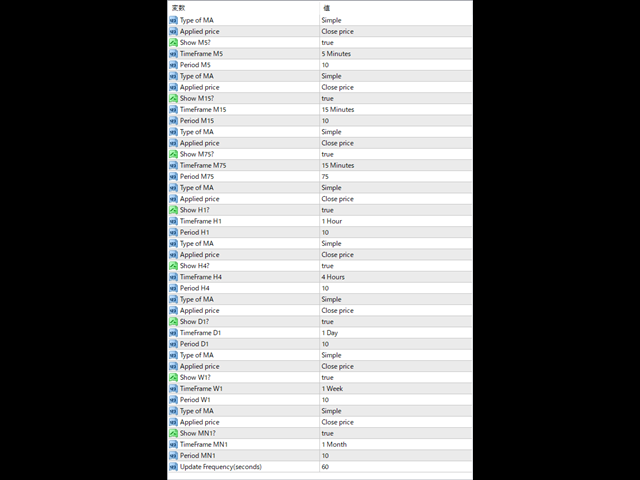
■Method:MAの種類設定をします。
■Applied price:MAで使用する価格を設定をします。
TimeFrame M5:使用するMAの時間足を設定します。
Period M5:使用するMAの期間を設定します。
※ラベルに関係なく8本のMTF MAはどの時間足でも期間設定可能になります。

■ Update Frequency(seconds):MTF Moving Averageの再作成更新頻度を入力します。
Önerilen ürünler
HMA Trend Professional MT4
Pavel Zamoshnikov
4.57 (7)
Improved version of the free HMA Trend indicator (for MetaTrader 4) with statistical analysis. HMA Trend is a trend indicator based on the Hull Moving Average (HMA) with two periods. HMA with a slow period identifies the trend, while HMA with a fast period determines the short-term movements and signals in the trend direction. The main differences from the free version: Ability to predict the probability of a trend reversal using analysis of history data. Plotting statistical charts for analyzi
This multi time frame and multi symbol indicator alerts about Heiken Ashi Smoothed color changes. As a bonus it can also scan for Hull Moving Average trend (color) changes. Combined with your own rules and techniques, this indicator will allow you to create (or enhance) your own powerful trading system. Features Can monitor all symbols visible in your Market Watch window at the same time. Apply the indicator to just one chart and instantly monitor the entire market. Can monitor every time frame,
Super Reversal Pattern
Parfait Mujinga Ndalika
Super Reversal Pattern Indicator Unlock the power of advanced pattern recognition with our Super Reversal Pattern Indicator. Designed for traders seeking precision and reliability, this indicator identifies one of the most effective reversal patterns in technical analysis, offering a significant edge in your trading strategy. Key Features: Non-Repainting Accuracy: Enjoy the confidence of non-repainting technology. Once a Super Reversal Pattern is detected, it remains static, providing consiste
VR Cub
Vladimir Pastushak
VR Cub , yüksek kaliteli giriş noktaları elde etmenin bir göstergesidir. Gösterge, matematiksel hesaplamaları kolaylaştırmak ve bir pozisyona giriş noktalarının aranmasını basitleştirmek için geliştirildi. Göstergenin yazıldığı ticaret stratejisi uzun yıllardan beri etkinliğini kanıtlamaktadır. Ticaret stratejisinin basitliği, acemi yatırımcıların bile başarılı bir şekilde ticaret yapmasına olanak tanıyan büyük avantajıdır. VR Cub, pozisyon açılış noktalarını ve Kâr Al ve Zararı Durdur hedef sev
DYJ Alligator SignalSource   is based on Alligator   indicator. It can be used for any currency pair and timeframe. The blue line (Alligator's Jaw) is the Balance Line for the timeframe that was used to build the chart (13-period Smoothed Moving Average, moved into the future by 8 bars); Red Line (Alligator's Teeth) is the Balance Line for the value timeframe of one level lower (8-period Smoothed Moving Average, moved by 5 bars into the future); Green Line (Alligator's Lips) is the Balance Line
ADX Pointer is an indicator which is based on "Average Directional Index" and draws three numbers in chart window depending on the value of ADX. In ADX Pointer you can set "ADX_Period" which is of course period of Average Directional Index and you can also set 3 levels. When ADX value exceed first level ("ADX_Level1") in chart window appears number "1", when ADX exceed second level ("ADX_Level2") appears "2" and when ADX exceed third level ("ADX_Level3") appears "3". Simple. ADX Pointer works on
EZZ Elite Zig Zag is an indicator for the MetaTrader 4 terminal. This indicator traces the peak of the trend based on the market reversal, thus showing various opportunities in the financial market. EZZ Elite Zig Zag is a visual tool, intuitive, and easy to understand and use.  Test it Yourself by Downloading it for Free. Author Paulo Rocha all rights reserved
The Four Moving Averages Message indicator ( please see the description and video ), a version of Four Moving Averages , concurrently displays four Moving Averages with default settings in the main chart window: Green and Red ones represent a short-term trend, Red and Blue ones - mid-term trend, while Blue and Yellow ones - long-term trend. You can change the moving average settings and colors. However, these parameters have been configured so that to allow trading on all time frames. The built-
Signal trend indicator. Detects the direction of the trend and is coloured accordingly.  Has built in audible and visual alerts when trends change. Can send notifications to your phone or email. Allows Trend and Counter-Trend trading. Works on all timeframes, all currency pairs, metals, indices and cryptocurrencies. Can be used with binary options. Distinctive features No re-drawing; Simple and clear settings; Four types of alerts; Works on all timeframes and all trading tools; Suitable
"Auto FIBO Pro" Crypto_Forex göstergesi - ticarette harika bir yardımcı araçtır! - Gösterge, Fibo seviyelerini ve yerel trend çizgilerini (kırmızı renk) otomatik olarak hesaplar ve grafikte yerleştirir. - Fibonacci seviyeleri, fiyatın tersine dönebileceği önemli alanları gösterir. - En önemli seviyeler %23,6, %38,2, %50 ve %61,8'dir. - Ters scalping veya bölge ızgara ticareti için kullanabilirsiniz. - Auto FIBO Pro göstergesini kullanarak mevcut sisteminizi geliştirmek için birçok fırsat vardır
[ZhiBiCCI] indicators are suitable for all cycle use, and are also suitable for all market varieties. [ZhiBiCCI] Green solid line is a reversal of bullish divergence. The green dotted line is a classic bullish divergence. [ZhiBiCCI] The solid line to the red is a reverse bearish divergence. The red dotted line is a classical bearish divergence. [ZhiBiCCI] can be set in the parameters (Alert, Send mail, Send notification), set to (true) to send instant signals to the alarm window, email, insta
Heiken Ashi candle chart is an improved version of The Japanese candle chart, which can effectively filter the market "noise" of the Japanese candle chart. It is favored by many traders for its simplicity and intuition. For trend traders, the HA candle chart is a magic tool. Unlike the traditional Japanese candle chart, Heikenashi does not reflect the opening price, high price, low price and closing price of the market. Instead, Heikenashi calculates the value of a single K line in the dominant
Indicador Taurus All4
Fabio Oliveira Magalhaes
Taurus All4 Taurus All4 is a high-performance indicator, it will tell you the strength of the trend, and you will be able to observe the strength of the candle. Our indicator has more than 4 trend confirmations. It is very simple and easy to use. Confirmation Modes Candle Trend Confirmations: When the candle switches to light green the trend is high. When the candle switches to light red the trend is reverting down. When the candle changes to dark red the trend is low. Trendline Trend Confirm
Indicator for binary options arrow is easy to use and does not require configuration works on all currency pairs, cryptocurrencies buy signal blue up arrow sell signal red down arrow tips do not trade during news and 15-30 minutes before their release, as the market is too volatile and there is a lot of noise it is worth entering trades one or two candles from the current period (recommended for 1 candle) timeframe up to m 15 recommended money management fixed lot or fixed percentage of the depo
Bollinger trading is an indicator for mt4 that uses Bollinger bands and other trend following strategies To detect the direction of the market. Just as attached in the screenshot the light blue line shows areas The market is rising. This means opening positions here is in the direction of the trend. The dark blue lines cane be used for sell trades when the market moves in the opposing direction. Using this tactics you can have a clear sense of where the market is headed.
The Stepping Trend Indicator     The Steppi ng Trend indicator uses the  average true range  (ATR indicator) in its calculation. This gives you control to set your own average true range period, I set the Default as 10.   Indicator Details. Green Arrow Up: This means you are at the starting point of a new bullish trend, it’s time to buy.   Red  Arrow  Down : This means you are at the starting point of a new  bearish  trend, it’ s time to sell .   What if you miss the Arrow Signal?   No prob
FXArk Kcci
Nithaam Davis
The KCCi uses a Grid method with a breakeven feature, its based around the CCI and Kijun-Sen of the Ichimoku indicator. Its recommended to be used with a cent account as it requires a high volume of capital along with a broker that allows numerous open positions, along with this low spreads are desired. All major pairs can be traded with this EA, including commodities and on all TFs though before any usage please optimize . IMPORTANT: These parameters will need to be increased to the max open
A classic indicator with advanced features for more accurate display of the market situation. All settings of all moving averages are available, such as the moving average type and the priced used in its calculation. It is also possible to change the appearance of the indicator - line or histogram. Additional parameters provide the ability of fine tuning. Distinctive features Does not redraw. Additional parameters for fine tuning. Displayed as a line or as a histogram. Works on all timeframes a
Binary Options Support Resistance Indicator This indicator is designed for binary options trading and effectively shows retracements from support and resistance levels. Signals appear on the current candle. A red arrow pointing downwards indicates a potential selling opportunity, while a blue arrow pointing upwards suggests buying opportunities. All that needs adjustment is the color of the signal arrows. It is recommended to use it on the M1-M5 timeframes as signals are frequent on these timef
The principle of this indicator is very simple: detecting the trend with Moving Average, then monitoring the return point of graph by using the crossing of Stochastic Oscillator and finally predicting BUY and SELL signal with arrows, alerts and notifications. The parameters are fixed and automatically calculated on each time frame. Example: If you install indicator on EURUSD, timeframe M5: the indicator will detect the main trend with the Moving Average on this timeframe (for example the Moving
GeoWprPro
Georgij Komarov
WPR by Profile, or WPR for Professionals Geo_WprPro is one of the well-known currency profile indicators. It simultaneously displays two WPR indicators with different parameters in the matrix form on all timeframes of multiple currency pairs forming the currency profile . As follows from the description, " WPR is a leading indicator that often goes ahead of the price chart. The oscillator frequently reaches extreme values before the price reversal as if anticipating that event: it almost always
Zen Market Flow - MTF SuperTrend MTF SuperTrend, her zaman diliminde kullanılabilen bir sistemdir. Bu çoklu zaman dilimi göstergesi, 1 ila 3 zaman diliminden gelen sinyalleri aynı anda görüntüler ve bunların uyumunu gösterir. SuperTrend göstergesini seviyorsanız, bu versiyonunu da seveceksiniz. Göstergenin sinyallerini ve çizimlerini geri testte test edebilir ve çoklu zaman dilimi sinyallerini görüntüleyebilirsiniz. Gösterge, tüm zaman dilimleri aynı yönü gösterdiğinde sinyaller sağlar, ekr
The indicator displays the data of the Stochastic oscillator from a higher timeframe on the chart. The main and signal lines are displayed in a separate window. The stepped response is not smoothed. The indicator is useful for practicing "manual" forex trading strategies, which use the data from several screens with different timeframes of a single symbol. The indicator uses the settings that are identical to the standard ones, and a drop-down list for selecting the timeframe. Indicator Paramet
"Dinamik Scalping Osilatörü" - gelişmiş, özel bir Kripto-Forex göstergesi - MT4 için verimli bir işlem aracı! - Yeni nesil Osilatörler - nasıl kullanılacağını görmek için resimlere bakın. - Dinamik Scalping Osilatörü, uyarlanabilir Aşırı Satış/Aşırı Alım bölgelerine sahiptir. - Osilatör, dinamik Aşırı Satış/Aşırı Alım bölgelerinden kesin giriş noktalarını bulmak için yardımcı bir araçtır. - Aşırı Satış değerleri: Yeşil çizginin altında, Aşırı Alım değerleri: Turuncu çizginin üzerinde. - Bu göst
Heiken Ashi Smoothed Strategy is a very simple but powerful system to get forex market trend direction. This indicator is actually 2 indicators in 1 pack, Heiken Ashi and Heiken Ashi Smoothed Moving Average both included. Because HA (Heiken Ashi) and HAS (Heiken Ashi Smoothed) are calculated in the same one system event with necessary buffers and loop only, so it is the FAST, OPTIMIZED and EFFICIENT HA having the combined indicator of MetaTrader 4. You can choose to display HA and HAS in the sam
Indicator for determining flat and trend. If the price is below any of the two histograms and two lines (red and blue), this is a sell zone. When purchasing this version of the indicator, MT5 version for one real and one demo account - as a gift (to receive, write me a private message)! If the price is above any of the two histograms and two lines (red and blue), this is a buy zone. MT5 version:  https://www.mql5.com/en/market/product/70409 If the price is between two lines or in the zone of
EARLY REMINDER: The Starting price is 65 price will rise soon up to 365$ and then 750$ after first 10 copies of sales. Grab this offer now! Introduction Hello, traders! Welcome to the demonstration of the Forex Beast Indicator , a comprehensive tool designed to assist aspiring traders in navigating the complexities of the forex market. This indicator incorporates seven essential components to provide a well-rounded trading experience: Moving Averages Colored Zones Support and Resistance Levels
Ortalama geri dönüş ticareti için profesyonel ve nicel bir yaklaşım uygulayan benzersiz gösterge. Fiyatın tahmin edilebilir ve ölçülebilir bir şekilde ortalamaya döndüğü ve yön değiştirdiği gerçeğinden yararlanır, bu da nicel olmayan ticaret stratejilerinden büyük ölçüde daha iyi performans gösteren net giriş ve çıkış kurallarına izin verir. [ Installation Guide | Update Guide | Troubleshooting | FAQ | All Products ] Ticaret sinyallerini temizle Ticaret yapmak inanılmaz derecede kolay Özelleşt
Trend Osilatörü - gelişmiş bir özel Crypto_Forex göstergesi, etkili bir ticaret aracıdır! - Gelişmiş yeni hesaplama yöntemi kullanılır - "Hesaplama için fiyat" parametresi için 20 seçenek. - Şimdiye kadar geliştirilen en akıcı osilatör. - Yükselen trendler için yeşil renk, düşen trendler için kırmızı renk. - Aşırı satım değerleri: 5'in altında, Aşırı alım değerleri: 95'in üzerinde. - Bu göstergeyle standart stratejileri bile yükseltmek için birçok fırsat vardır. - PC ve Mobil uyarılarla. Yüksek
Your Good Friends — this is not just an indicator, but your reliable trading assistant, designed for traders who value simplicity, clarity, and stability. It combines the best classic methods of technical analysis — support and resistance levels, reversal signals, visual cues — and presents them in the clearest, most user-friendly format possible. Suitable for both beginners and experienced traders — especially those who want to eliminate chaos, reduce stress, and trade based on clear signals.
Bu ürünün alıcıları ayrıca şunları da satın alıyor
Trend SniperX MT4
Sarvarbek Abduvoxobov
5 (3)
Trend Sniper X , işlemcilerin trend yönünü ve olası dönüş noktalarını netlik ve hassasiyetle belirlemelerine yardımcı olan MetaTrader 5 için çoklu zaman dilimli bir trend takip göstergesidir. MT5 İçin: https://www.mql5.com/en/market/product/181101 Fiyat Bilgisi: Mevcut fiyat tanıtım amaçlıdır ve gelecek güncellemeler ile yeni özellikler eklendikçe değişebilir. Code2Profit Kanalı Çoklu Zaman Dilimi Analizi ile Piyasaya Hakim Olun! Trend Sniper X ile Kazanma Oranınızı Nasıl En Üst Düzeye Çıkarırsı
Miraculous Indicator Binary & Forex v3 StrategySafe Miraculous Indicator Binary & Forex v3 StrategySafe , net sinyaller, güçlü onay araçları ve Binary ile Forex piyasalarında kullanılabilecek yapılandırılmış bir işlem yaklaşımı isteyen traderlar için geliştirilmiş profesyonel bir indikatördür. v3 sürümü; MIR Dashboard, Miraculous Confirmation Dashboard, GANN Law, Square of 9 seviyeleri, GANN açıları ve daha gelişmiş Forex modu ile daha güçlü bir piyasa analizi sunar. Öne çıkan özellikler Tek ind
Zoryk Gold mt4
Reda El Koutbane
5 (2)
ZORYK — MetaTrader 4 için gelişmiş XAUUSD sinyal ve işlem planlama sistemi Bu durumu muhtemelen daha önce yaşadınız. Altını analiz edersiniz, giriş için beklersiniz ve sonunda işlemi açarsınız. Fiyat hemen ters yönde hareket eder. Çok erken kapatırsınız, Stop Loss seviyesini değiştirirsiniz veya birkaç saniye tereddüt edersiniz. Kısa süre sonra piyasa, siz işlemde değilken başlangıçta beklediğiniz yöne ve hedefe ulaşır. Sorun her zaman yön değildi. Asıl sorun belirsizlikti. Tam olarak nere
SR Liquidity
Oleg Rodin
5 (2)
SR Liquidity , piyasa likiditesinin yoğunlaştığı ve fiyatın en güçlü tepkiyi verdiği gizli bölgeleri ortaya çıkarmak için tasarlanmış bir alım-satım göstergesidir. Bu özel likidite alanları güçlü destek ve direnç seviyeleri işlevi görerek, piyasanın yön değiştirme ihtimalinin en yüksek olduğu yerlere dair size net bir harita sunar. SR Liquidity, sıradan Destek/Direnç çizgileri çizmek yerine, alım ve satım baskısının yoğunlaştığı bölgeleri tespit etmek için gerçek fiyat hareketlerini analiz eder.
Gann Made Easy
Oleg Rodin
4.84 (172)
Gann Made Easy , bay teorisini kullanarak ticaretin en iyi ilkelerine dayanan, profesyonel ve kullanımı kolay bir Forex ticaret sistemidir. WD Gann. Gösterge, Zararı Durdur ve Kâr Al Seviyeleri dahil olmak üzere doğru SATIN AL ve SAT sinyalleri sağlar. PUSH bildirimlerini kullanarak hareket halindeyken bile işlem yapabilirsiniz. Satın alma işleminden sonra, alım satım talimatlarını ve harika ek göstergeleri ücretsiz olarak almak için lütfen benimle iletişime geçin! Muhtemelen Gann ticaret yöntem
Precision Index Osilatörü (Pi-Osc) - Precision Trading Systems'dan Roger Medcalf Sürüm 2, grafiklerinizde hızlı bir şekilde yüklenmek üzere dikkatle yeniden kodlandı ve deneyimi artırmak için bazı teknik geliştirmeler de içerdi. Pi-Osc, herkesin stoplarını almak için zorlanan pazarların gitmek zorunda kaldığı aşırı yorgunluk noktalarını bulmak için tasarlanmış doğru ticaret zamanlama sinyalleri sunmak amacıyla oluşturuldu. Bu ürün, aşırı noktaların nerede olduğunu bilmek gibi yaşlı bir sorun
DayTrader PRO MT4
Davit Beridze
4.6 (10)
DayTrader PRO MT5:  https://www.mql5.com/en/market/product/186222 DayTrader PRO, John Ehlers'in Laguerre filtresini güçlü bir otomatik optimizasyon motoruyla birleştiren gelişmiş bir alım satım indikatörüdür. Sabit parametreler kullanmak yerine, indikatör yakın piyasa koşullarına göre en iyi ayarları otomatik olarak arar ve sürekli manuel ayarlamalar yapmadan değişen piyasa volatilitesine uyum sağlamanıza yardımcı olur. İndikatör, net ALIM (BUY) ve SATIM (SELL) sinyallerinin yanı sıra mevcut piy
Currency Strength Wizard , başarılı ticaret için size hepsi bir arada çözüm sağlayan çok güçlü bir göstergedir. Gösterge, birden çok zaman dilimindeki tüm para birimlerinin verilerini kullanarak şu veya bu forex çiftinin gücünü hesaplar. Bu veriler, şu veya bu para biriminin gücünü görmek için kullanabileceğiniz, kullanımı kolay para birimi endeksi ve para birimi güç hatları biçiminde temsil edilir. İhtiyacınız olan tek şey, işlem yapmak istediğiniz tabloya göstergeyi eklemektir ve gösterge size
Tokyo mt4 Indicator
Vasiliy Strukov
5 (2)
Tokyo Indicator; trend yönü, potansiyel işlem sinyalleri ve piyasa koşulları hakkında net ve görsel bir genel bakış sunar. Renk kodlu ve kademeli trend çizgisi, yükseliş evrelerini (mavi) düşüş evrelerinden (macenta) ayırt eder. Trend değiştiğinde, buna karşılık gelen yön okları potansiyel alım ve satım fırsatlarını vurgular. Entegre bir panel; mevcut sinyali, piyasa eğilimini, momentumu, volatiliteyi ve sinyal kalitesini tek bir kullanışlı görünümde bir araya getirir. Bu sayede yatırımcılar, f
M1 Sniper
Oleg Rodin
4.97 (30)
M1 SNIPER kullanımı kolay bir işlem göstergesi sistemidir. M1 zaman dilimi için tasarlanmış bir ok göstergesidir. Gösterge, M1 zaman diliminde scalping için bağımsız bir sistem olarak kullanılabilir ve mevcut işlem sisteminizin bir parçası olarak kullanılabilir. Bu işlem sistemi özellikle M1'de işlem yapmak için tasarlanmış olsa da, diğer zaman dilimleriyle de kullanılabilir. Başlangıçta bu yöntemi XAUUSD ve BTCUSD ticareti için tasarladım. Ancak bu yöntemi diğer piyasalarda işlem yaparken de ya
PRO Renko Sistemi, RENKO grafikleri ticareti için özel olarak tasarlanmış son derece hassas bir ticaret sistemidir. Bu, çeşitli ticaret araçlarına uygulanabilen evrensel bir sistemdir. Sistemi etkin piyasa sana doğru ters sinyallerine erişim hakkı denilen ses nötralize eder. Göstergenin kullanımı çok kolaydır ve sinyal üretiminden sorumlu tek bir parametreye sahiptir. Aracı, seçtiğiniz herhangi bir ticaret aracına ve renko çubuğunun boyutuna kolayca uyarlayabilirsiniz. Yazılımımla karlı bir
Entry Points Pro
Yury Orlov
4.59 (174)
Yeniden boyamadan bir ticarete girmek için doğru sinyaller sağlayan MT5 için en iyi gösterge! Herhangi bir finansal varlığa uygulanabilir: forex, kripto para birimleri, metaller, hisse senetleri, endeksler. MT5 versiyonu burada Oldukça doğru alım satım sinyalleri sağlayacak ve bir alım satımı açıp kapatmanın en iyi zamanını size söyleyecektir. Göstergeyi ödeyen yalnızca bir sinyali işleme örneğiyle videoyu (6:22) izleyin! Çoğu tüccar, Giriş Noktaları Pro göstergesinin yardımıyla ilk işlem h
PZ Swing Trading
PZ TRADING SLU
5 (3)
Protect against whipsaws: revolutionize your swing trading approach Swing Trading is the first indicator designed to detect swings in the direction of the trend and possible reversal swings. It uses the baseline swing trading approach, widely described in trading literature. The indicator studies several price and time vectors to track the aggregate trend direction and detects situations in which the market is oversold or overbought and ready to correct. [ Installation Guide | Update Guide | Tro
Bu ürün 2026 piyasası için güncellendi ve en son MT5 sürümleri için optimize edildi. FİYAT GÜNCELLEME BİLDİRİMİ: Smart Trend Trading System şu anda $99 fiyatıyla sunulmaktadır. Sonraki 30 satın alma işleminden sonra fiyat $199 olacaktır. ÖZEL TEKLİF: Smart Trend Trading System satın aldıktan sonra bana özel mesaj gönderin, Smart Universal EA’yı ÜCRETSİZ olarak alın ve Smart Trend sinyallerinizi otomatik işlemlere dönüştürün. Smart Trend Trading System, daha temiz sinyaller, daha iyi trend yönü
CRT Candle Range Theory HTF MT4 - Ultimate CRT Indicator: Gelişmiş ICT Konseptleri ve Malaysian SnR Ticaret Sistemi En gelişmiş Candle Range Theory göstergesi ile Piyasa Yapıcıların ayak izlerinde ustalaşın. Smart Money Concepts (SMC) gücünü açığa çıkarın ve Ultimate CRT Indicator ile tıpkı kurumlar gibi hassas bir şekilde ticaret yapın. Sadece ciddi yatırımcılar için özel olarak oluşturulan bu gösterge, ICT Konseptlerinin (Inner Circle Trader) temel direği olan oldukça etkili CRT (Candle Range
TPA True Price Action indicator reveals the true price action of the market makers through 100% non-repainting signals (except early signals mode) strictly at the close of a candle! TPA shows entries and re-entries, every time the bulls are definitely stronger than the bears and vice versa. Not to confuse with red/green candles. The shift of power gets confirmed at the earliest stage and is ONE exit strategy of several. There are available now two free parts of the TPA User Guide for our custom
Quantum Naked SMC Prime is a streamlined Smart Money Concepts indicator designed for traders who prefer a clean chart, structured market analysis and clear visual trade setups without unnecessary complexity. The indicator combines market structure, liquidity behavior, institutional zones and confirmation logic into a compact analytical framework. Instead of flooding the chart with technical indicators, Quantum Naked SMC Prime focuses on the core elements of price action and Smart Money Concepts.
ŞU ANDA %40 INDIRIMLI !!! Yeni Başlayanlar veya Uzman Tüccarlar için En İyi Çözüm! Bu gösterge benzersiz, yüksek kaliteli ve uygun fiyatlı bir ticaret aracıdır çünkü bir dizi tescilli özellik ve gizli bir formül ekledik. Yalnızca BİR grafikle 28 döviz çiftinin tümü için Uyarılar verir. Yeni bir trendin veya scalping fırsatının tam tetik noktasını belirleyebildiğiniz için ticaretinizin nasıl gelişeceğini hayal edin! Yeni temel algoritmalar üzerine inşa edilen bu sistem, potansiyel işlemlerin
KURAMA GOLD SIGNAL PRO (MT4) — 7 Katmanlı Filtre, Otomatik TP/SL, Kalite Puanı ve Sinyal Geçmişi Kaydı | Eksiksiz XAUUSD Ticaret Sistemi Gerçek zamanlı olarak yeniden çizmez. Bir sinyal belirdiği anda ok, giriş, TP ve SL anında sabitlenir ve sonradan hareket etmez. Sizin işlem yaptığınız şey bu gerçek zamanlı sinyaldir. Ve v7.20'de, gerçekten gönderilen her sinyal otomatik olarak kaydedilir ve yeniden başlatmanın ardından olduğu gibi geri yüklenir. ALICILARA ÖZEL HEDİYE
SMC Market Structure MT4 PRO is a chart-based analysis indicator for MetaTrader 4 designed for traders who use Smart Money Concepts (SMC), Inner Circle Trader (ICT) concepts, market structure, liquidity analysis, and multi-timeframe price action. MT5 version: SMC Market Structure MT5 PRO The indicator brings a comprehensive collection of SMC and ICT tools into a single chart, including Market Structure, Break of Structure (BOS), Change of Character (CHoCH), Order Blocks (OB), Fair Value Gaps (FV
Quantum Breakout Indicator PRO
Bogdan Ion Puscasu
4.96 (26)
Tanıtım       Quantum Breakout PRO   , Breakout Bölgeleri ile ticaret yapma şeklinizi değiştiren çığır açan MQL5 Göstergesi! 13 yılı aşkın ticaret deneyimine sahip deneyimli tüccarlardan oluşan bir ekip tarafından geliştirilen   Quantum Breakout PRO   , yenilikçi ve dinamik koparma bölgesi stratejisiyle ticaret yolculuğunuzu yeni zirvelere taşımak için tasarlanmıştır. Kuantum Breakout Göstergesi, size 5 kar hedefi bölgesi ile kırılma bölgelerinde sinyal okları ve kırılma kutusuna dayalı olara
ARTEMIS ALT PENCERE DÖNÜŞ SİSTEMİ , yeniden çizim yapmayan güçlü bir Forex göstergesidir. Smart Money Concepts (Akıllı Para Kavramları) ve stochastic momentum analizi kombinasyonu kullanarak yüksek olasılıklı dönüş işlemlerini tespit etmek için geliştirilmiştir. Hassas girişler yapmak isteyen trader’lar için tasarlanan bu gösterge, likidite süpürme tespiti, piyasa yapısı değişimi ve momentum onayını tek, temiz ve profesyonel bir trading aracında birleştirir. BU GÖSTERGE NEDEN ÖNE ÇIKIYOR Çoğu g
Introducing the POWER TRADE Indicator Created by a small group of experienced traders with years of profitable experience in the financial markets, the Power Trade Indicator is a plug-and-play trading tool designed to help traders spot high-quality setups with ease and confidence. What It Does: It provides powerful entry signals, profit-taking zones, and rebound areas — giving you a complete view of where price action is most likely to move next. The indicator reacts in real time, al
Dark Support Resistance  is an Indicator for intraday trading. This Indicator is programmed to identify  Support and Resistance Lines , providing a high level of accuracy and reliability. Key benefits Easily visible lines Only the most important levels will be displayed Automated adjustment for each timeframe and instrument Easy to use even for beginners Never repaints, never backpaints, Not Lag 100% compatible with Expert Advisor development All types of alerts available: Pop-up, Email, Push
Volume Break Oscillator, fiyat hareketini osilatör biçiminde hacim trendleriyle eşleştiren bir göstergedir. Stratejilerime hacim analizini entegre etmek istedim ancak OBV, Money Flow Index, A/D ve ayrıca Volume Weighted Macd ve diğerleri gibi çoğu hacim göstergesinden her zaman hayal kırıklığına uğradım. Bu nedenle bu göstergeyi kendim için yazdım, ne kadar kullanışlı olduğundan memnunum ve bu nedenle piyasada yayınlamaya karar verdim. Başlıca özellikleri: Fiyatın hacimlerdeki bir artış (kır
Scalper Inside PRO
Alexey Minkov
4.74 (69)
Scalper Inside PRO helps you read the intraday trend and plan a trade before you enter the market. It is built around three exclusive strategies for a sharper read of the market. The moment a signal appears, the indicator evaluates market direction and calculates the key levels, so you see the potential entry, the expected stop-loss and several profit-taking levels in advance. Detailed performance statistics show how different instruments and strategies performed in history and help you pick ass
UPD1 Volume BOX
Vitaliy Kuznetsov
4.94 (16)
Gösterge, belirtilen alandaki (BOX) yatay hacim profilini ve maksimum hacmi (POC) görüntüler. Ürün Özellikleri. 1. Keneleri veya sadece fiyatı kullanabilirsiniz. 2. Uyarlanabilir ızgara aralığı (M1-MN). 3. Kutu boyutuna bağlı olarak uyarlanabilir yüksek hacimli (medyan) arama adımı. 4. Kutu çizgileri ve düğmeler için otomatik bukalemun rengi. 5. Çoklu kutular, oluşturulması ve silinmesi kolay. 6. %70 hacim alanı (ayarlardan etkinleştirilir). 7. Maksimum yatay hacim çizgisine (POC) dokunmak için
PZ Trend Trading
PZ TRADING SLU
4.8 (5)
Capture every opportunity: your go-to indicator for profitable trend trading Trend Trading is an indicator designed to profit as much as possible from trends taking place in the market, by timing pullbacks and breakouts. It finds trading opportunities by analyzing what the price is doing during established trends. [ Installation Guide | Update Guide | Troubleshooting | FAQ | All Products ] Trade financial markets with confidence and efficiency Profit from established trends without getting whips
FibonacciAlert Pro - MetaTrader 5 için Ticaret Göstergesi FibonacciAlert Pro, grafiklerinizdeki Fibonacci seviyelerini otomatik olarak izleyen ve gerçek zamanlı uyarılar gönderen MetaTrader 5 ve 4 için gelişmiş bir göstergedir. Teknik analizlerinde Fibonacci geri çekilmelerini kullanan tüccarlar için profesyonel bir çözüm sunmak üzere geliştirilmiştir. Gelişmiş FIBO ALERTS PRO göstergesi, MetaTrader 4 ve MetaTrader 5 ile uyumlu iki versiyonda mevcuttur ve tüm Forex aracı kurumları ve özel tica
True Direction Oscillator
Muhammad Elbermawi
4.85 (364)
Veya "Saf Momentum " ilkesini kullanarak fiyat değişim oranını ölçen bir endeks olan (TDO). Bir menkul kıymet fiyatı 10'dan 15'e yükseldiğinde, fiyat değişim oranı %150'dir, ancak 15'ten 10'a düştüğünde, fiyat değişim oranı sadece %33.3'tür. Bu nedenle, "Fiyat Değişim Oranı" (ROC) veya "Momentum" gibi teknik analiz göstergeleri, artan fiyat hareketleri için azalan hareketlere göre daha yüksek değerler verir. TDO, yatırımcıların momentumu doğru okumalarına yardımcı olmak için bu sorunu düzeltir.
Yazarın diğer ürünleri
このEAを使用することによりワンクリックによる決済、 決済したい通貨のチャートに適用しておけば様々な条件で自動で 決済することが可能になります。 パフォーマンスを考慮しているので動作が非常に軽いです。 新機能:Ver2.3 設定した利益以上になるとSLが建値(BE)に設定 新機能:Ver2.0 資金管理による買いや売りエントリ トレード毎に自動スクリーンショット取得 詳細な情報はこちらにサイトがあります。 https://toushika.top/tc-panel-for-mt5/ 機能: ワンクリックによる全通貨決済 ワンクリックによる表示上の通貨決済 分かりやすいPips表示 移動可能 全通貨での合計Pips表示 自動利確、損切り設定 設定以上のスプレッドになった場合には画面の色が変化 Break Evenラインの表示 チャート画像の保存 決済の通知機能(Email,SNS) パネル位置指定 Pips表示消去 他の通貨で設定した水平線で決済 下記に示した条件での利確 条件による決済: 条件1:利確か損切で決済 条件2:利確か損切また
Traders Club Clock for MT5 Readme ローソク足のすぐ横にその時間足での 残り時間とスプレッドを表示します。 ※残り時間はサーバ時間から計算しています。 月足、週足、日足、4時間足、1時間足、30分足、15分足、5分足、1分足 で表示可能となっております。 ※スプレッド値ポイント単位での表示になります。 ※時間の更新はティック毎ではなく1秒 毎 に更新するようにしています。   一目で残り時間とスプレッドを確認できます。 機能: 使用しているフォント種類を変更できます。 使用しているフォントサイズを変更できます。 表示しているテキストの色を変更できます。 スプレッド表示を非表示にすることができます。 表示する位置を変更することが出来ます。
FREE
エントリー前に確認できるチェックリストを作成しました。 以下のコードを参照してMT5用に作成しました。 Strategy Checklist - indicator for MetaTrader 4 https://www.mql5.com/en/code/18877 機能: チェックリスト20個まで入力できます。 表示位置 (左上 、 右上 、 左下 、 右下) の 指定 が可能 になります。 フォントサイズ の 変更が可能 になります。 チェックリストの幅を変更できます。 ドラッグ&ドロップでチェックリストを移動できます。 インストール方法: ファイル->データフォルダーを開く->MQL5フォルダー->Indicatorsフォルダー 配下にex5ファイルを置いてMT5を再起動してください。 チェックリストはマニュアルで入力が必要になります。入力後 保存しておいてください。 テンプレートで保存しておくと容易にチャートに適用できます。
FREE
TrendBar
Koji Kobayashi
5 (3)
パラボリックのデータをもとにトレンドの方向性を1分足から月足まで表示します。 1分足から 月足 まで表示されているので今どの方向に価格が動いているのかがすぐに分かります。 更新はティク毎ではなくディフォルトでは1秒毎、もちろん変更も可能なのでチャートの表示が遅くなるようなことはありません。 機能: どの通貨でも表示可能になります。 アイコンの色を指定することが可能になります。 表示位置(X軸、Y軸)が変更可能 になります。 表示位置 (左上 、 右上 、 左下 、 右下) が 指定 が可能 になります。 フォント を指定することが可能になります。 フォントサイズ が 変更可能 になります。 アイコンのサイズ が 変更可能 になります。 週足、 月足  の非表示 が 可能 になります。
FREE
パラボリックのデータをもとにトレンドの方向性を1分足から月足まで表示します。 1分足から 月足 まで表示されているので今どの方向に価格が動いているのかがすぐに分かります。 更新はティク毎ではなくディフォルトでは1秒毎、もちろん変更も可能なのでチャートの表示が遅くなるようなことはありません。 機能: どの通貨でも表示可能になります。 パラボリックの数値を変更することは可能になります。 上昇時と下降時のアイコンの色を指定することが可能になります。 表示位置(Y軸)が変更可能 になります。   表示位置 (左上 、 右上 、 左下 、 右下) が 指定 が可能 になります。 フォント を指定することが可能になります。 フォントサイズ が 変更可能 になります。 アイコンのサイズ が 変更可能 になります。 週足、 月足  の非表示 が 可能 になります。
FREE
多数の通貨を取引している場合、画面をカチャカチャ切り替えの際にどの通貨を見ているか 迷ったことはありませんか。 表示している通貨が大きく表示されるMT4用のインジケーターは あるのですがMT5用がなかったので作成しました。 機能: どの通貨でも表示可能になります。 表示位置 (左上 、 右上 、 左下 、 右下) の 指定 が可能 になります。 表示位置(X軸、Y軸)が変更可能 になります。 フォントの色を 変更可能 になります。 使用するフォント を指定することが可能になります。 フォントサイズ の 変更が可能 になります。 インストール方法: ファイル->データフォルダーを開く->MQL5フォルダー->Indicatorsフォルダー 配下にex5ファイルを置いてMT5を再起動してください。
FREE
RoundNum Readme (Traders Club) 特徴: このツールはDOWやNIKKEIなど500や1000ポイントがラウンドナンバーの 指数を取引する際に表示するように開発しました。 もちろんメジャー通貨でも表示はされます。 更新頻度を制限しているのでチャート表示が遅くなるということは ありません。 XMでDOWを取引される場合、Main Levelsを10000 Sub Levelsを5000にしてください。 各パラメータの説明: Number to display lines:表示するライン数を設定します。 Main Levels:メインレベルをポイントで指定します。 Main Line Color:メインラインの色を設定します。 Main Line Style:メインラインで使用されるラインを設定します。 Show Sub Lines:サブラインを表示するか設定します。 Sub Levels:サブレベルをポイントで指定します。 Sub Line Color:サブラインの色を設定します。 Sub Line Style:サブラインで使用され
FREE
特徴: このツールはDOWやNIKKEIなど500や1000ポイントがラウンドナンバーの 指数を取引する際に表示するように開発しました。 もちろんメジャー通貨でも表示はされます。 更新頻度を制限しているのでチャート表示が遅くなるということは ありません。 XMでDOWを取引される場合、Main Levelsを10000 Sub Levelsを5000にしてください。 各パラメータの説明: Number to display lines:表示するライン数を設定します。 Main Levels:メインレベルをポイントで指定します。 Main Line Color:メインラインの色を設定します。 Main Line Style:メインラインで使用されるラインを設定します。 Show Sub Lines:サブラインを表示するか設定します。 Sub Levels:サブレベルをポイントで指定します。 Sub Line Color:サブラインの色を設定します。 Sub Line Style:サブラインで使用されるラインを設定します。 Update Frequency(600
FREE
Time Line (Traders Club)  機能: 昨日高値、安値、本日始値、高値、安値の時間から線を引きます。 時間足により表示する時間が変わります。 1分、5分足では1時間ごとの表示 15分、30分足では4時間ごとの表示 1時間、4時間は12時間ごとの表示 日足以降は時間は表示されません。 高値安値は週足より下位足で表示されます。 各ラベルを変更可能になります。 更新頻度を変更できるのでチャート表示が 重くなることはありません。 各パラメータの説明: Difference hours form Server Time: サーバとの時間差を入力します。 Yesterday High Label:昨日高値のラベルを設定します。 Yesterday Low Label:昨日安値のラベルを設定します。 Show open line:true 始値の線を表示するかどうか Today Open Label:本日始値のラベルを設定します。 Today High Label:本日高値のラベルを設定します。 Today Low Label:本日安値のラベルを設定します。 Lim


MA cross AKT (Traders Club)  機能: MAゴールデンクロスで買いサイン、デットクロスで売りサインを表示します。 MAの期間は入力できます。 MAの種類を選択できます。(SMA、EMA、SMMA、LWMA) 適用する価格を選べます。(CLOSE,OPEN,LOW,HIGH,MEDIAN,TYPICAL,WEIGHTED) サインをアラートで通知します。 サイン発生をE-mailやSNSで通知します。 MAクロスの勝率を表示します。 ローソク足の本数を変更することにより過去何か月かの MAクロスの勝率をすぐに確認することができます。 これは各時間足、各通貨で確認することが出来ます。 判定するローソク足を3か所選ぶことが出来ます。 ディフォルトでは5本目、9本目、14本目となっています。 サインの表示をボタンで表示したり消したりできます。 表示するサインを変更することが出来ます。
このEAを使用することにより様々な条件で自動で決済することが可能になります。 詳細な情報はこちらにサイトがあります。 https://toushika.top/ea-takeaprofit/ 条件: 条件1:利確か損切で決済 条件2:利確か損切または反転MAで決済 (ディフォルトでは20MA反転で利確) 条件3:利確か損切またはゴールデンクロス、デットクロスで決済 条件4:利確か損切またはボリンジャーバンドにタッチで決済 条件5:利確か損切またはパラボリックで決済 条件6:利確か損切または設定した水平線で決済 <- 他の通貨で設定した水平線でも決済可能 重要:水平線で決済の際、買いポジションと売りポジションは同時に持てません。 買いポジションがある時に売りポジションを持つとすぐに決済されてしまいます。 反対に売りポジションがる時に買いポジションを持つとすぐに決済されてしまいます のでご注意ください。
PO-Plus Readme 機能: 3つのロジックでの買いサイン、売りサインを表示します。 各ロジックでの勝率を表示します。 サイン表示後、勝率を確認して高い勝率でBOやFXでエントリーすることが出来ます。 勝率の判定本数を変更できます。 Indicator Noを変えることによるこのインジケータを複数適用することができます。 これによりRCIの数値を変更して勝率を複数表示が可能になります。 その際は、ラベルの表示位置も変更してください。 ボタンを押すことによりラベルや買いサイン、売りサインを表示、非表示すことが出来ます。   注意:こちらのロジックはZigZag+ロジックでの勝率になりますので 勝率は実際のものより高めに表示されます。 エントリーする際は勝率60%以上のものを推奨します。 ZigZagベースなので価格が動く日本、欧州、NY時間の前半でのエントリしない ことを推奨します。 各パラメータの説明: ----------Basic Setting---------- Indicator No:インジケータNoを設定します。もし同じチャートに複数適用し
移動平均線クロス、ボリンジャーと移動平均線のクロス、移動平均線の角度でサイン表示 MT5インジケータ こちらに サイト とがあります。 このインジケータは3つのパターンでサインを表示(切り替え可能)します。 ①   移動平均線のクロス ②   ボリンジャーバンドと短期移動平均線とのクロス ③   ボリンジャーバンドと短期移動平均線とのクロスと、中期移動平均線と長期移動平均線の角度 移動平均線のクロス 指定した短期移動平均線と長期移動平均線のゴールデンクロスでは買いサイン、デットクロスでは売りサインを表示します。 ディフォルトでは短期は5,長期は20となっています。 もちろん変更可能になります。 移動平均線の種類をEMA(指数平滑移動平均線)やSMMA(平滑化移動平均)などに変更可能で適する価格も変更可能になります。 ボリンジャーバンドと短期移動平均線のクロス ボリンジャーバンド(以降BB)と短期移動平均線のクロスでサインを表示します。 ディフォルトではBB+1σと5MAのゴールデンクロスで買いサイン、BB-1σと5MAのデットクロスで売りサインでサインを表示します。 BBの期間や、B
Time Line for MT5 機能: 昨日高値、安値、本日始値、高値、安値の時間から線を引きます。 時間足により表示する時間が変わります。 1分、5分足では1時間ごとの表示 15分、30分足では4時間ごとの表示 1時間、4時間は12時間ごとの表示 日足以降は時間は表示されません。 高値安値は週足より下位足で表示されます。 各ラベルを変更可能になります。 更新頻度を変更できるのでチャート表示が 重くなることはありません。 各パラメータの説明: Server_Time:6 サーバとの時間差を入力 Yesterday_High_Label:昨日高値 Yesterday_Low_Label:昨日安値 Show_Open:true 始値の線を表示するかどうか Today_Open_Label:本日始値 Today_High_Label:本日高値 Today_Low_Label:本日安値 max_bar:true 使用するバーを制限するかどうか Maxbars:1500 制限を使用した場合に1分では5日分 UpdateFrequency:60 更新頻度、ディフォルトは60秒ご
MTF MA2 for MT5
Koji Kobayashi
3 (1)
MTF-MA2 for MT5 特徴: MTF Moving Averageを8本一気に表示してくれるインジケータになります。 8本も必要ない場合にももちろん非表示にできます。 パフォーマンスを考慮しているのでチャートが重くなるようなことは 無いはずになります。どの通貨でも使用可能になります。 それぞれのMTF Moving Averageの色や太さを変更できます。 各パラメータの説明: Method:MAの種類設定をします。 Applied price:MAで使用する価格を設定をします。 TimeFrame M5:使用するMAの時間足を設定します。 Period M5:使用するMAの期間を設定します。 ※ラベルに関係なく8本のMTF MAはどの時間足でも期間設定可能になります。 Limited bar?:表示に使用するバーを制限するかどうかを設定します。 ※ここをFalseにするとすべてのバーを読み込むことになるのでチャートが重く なるかもしれません。ご注意ください。 Max bars:使用するバーの本数を設定します。過去検証をする場合にはここの値を増やしてくだ
MTF-Candlestick (Traders Club) 特徴: このインジケータは上位足のローソク足を表示します。 この上位足のローソク足を表示のインジケータは特に1分足や 5分足トレーダ用に開発されたものになります。 現在のローソク足で上位足のローソク足を作成する部分 と過去の上位足のローソク足を作成する部分を 分けています。また、更新はティックごとではなく 指定した時間ごとになるので急な価格変動があった場合でも チャートがフリーズした状態には非常になりにくいということになります。 陽線や陰線の色を変更出来たり髭の太さを変更できるので非常に 見やすと思います。 各パラメータの説明: Indicator No:インジケータNoを設定します。もし同じチャートに複数適用したい場合には個々の数字を変更してください。 TimeFrame:表示する時間足を設定します。 Bullish candlestick color:陽線のローソク足の色の指定します。 Bearish candlestick color:陰線のローソク足の色の指定します。 Doji candles
AKT for MT5 (Traders Club)  機能: MAゴールデンクロスで買いサイン、デットクロスで売りサインを表示します。 MAの期間は短期足と長期足を入力できます。 MAの種類を選択できます。(SMA、EMA、SMMA、LWMA) 適用する価格を選べます。(CLOSE,OPEN,LOW,HIGH,MEDIAN,TYPICAL,WEIGHTED) サインをアラートで通知します。 サイン発生をE-mailやSNSで通知します。 表示するサインを変更することが出来ます。 サインの色を変更することが出来ます。 サインの表示された時間と価格が表示されます。 ※価格は終値になります。 Indicator Noを変えることによるこのインジケータを複数適用することができます。 これにより違う MAの期間による ゴールデンクロスと  デットクロスのサインを 表示できます。
ResiSupo (Traders Club)  このインジケータは直近の高値と安値を抜いたときに何ら方法で 知る方法はないかと思い開発されました。 機能: 指定したローソク足の本数で終値をベースに最高値と最安値の ラインを自動で引きます。 最高値と最安値のラインにタッチするとアラートで通知します。 通知はE-mailやSNSにも送信することができます。 最高値と最安値のラインを終値か高値または安値ベースにするかを選択できます。 Indicator Noを変えることによるこのインジケータを複数適用することができます。 これにより過去80本と20本などでの最高値と最安値のラインを引くことが可能になります。 現在のATRの値を画面に表示します。 これにより現在のボラリティーの状況が一目で分かります。 表示されているSLはディフォルトではATR値の1.5倍になっています。 この数値は現時点でのボラリティーの状況からの損切り幅の目安となります。 ATRのレベルにより表示の色が変わります。 ボタンを押すことによりアラートの通知を無効にできます。 ※ネットワークの不安定な環
新機能:Ver3.5 28通貨ペアの強弱も表示するようにしました。 監視ペアで最強、最弱の通貨ペアとなった場合、四つ葉のマークが出るように変更しました。 15分足、1時間足、4時間足単位での通貨ペアの強弱を表示するようにしました。 詳細な情報はこちらにサイトがあります。 https://toushika.top/tc-cs-plus-cfd/ 注:こちらはTitanのデモ口座で動作します。 XMで使用したい場合は こちらのでセットファイル を使用してください。 機能: 一目で現在の通貨の方向性と強弱が確認できます。 15M,1H,4Hでの方向性を表示します。 15M,1H,4Hでの方向が揃った場合にドットが表示されます。 通貨の相関が揃った場合にドットが表示されます。 ※相関はピアソン相関係数を使用しています。 より詳しい情報につきましてはこちらを参照してください。 https://www.mql5.com/ja/articles/5481 通貨の強弱を表示します。 現時点でのボラリティーの状況を表示します。 過去20日/過去5日/今日のボラリティーを表示しま
機能&特徴: ZigZagをもとに主要なレジスタンスとサポートラインを引きます。 各時間足で押し安値、戻り高値を簡単に把握できます。 現在何波目なのか簡単に把握できます。 ※ トレンド転換時はカウンターは1、継続時は2,3,4..となります。 ※ちなみにこちらはZigZagの谷山を数えています。エリオット波動数ではありません。 現在買い目線でいるべきなのか売り目線なのか簡把握できます。 過去2つのZigZagラインで静的にフィボナッチを引きます。 今の値動きで動的にフィボナッチを引きます。 逆フィボナッチ(静的なフィボナッチのみ)に変更することも可能になります。 ボタンにより以下の操作が可能になります。 1.ZigZagラインの表示、非表示 2.ノーマルフィボナッチ、逆フィボナッチの切り替え ※環境により表示に時間が掛かる場合があります。 3.1分足、5分足、15分足で1つ上のZigZagラインが引けるようになりました。 4.レジスタンスとサポートラインを再描写します。  トレンド継続や変換をアラートで通知します。 エリオット3波発生の
移動平均線クロス、ボリンジャーと移動平均線のクロス、移動平均線の角度でサイン表示 MT5インジケータ こちらに サイト があります。 このインジケータは3つのパターンでサインを表示(切り替え可能)します。 ① 移動平均線のクロス ② ボリンジャーバンドと短期移動平均線とのクロス ③ ボリンジャーバンドと短期移動平均線とのクロスと、中期移動平均線と長期移動平均線の角度 ⓸ ボリンジャーバンドと短期移動平均線とのクロス(サインを交互に表示) 移動平均線のクロス 指定した短期移動平均線と長期移動平均線のゴールデンクロスでは買いサイン、デットクロスでは売りサインを表示します。 ディフォルトでは短期は5,長期は20となっています。 もちろん変更可能になります。 移動平均線の種類をEMA(指数平滑移動平均線)やSMMA(平滑化移動平均)などに変更可能で適する価格も変更可能になります。 ボリンジャーバンドと短期移動平均線のクロス ボリンジャーバンド(以降BB)と短期移動平均線のクロスでサインを表示します。 ディフォルトではBB+1σと5MAのゴールデンクロスで買いサイン、BB-1σと5MAのデット
MT5インジケータ TC-Alerts 開発経緯: 実はFXで簡単に勝てる手法があるんです。 それは。。。 主要な(4時間足以上、4時間足、日足、週足)のレジスタンスとサポートラインの反発を狙う FXは一方向には進まず90%以上で 必ず、必ずと言っていいほど、 どこかで反発します 。そこは大抵主要なレジスタンスとサポートラインまたは主要なフィボナッチラインなのです。 なのでそこに水平線を引いて ただ待つ のです。そこに到達したら、1分足や5分足に落として 長いヒゲ、ダブルボトム、ダブルヘッド、トリプルボトム、トリプルヘッド、三尊、逆三尊などの反転の形成を確認してエントリーする。 または、こちらを使用して https://www.mql5.com/ja/market/product/53987 強弱が弱くなってきたのを確認してエントリーすればいいのです。 これだけです。シンプルです!! うまく行くと、長期足レベルでレジスタンスとサポートライン間、つまり頭から尻尾まで取れる可能性もありますし、リスクリワードが異常にいいです。 そのためには、チャートに主要なレジスタンスとサポートラインに
ボリンジャーバンドは、価格変動を分析するためのテクニカル分析の1つのツールになります。 ボリンジャーバンドには、中心線と2つのバンドがあります。 中心線は、一般的には移動平均線(通常は20日間の単純移動平均)として計算されます。この中心線は、一定期間の価格の平均値を表しています。 ボリンジャーバンドのバンドは、中心線の上と下に等間隔で配置されます。通常は中心線から2つの標準偏差分だけ離れた位置に設定されます。 拡大(Expansion)とは、ボリンジャーバンドが広がる状態を指します。 つまり、上下のバンドが中心線から離れ、価格の変動範囲が広がっていることを示します。拡大は、相場が活発になり、価格の大幅な変動が起こりやすいことを示すことがあります。 収縮(Contraction)とは、ボリンジャーバンドが狭くなる状態を指します。 つまり、上下のバンドが中心線に近づき、価格の変動範囲が狭まっていることを示し、相場が方向感を失い、一時的に価格変動が鈍化していることを示すことがあります。 ボリンジャーバンドの収縮と拡大は、価格変動のパターンや相場の特徴を捉えるために重要な指標になり
TC-Supportは手動取引とEA運用のために開発されたパネルになります。 このパネルでは、リスクリワード、リスク計算、リスク管理など資金管理、 トレーリングストップ機能、ブレークイーブンなどポジション管理が可能になります。 その他、便利な機能があります。 詳細な情報はこちらにサイトがあります。 デモ口座で動作するEAはこちらに置いてあります。   https://toushika.top/ mt5-tc-support / Disable Auto Trading  の 機能はMQL5では外部のDLLの利用は許可されませんので使用できません。 おもな機能一覧 資金管理 リスクリワード計算 ロット計算 損失金額計算 最大ロット数の設定 設定したリスクパーセンテージでヘッジポジション EA運用 最大損失金額またはパーセンテージによる強制クローズ EA運用 資金破綻回避  ポジション管理 成行、指値、Stop Limit注文に対応 ポジションを部分的にクローズ トレーリングストップ機能 一定の距離を超えてたらSLを移動 利確条件設定
Filtrele:
Değerlendirme yok
Değerlendirmeye yanıt